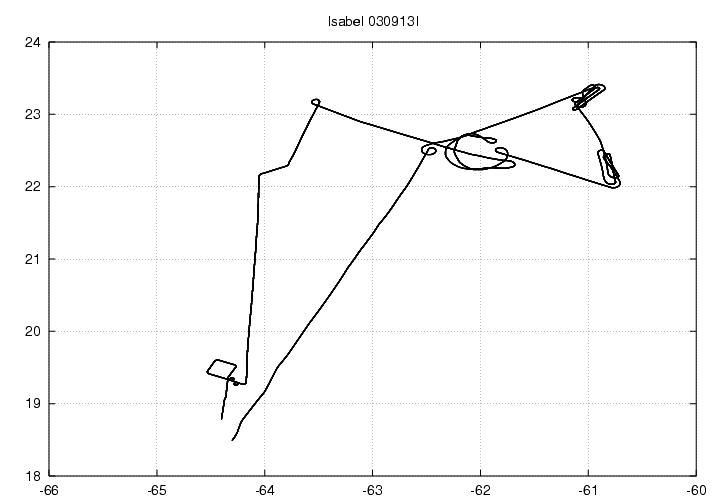
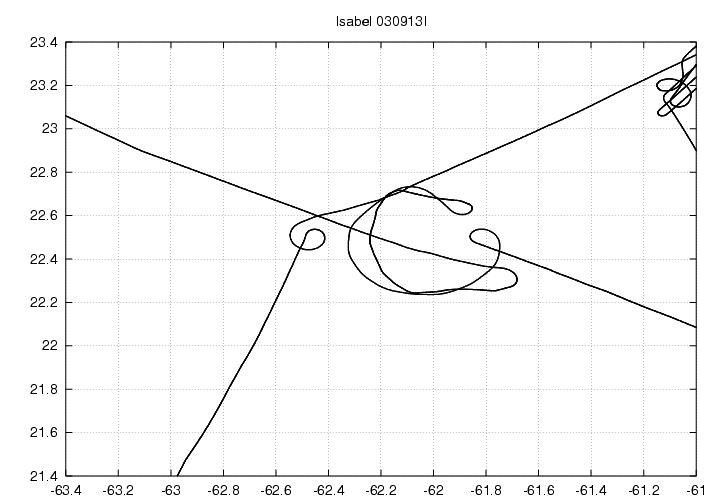
Figure 1. Flight track of N43RF on 13 September 2003.
| A/C commander | Randy TeBeest |
| Co-pilot | Dave Tennesen |
| Co-pilot | Tom Strong |
| Navigator | Carl Newman |
| Flight Engineer | Dewie Floyd |
| Flight Director | Paul Flaherty |
| Flight Director | Barry Damiano |
| Data Tech | Terry Lynch |
| El Tech | Damon Sans Souci |
| Data Tech | Ray Tong |
| AXBT Tech | John Smith |
| Lead Scientist | Mike Black |
| SFMr/CIP Scientist | Eric Uhlhorn |
| Radar/Dropsonde Scientist | Rob Rogers |
| BAT probe Scientist | Jeff French |
| CBLAST Scientist | Jim Laswell |
| Observer | Mike Montgomery (CSU) |
Mission Plan :
This flight was the second mission into Hurricane Isabel on N43RF in support of Paul Chang's Ocean Winds experiment. Takeoff was planned for 1500 UTC from St. Croix. Calibration maneuvers for the BAT probe were planned during the ferry to Hurricane Isabel. Upon completion of the calibration maneuvers the plane would go to an IP 100 n.mi. NW of the center of the storm and search for a clear area to perform a stepped descent pattern in that area. An eye penetration would then occur, with N43RF dropping sondes on the inbound and outbound legs. Upon exiting the eye on the SE side, another stepped descent pattern would be attempted there. The altitudes of the aircraft on the eye penetration was planned to be 12,000 ft., while the altitudes of the stepped descent patterns (along-wind and across-wind) would again be 1200, 900, 600, 400, and 200 ft. A final penetration would again be performed from the NE toward the SW side of the storm, after which point the plane would return back to St. Croix. No real coordination was planned with N42RF for any Ocean Winds component, though some coordination was planned for the stepped descent portions, which is a pattern from the CBLAST experiments. The flight was to recover at 5:00 PM AST at St. Croix, USVI.
Mission summary and evaluation:
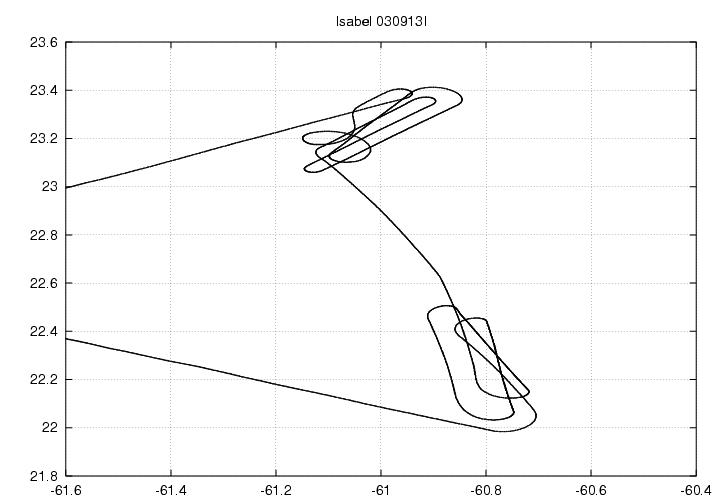 (a) |
 (b) |
 (c) |
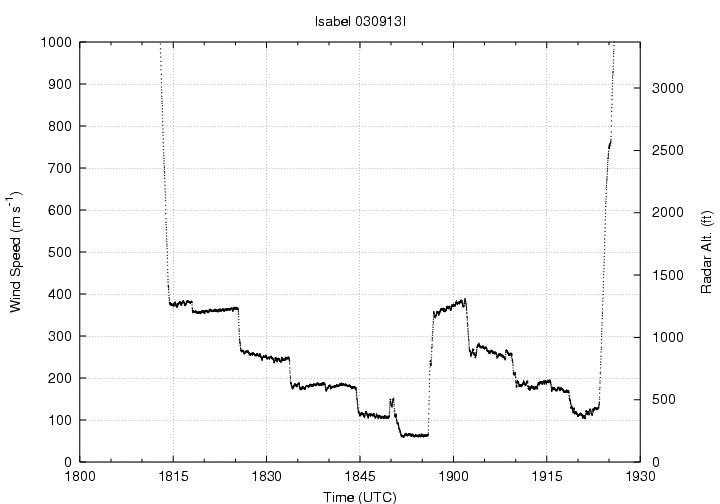
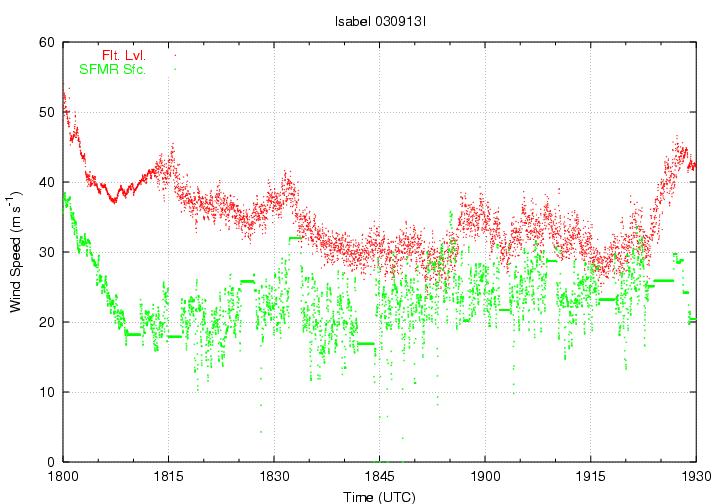
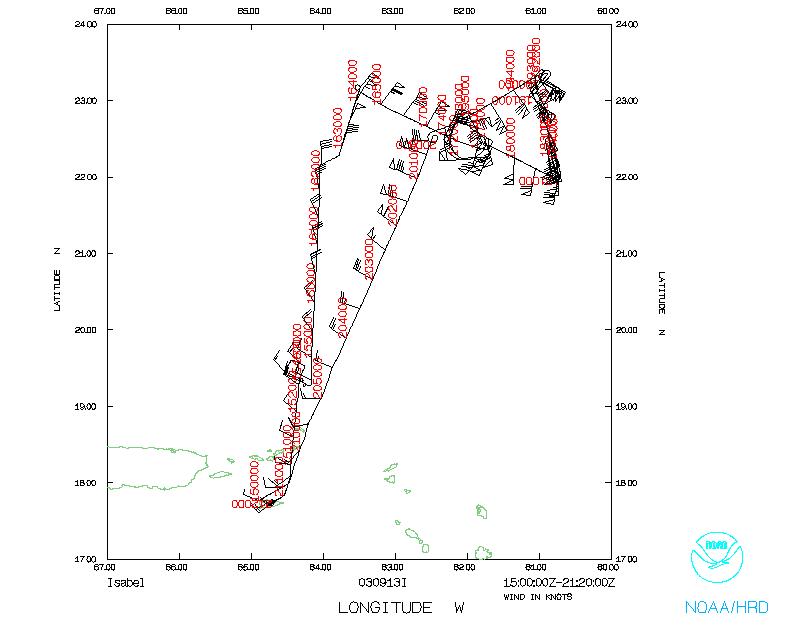
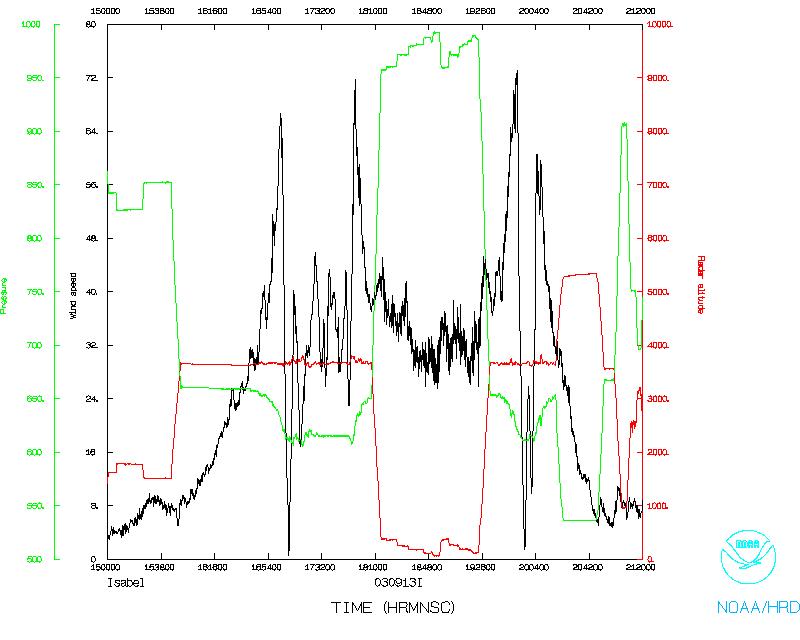
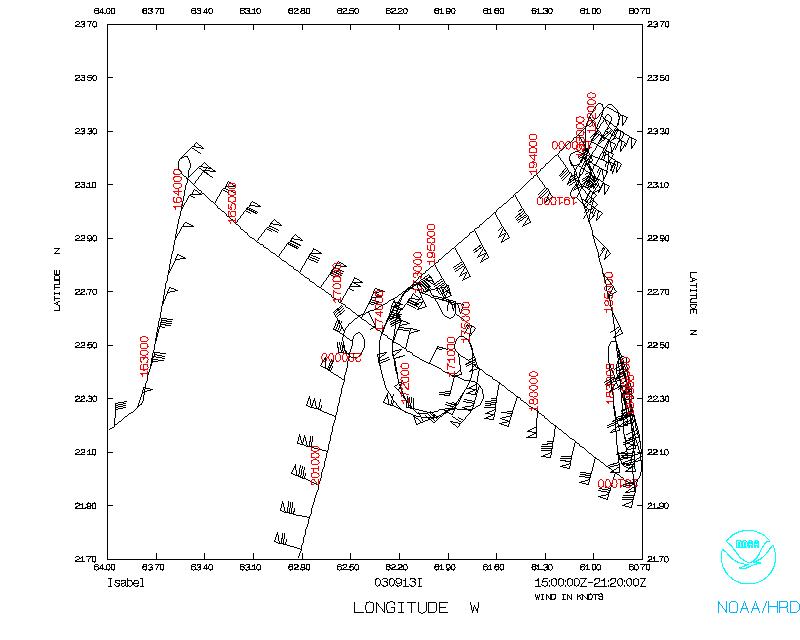
| Figure 2. (a)Flight track and time series of (b)altitude (ft) and (c) flight level and surface wind speeds (m/s) during stepped-descent pattern of N43RF on 13 Sept. 2003. | ||
A circumnavigation was made within the eye in order to map out the structure of the eyewall using the tail radar operating in F/AST mode. An outbound leg to the SE was then performed. It was on this side of the storm that the highest MBL winds were measured (171 kts), though the lowest wind measured was at 196 m. On the SE side of the storm an area was found to begin the stepped descent maneuvers. An upwind leg at 1200 ft was performed (Fig. 2a), followed by a downwind leg at 900 ft, an upwind leg at 600 ft, and a downwind leg at 400 ft. One difference between today's pattern and previous patterns was that the 200 ft leg was also downwind, in order to minimize the length of time at that altitude. After completing the 200 ft downwind leg, an outbound (across wind) leg was performed at 1200 ft, followed by an inbound leg at 900 ft, and outbound leg at 600 ft, and an inbound leg at 400 ft. No cross-wind leg was performed at 200 ft. Surface wind speeds during the stepped descent maneuvers (Fig. 2b) ranged from 40 to 60 kt, though there is some suggestion that these SFMR measurements had a low bias on the order of 10 kt. Upon completion of the stepped descent patterns, a final penetration was performed from the NE to the SW of the storm. Three drops were released on the NE eyewall, with maximum MBL winds of 145 kt measured. Flight-level winds of 150 kts were measured on the inbound leg, and maximum surface winds from the SFMR were measured at 120 kts (Fig. 4). Two drops were released on the SW side of the storm. One of those drops measured 175 kt at 1500 ft above the surface, but wind measurements below that altitude were spotty. From that point N43RF returned back to St. Croix, landing at 2130 UTC.
|

|

|
| Figure 3. Flight track and time series of flight level and surface wind speeds (m/s) during first and second eye penetration of N43RF on 13 Sept. 2003. | ||
One notable aspect of this flight, and of the flights the day before and after, was the presence of mesovortices along the inner edge of the eyewall. These features were first clearly seen on high-resolution satellite imagery before taking off. A clear pattern of 5 vortices was evident in visible satellite imagery. Upon entering the eye, lower fuselage radar showed a clearly pentagonal eyewall structure (Fig. 5), indicative of mesovortices at each of the vertices of the pentagon. A LF radar sweep taken 10 minutes later showed the persistence of this polygonal eyewall structure, though it had rotated approximately 20-30 degrees cyclonically during that time period. It must be stated, however, that it is not certain that the direction of rotation is cyclonic, since only two times are shown here. Higher time-resolution imagery are required to better ascertain the changes in the configuration of the eyewall during this time period. Also evident, on both the LF and nose radars, were fingers of reflectivity curving cyclonically into the eye from the eyewall. This may indicate mixing of high angular momentum and high vorticity air from the eyewall into the eye, which is a characteristic of these mesovortices. Further investigation into this and the other flights are planned to address this issue.
 (a) |
 (b) |
|
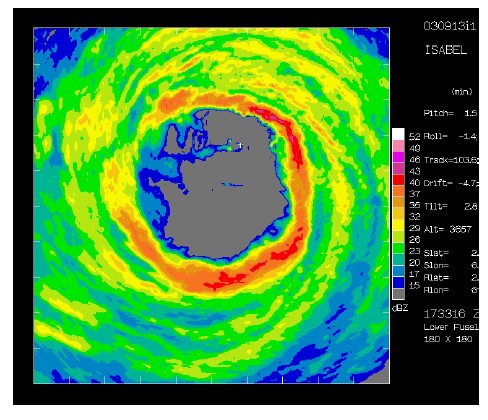
Figure 4. Lower fuselage radar single sweep images of Hurricane Isabel
at (a) 1723 UTC and (b) 1733 UTC 13 September 2003. | |
Problems :
The performance of the instruments was spotty during this mission. The drops in general worked adequately, though there were some instances where the winds in the lowest 100-150 m were not measured. As mentioned above, there was some indication that the SFMR measurements of surface wind speeds were about 10 kt too weak. Further calibration of this instrument is needed. The BAT probe worked fine, and the CIP probe collected some measurements, though it was turned off at other times during the mission. The tail radar had problems with the stabilization, in that it was reporting tilt angles that were wildly fluctuating on short time scales. It is not known at this point if this problem was a reflection simply of the recording of tilt angle or whether it negatively impacted the collection of data.
SRA had some problems and is not available. Ed Walsh stayed on the ground to work on it.
-Rob Rogers
Mission Data :
LPS log | Radar log | Drop log
PDF of plots of ALL sonde drops
Flight Data | ||
 Flight track |
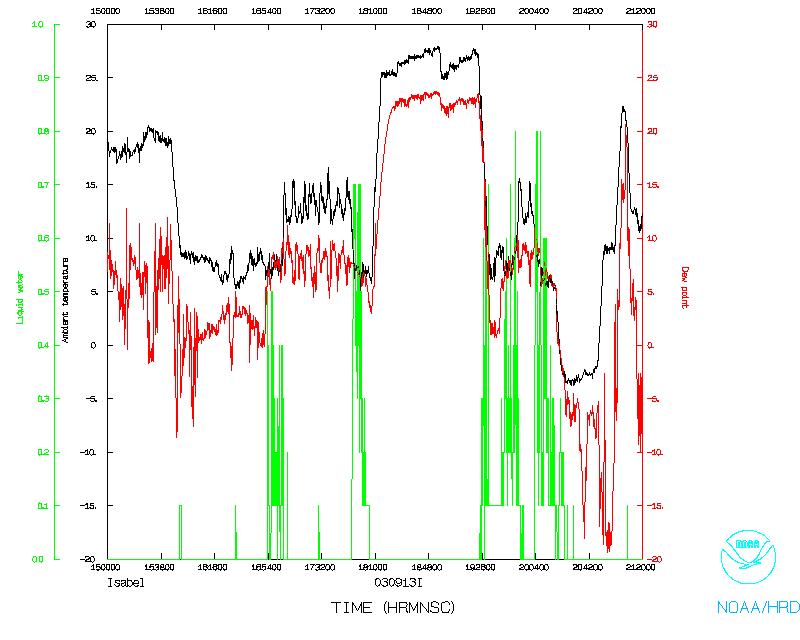 Temperature and Moisture |
 Wind and Altitude |
 Flight track detail |
||
20030913I1
| Leg | Track | Alt | Start | End
| Upwind | 170 | 1200 | 181726 | 182511
| Downwind | 355 | 900 | 182822 | 183200
| Upwind | 160 | 600 | 183427 | 184150
| Downwind | 350 | 400 | 184527 | 184940
| Downwind | 340 | 200 | 185135 | 185553
| Outward | 040 | 1200 | 185900 | 190156
| Inward | 220 | 900
| 190333 | 190842
| Outward | 045 | 600 | 191016 | 191609
| Inward | 210 | 400 | 191905 | 192310
| | ||||
Return to Mission page.