LPS log | Radar log | Drop log | Flight Director log
Flight Data | ||
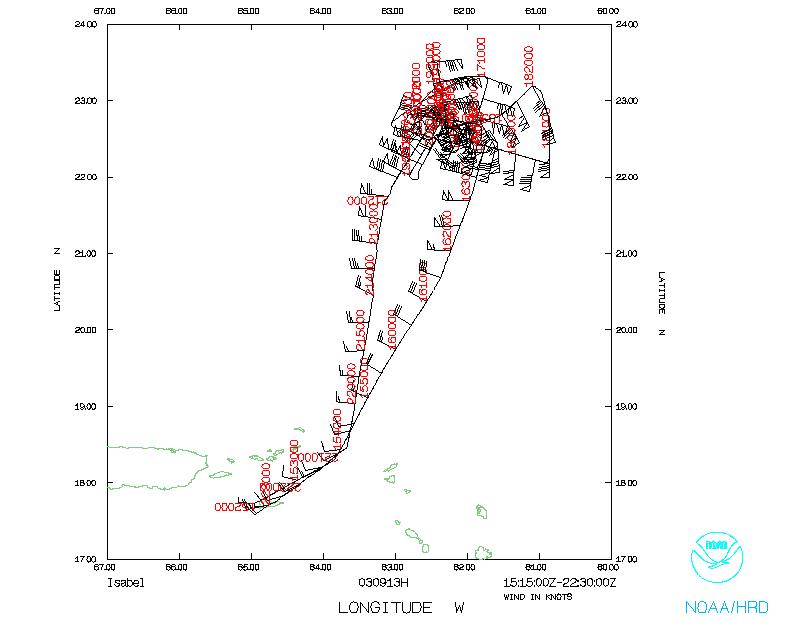 Flight track |
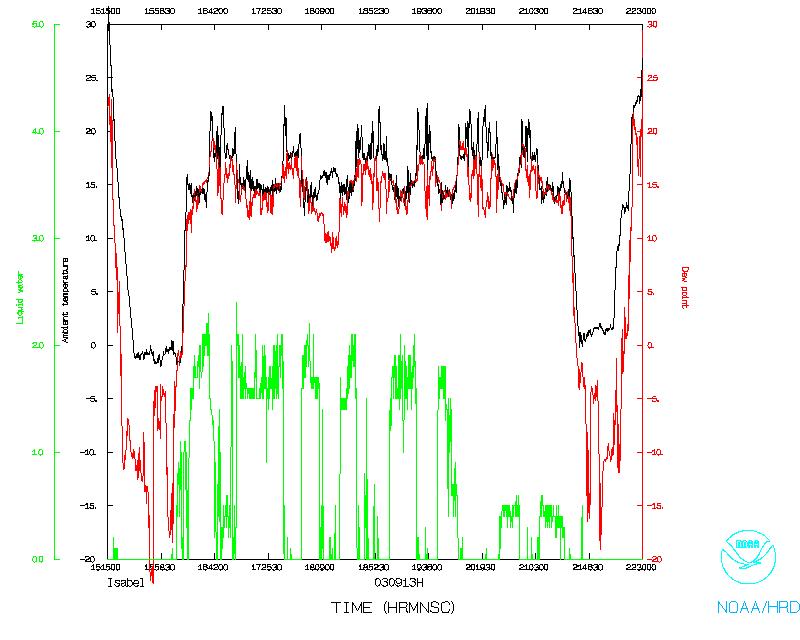 Temperature and Moisture |
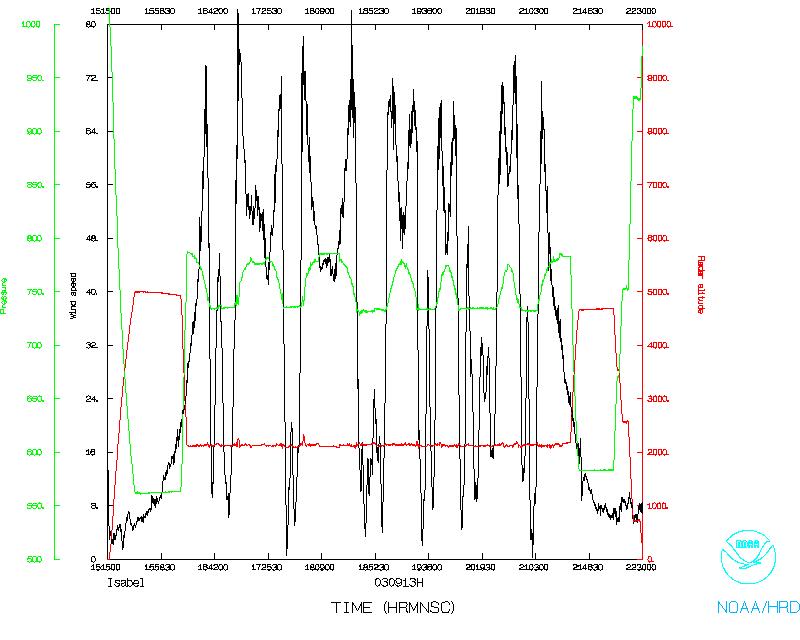 Wind and Altitude |
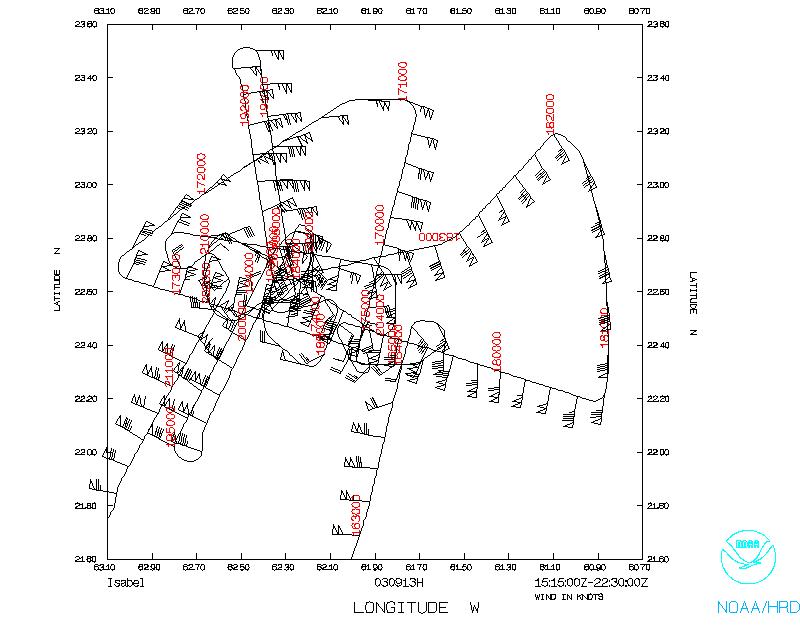 Flight track detail |
||
| A/C Commander | Phil Kennedy |
| Co-pilot | Harris Halverson |
| Co-pilot | Tom Silah |
| Navigator | Devin Brakob |
| Flight Engineer | Greg Bast |
| Flight Director | Tom Shepherd |
| Flight Director | Marty Mayeaux |
| Data Tech | Bobby Peek |
| Radar Tech | Rogers |
| AVAPS | Sean McMillan |
| Sci Programs | James McFadden |
| Lead Scientist | Paul Chang (NESDIS) |
| Satellite Scientist | Zorana Jelenak (NESDIS) |
| IWRAP Scientist | Beth Kerr (UMass) |
| IWRAP Scientist | D Esteben (UMass) |
| Sonde Scientist | Sim Aberson |
| Radar Scientist | Chris Landsea |
| Workstation Scientist | Paul Leighton |
| Media | Mike Von Fremd (ABC) |
| Media | Dave Herndon (ABC) |
The flight will leave St. Croix, USVI at 11:00 AM AST and recover at 6:00 PM AST at St. Croix, USVI.It is doing a one plane Ocean Winds experiment.
Mission Summary :
The flight left St. Croix, USVI at 11:05 AM AST. This mission, in conjunction with NRF43, was an Ocean Winds experiment (main emphasis is to collect SFMR/scatterometer/ GPS winds in high wind/rain regions) that was piggy-backed with some CBLAST work on 43 in their doing a stepped descent. The flights were not coordinated on this day with 43, as this was not a high priority. An in-flight decision was made to not launch the high density (8 sonde sequence) on each leg of the figure-4, as it was thought that the hurricane had weakened some based upon the 45 nmi diameter eye from satellite and radar. This actually was not the case, as we found later in flight.
The flight pattern first consisted of a figure four with passes from south to north and then west to east with three drops launched just inward of the flight level RMW. Then there were four wedge patterns flown, where on an outbound leg three sondes were launched in the eyewall (drops called by the LPS) followed by an immediate inbound leg where the plane was routed over the splash location of the middle drop. (This would allow a direct comparison of SFMR/scatterometer with drop data.) Thus there were a total of 24 sondes lauched and six eye penetrations. Of these 24 sondes, 3 had no data (2 no launch detects and one sonde stuck in the tube). However, only 5 had winds within 15m of the surface. Peak winds recorded: 160 kt flight level (north eyewall ~1700 UTC), 135 kt SFMR (north eyewall ~1700 UTC), 125 kt surface (1700 and 1736 UTC) and 205 kt 805 mb/ 158 kt MBL (1752 UTC).
One sonde dropped in the eastern eyewall may be of particular interest. During its ascent, it encountered an updraft measured at over 22 ms-1, and rose more than 500 feet during this time. The updraft continued for about 90 seconds during which time the sonde hovered at about 4000 ft MSL. The winds increased from the ambient value to 205 kt, and oscillated between that value and about 60 ms-1, and an oscillation with the same period occurred in the radial component of the wind. This suggests that the sonde was advected by the winds in a meso-vortex in the eyewall, and this will have to be confirmed by further study. Regardless of the cause, this sonde provides the fastest wind ever measured in a tropical cyclone.
One perception about Isabel that I wanted to convey is how it classically fits the "annular hurricane" idea that John Knaff has discussed. When we flew the hurricane at 7,000', Isabel had a rather large eye of about 40 nmi diameter with a wide 15 nmi eyewall surrounding it. Aside from a few small mainly stratiform bands, there was essentially no prominent rainbands outside of the eyewall. (The best analogy is that it looked like a big truck tire.) This wasn't to say that the eyewall didn't fluctuate. On the contrary, we saw on the lower fuselage radar filaments from the eyewall being drawn into the eye cyclonically with scales of a couple nmi spacing and in length. These appeared to be connected with enhanced turbulence when we flew through them and may have been instabilities associated with the very sloped wind profile inside the flight level RMW. Additionally, the eyewall went from circular to pentagonal and back to circular during our 6 hours in the storm. Finally, the thick eyewall itself was sometimes a continuous band of 40-45 dbz reflectivities and sometimes fragmented more with the eyewall appearing more as 3 or 4 closely spaced bands. Throughout it all, there was typically only one RMW peak at flight level and at the surface, but that it had a moderate slope (few miles) between the two levels. Perhaps the most surprising thing to me was that we continued to have 160 kt peak flight level winds, 180-200 kt GPS drop data below us and 135 kt peak surface winds (SFMR) despite the significantly larger RMW than on Friday (12th). I was expecting (naively) that the winds would have relaxed some given the larger size. (However, the central pressure was about 10 mb higher.)
PDF of plots of ALL sonde drops
Chris Landsea
Mission Data :
LPS log | Radar log | Drop log | Flight Director log
Flight Data | ||
Flight track |
Temperature and Moisture |
Wind and Altitude |
Flight track detail |
||
Return to Mission page.