| Aircraft Commander | Justin Kibby |
| Co-pilot | Pat Didier |
| Co-pilot | John Rossi |
| Navigator | Sam Urato |
| Flight Engineer | Paul Darby |
| Flight Engineer | Chris Lalonde |
| Flight Director | Mike Holmes |
| System Engineer | Joe Greene |
| Data Technician | Mike Mascaro |
| AVAPS Operator | Nick Underwood |
| LPS | Heather Holbach | HRD |
| Radar | Hui Christopherson | HRD |
| Dropsonde | Kathryn Sellwood | HRD |
| LPS | Paul Chang | NESDIS |
| Observer | Zorana Jelenak | NESDIS |
| Radar | Joe and Nancy Griffin | HRD |
Mission Plan :
This is an NHC-tasked fix mission for the 1130Z and 1730Z center fixes of Tropical Storm Isaac. An on-time fix is considered T - 1 hour to T + 30 minutes. The planned flight pattern is to fly a rotated Figure-4 with 75 nm legs. NHC has requested endpoint and center dropsondes on the first Fig-4 and only center dropsondes on the subsequent passes. HRD has requested midpoint dropsondes on the first two Fig-4s. We will hunt and fix the center on each center pass. The flight level is 5000 ft pressure altitude.
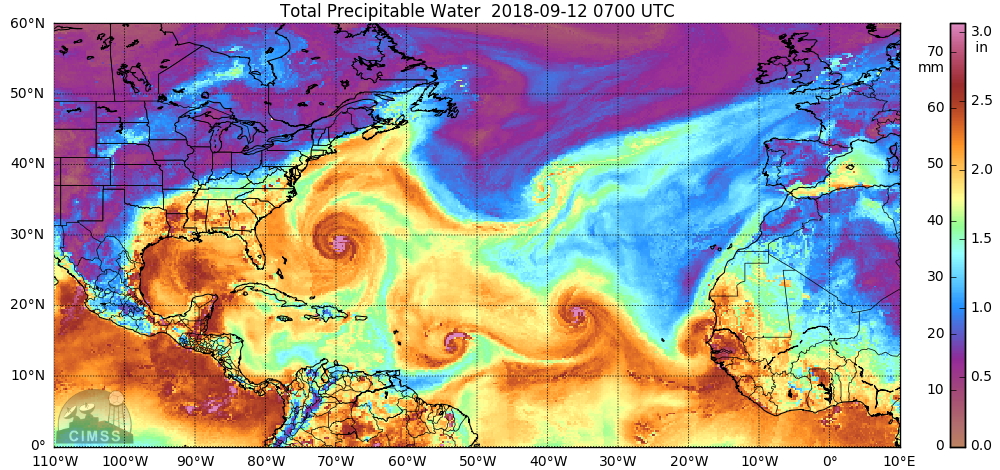 Figure 3: CIMSS analyzed total precipitable water for 07Z September 12, 2018. Image courtesy: CIMSS, tropic.ssec.wisc.edu. |
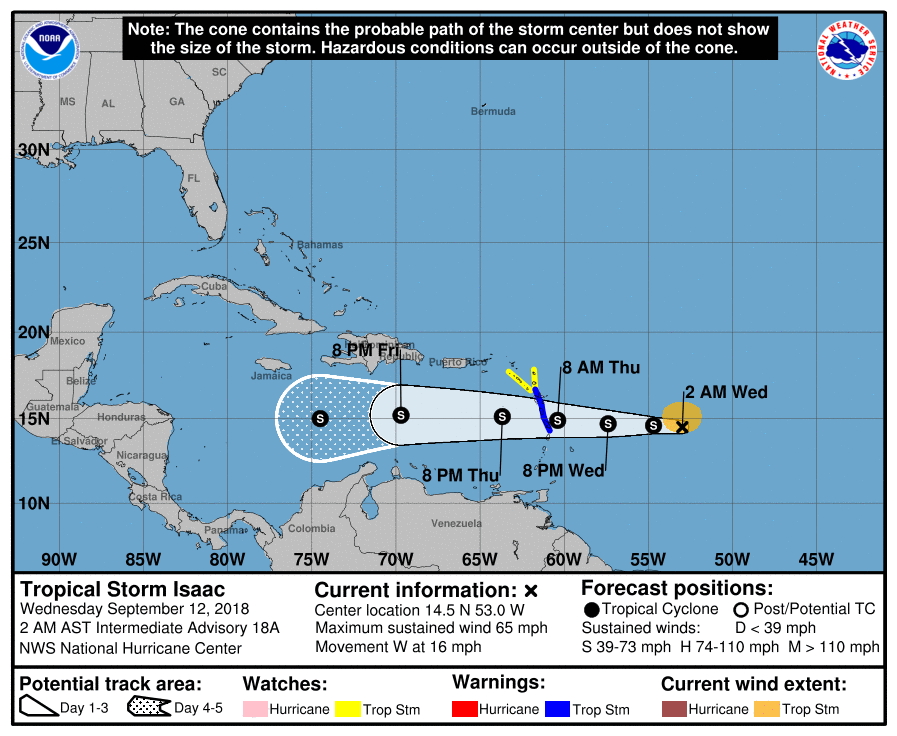
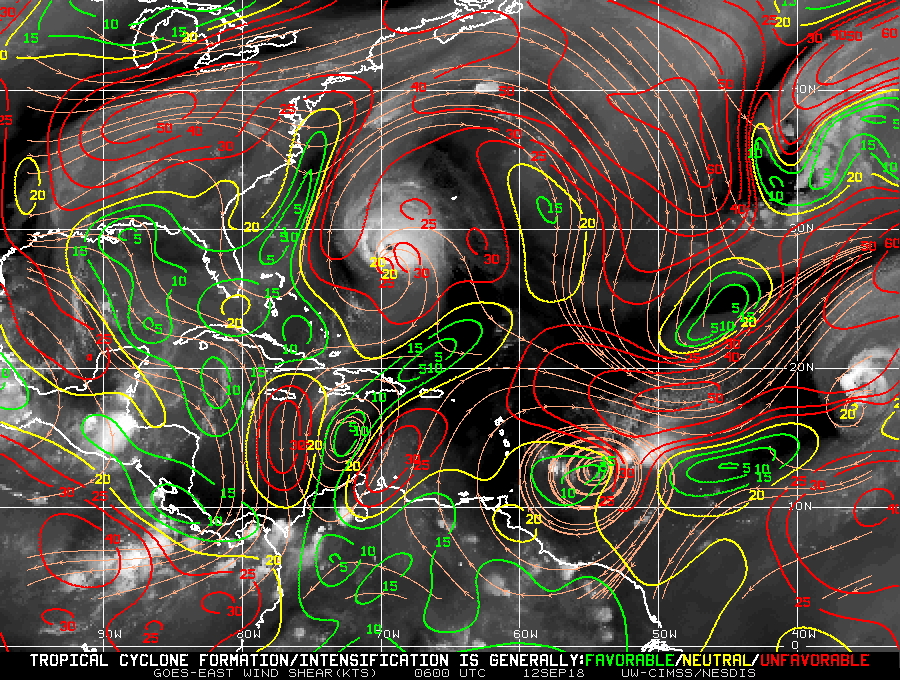
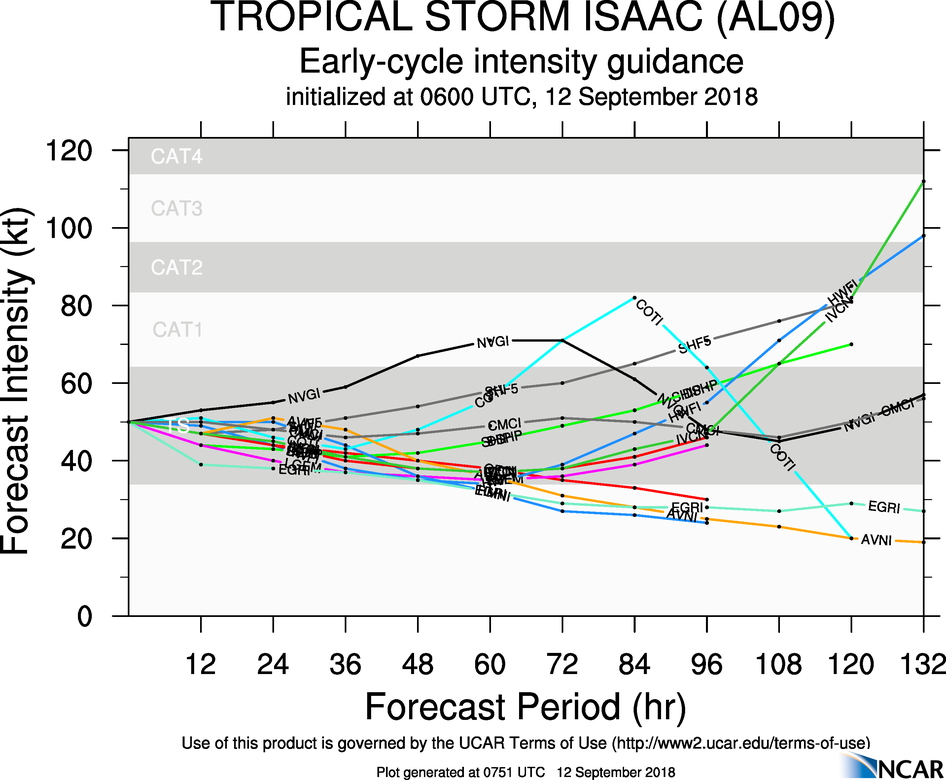
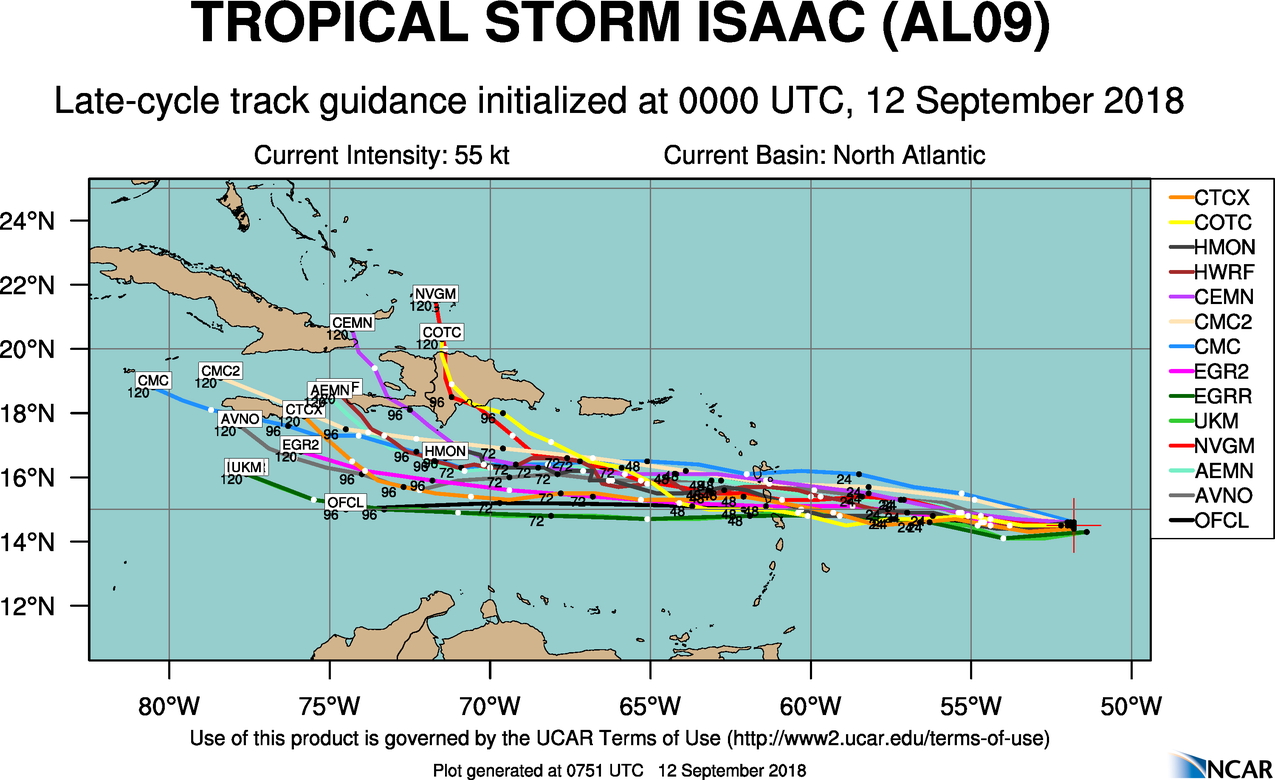
Isaac is currently a 50 kt tropical storm as of the 09Z NHC advisory. It has a minimum central pressure of 1000 mb and is centered at 14.5°N 53.5°N. The official NHC forecast is for Isaac to continue moving towards the west into the Caribbean and slowly weaken (Fig. 1). Isaac is currently battling off moderate to high vertical wind shear (Fig. 2; SHIPS analyzed shear is 18 kts from 295° at 06Z) and dry air to its west and south (Fig. 3). It is moving into an area with warmer SSTs. There is some uncertainty in the models as to when it will dissipate (Fig. 4) or if it will turn northward while in the Caribbean (Fig. 5).
Mission Summary :
| Take off | Landing
| St. Croix, USVI
| 09:44 UTC
| St. Croix, USVI
| 18:34 UTC
| Penetrations
| 5
| | ||||
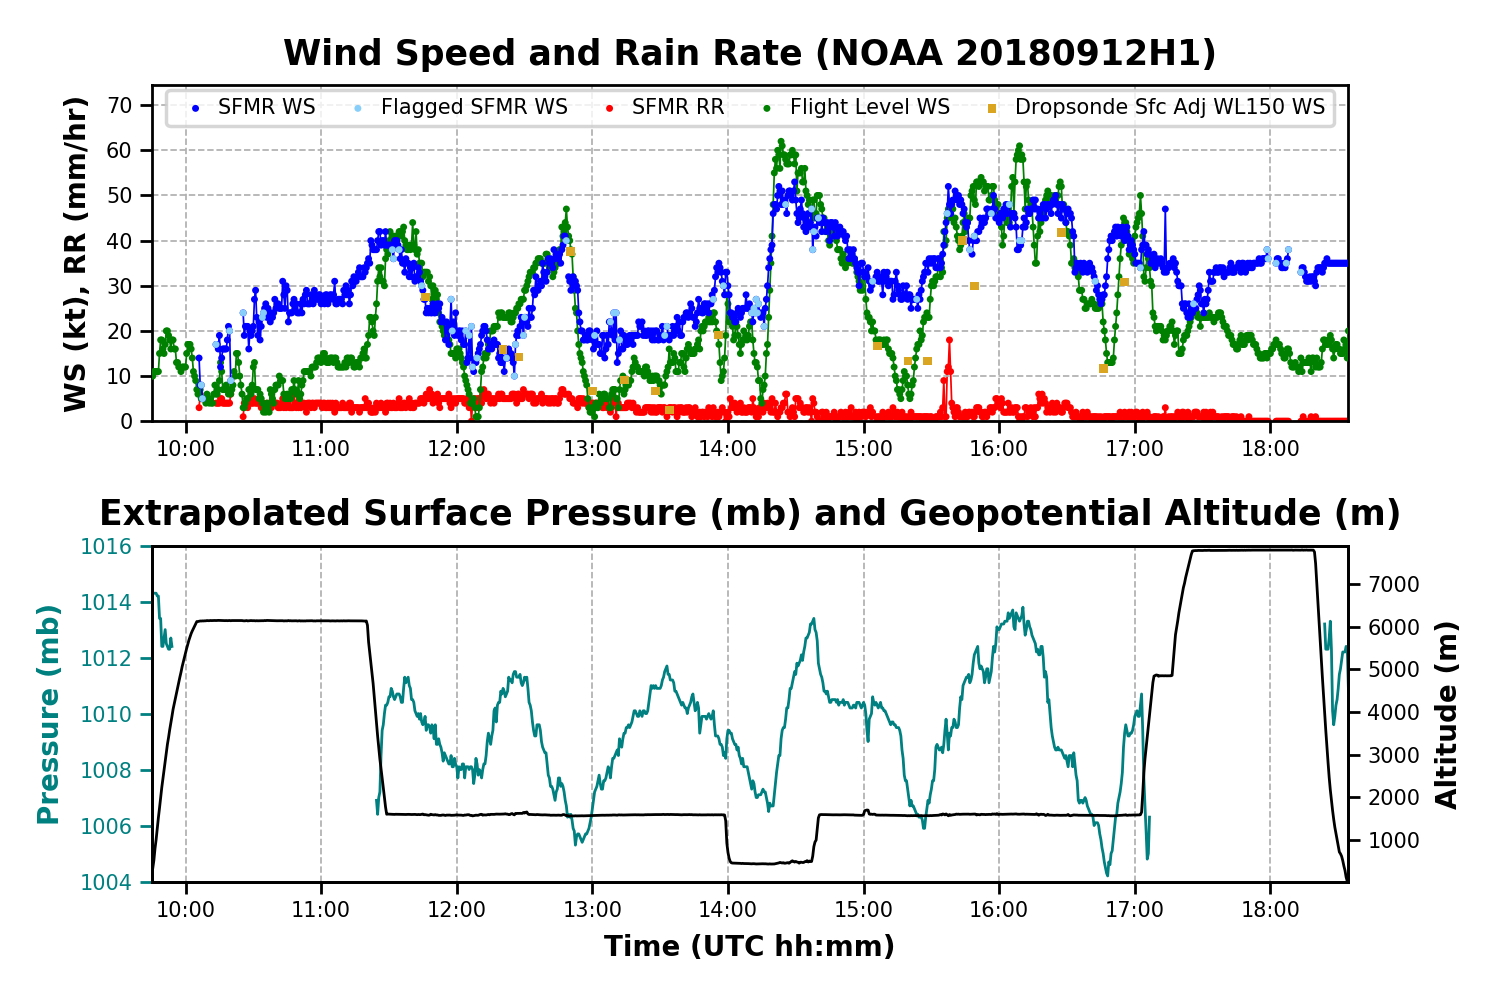
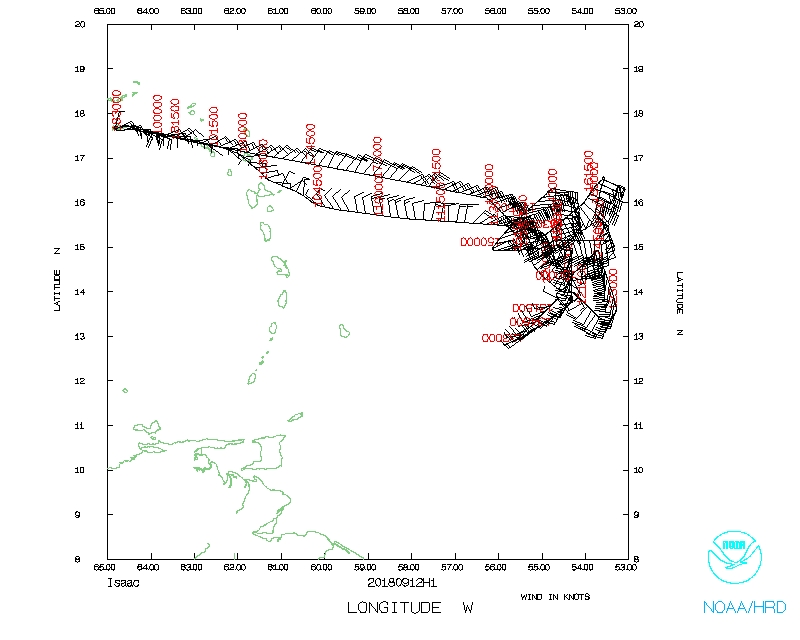
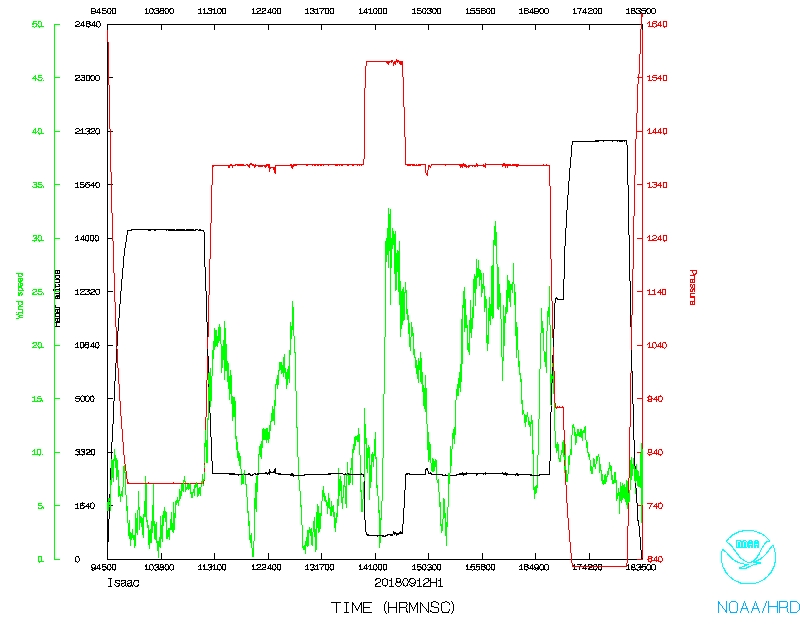
We completed five center fixes of TS Isaac for NHC. The actual flight track is shown in Figure 6. There was a cloud shield with some deep convection over the flight level center for our first pass (Fig. 7). The forecasted position provided by NHC for our first fix was 14.6°N 54.9°W and the flight level center was found to be at 14.0° N 54.3°W. For all subsequent passes the low level center was exposed and much further north than the first fix. All but the third fix were performed at 5000 ft pressure altitude. The third fix was performed at 1500 ft pressure altitude, but it was determined to be too dangerous with flight level winds > 50 kts and being in the clouds to perform anymore fixes at that altitude, so we returned to 5000 ft pressure altitude. The final two fixes were done using a combination of flight level winds, visible satellite imagery, DR centers, and visual examination of cloud curvature by the pilots and LPS. We observed maximum flight level winds of 62 kts and SFMR winds of 53 kts with a minimum central pressure of 1004 mb (Fig. 8).
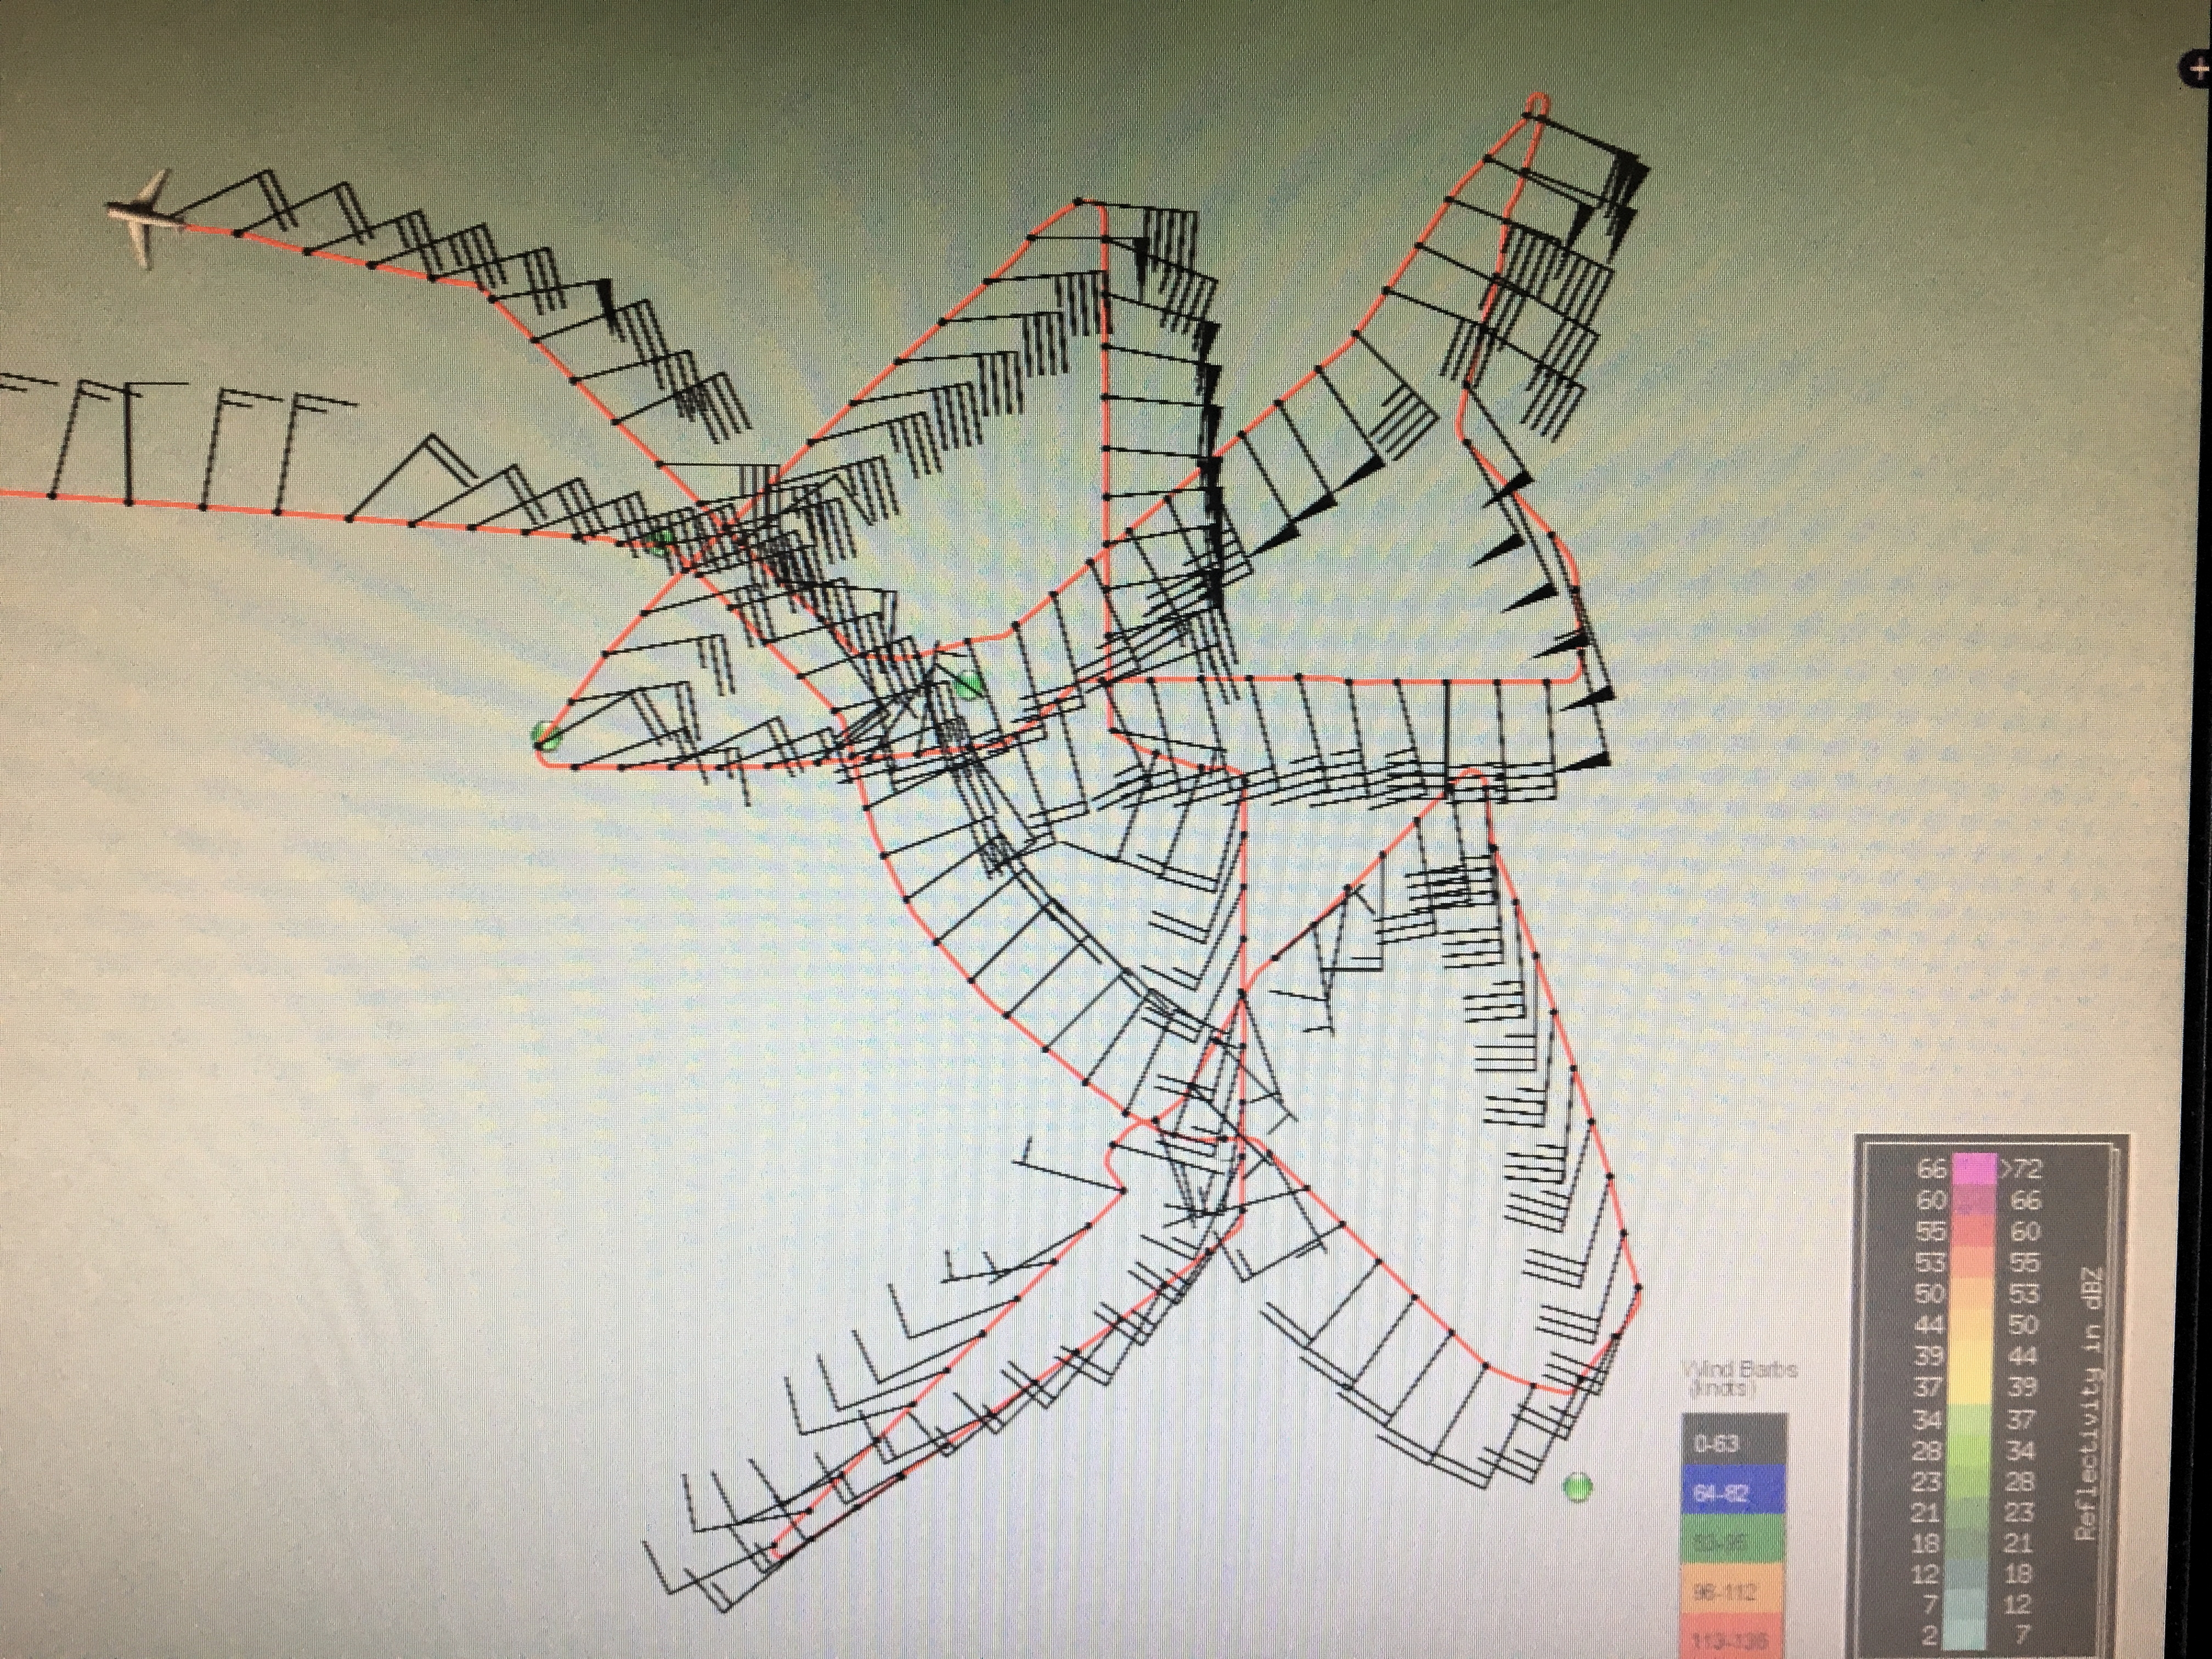 Figure 6: Actual flight track for mission 20180912H1. |
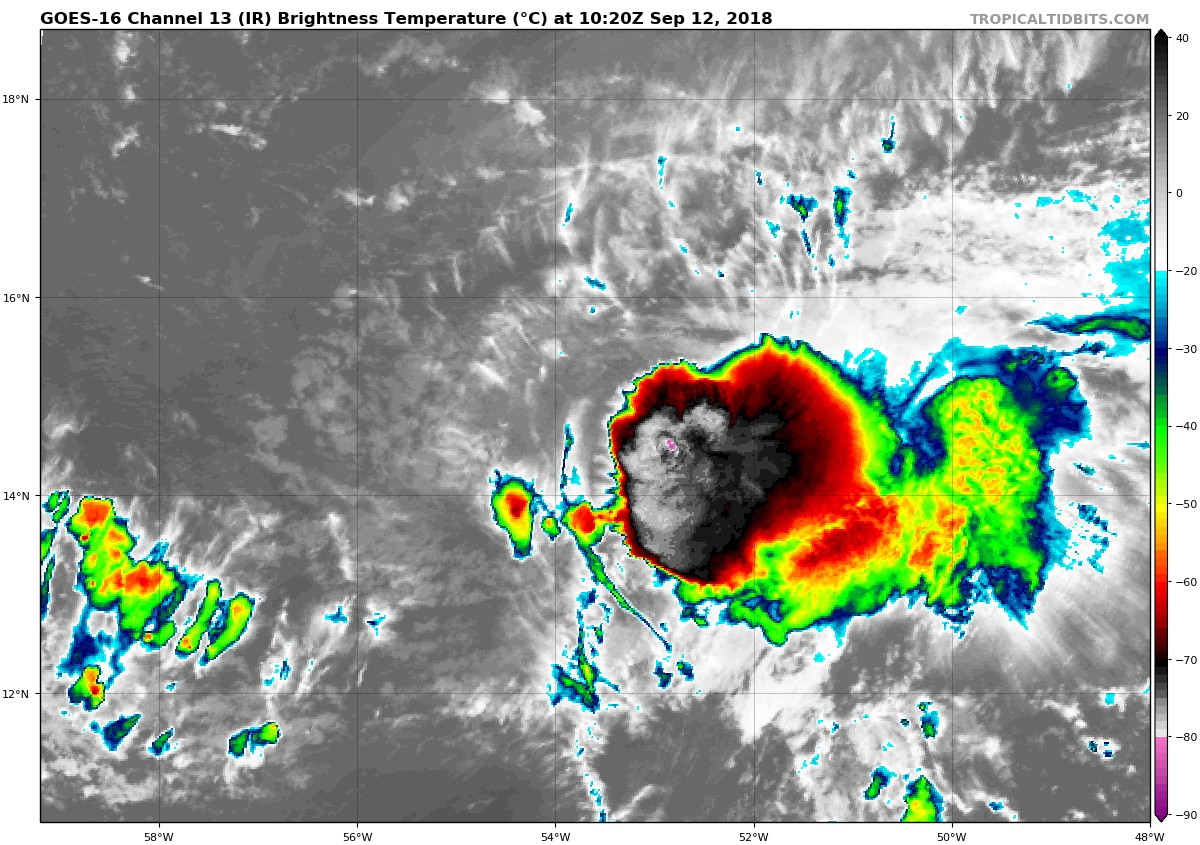 Figure 7: GOES-16 IR imagery from 1020Z on September 12, 2018. Image courtesy: www.tropicaltidbits.com |
Mission Evaluation:
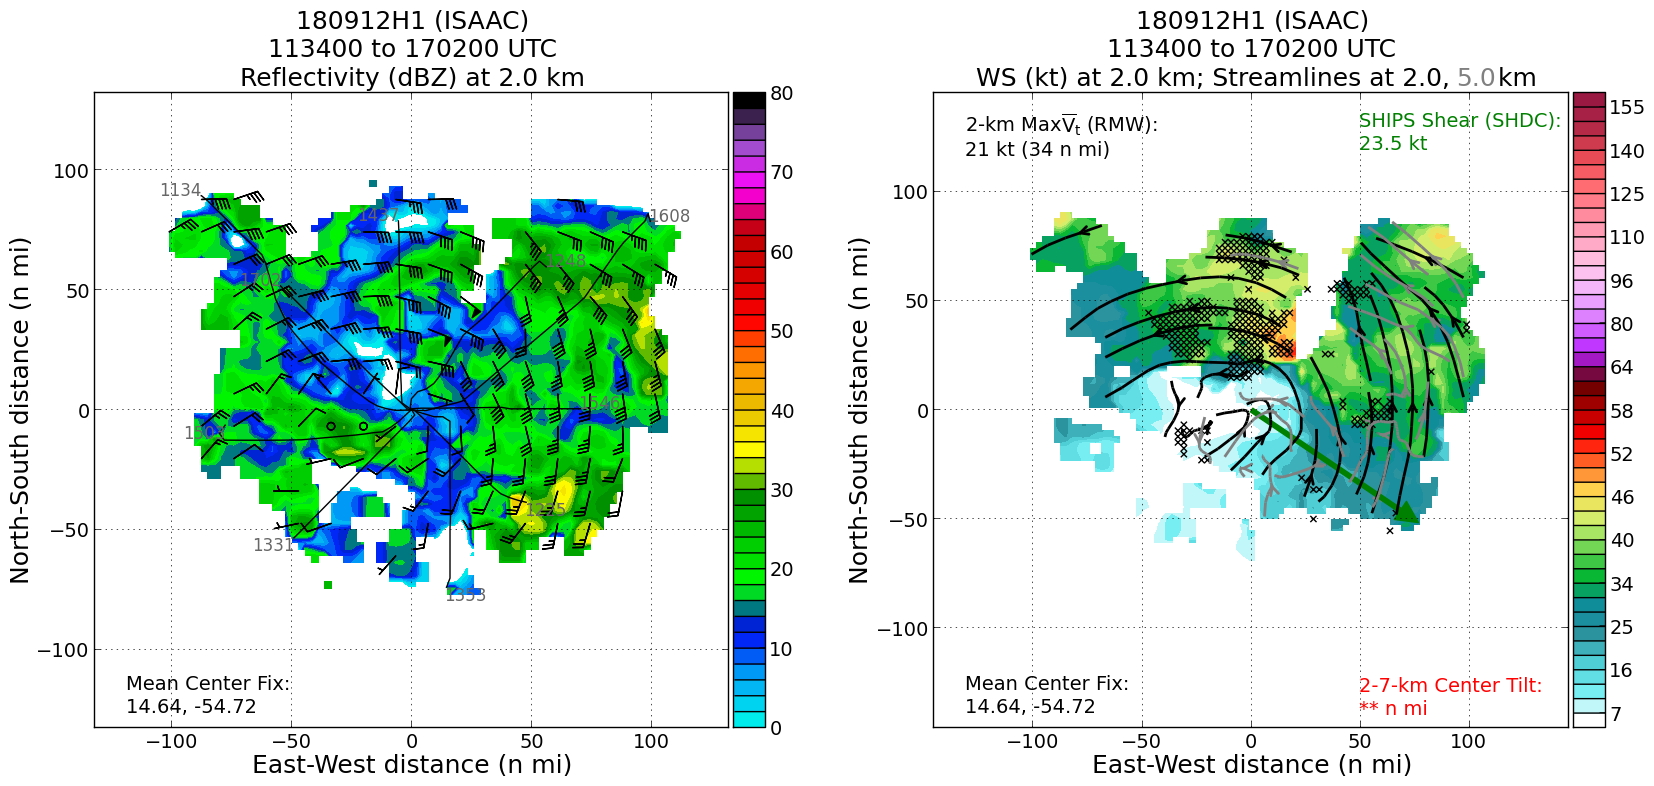
We were able to complete the 1130Z and 1730Z fixes for NHC. However, the 1130Z fix was slightly late because the first fix location was further south than the forecasted position. We also dropped endpoint, midpoint and center dropsondes while at 5000 ft pressure altitude. A total of 19 dropsondes were released and transmitted (11 NWS, 8 HRD). We were also able to complete five TDR analyses and obtained coverage of most of the storm (Fig. 9)
Problems :
Takeoff was slightly delayed because of fueling and paperwork needs. Fixing the center at 5000 ft pressure altitude proved to be very challenging because the system was very tilted and there were weak and variable winds on the south side of the center. Although, with the aid of visible satellite imagery, NHC estimates, and navigator DR center estimates we were able to successfully fix the low level center.
The power supply for the C-band IWRAP was unable to be replaced before this flight and was therefore not operating. We also were unable to transmit TDR data to EMC because the HWRF ensembles would have run on Isaac instead of Florence.
Heather Holbach
Oct. 5, 2018

Timeseries wind, SFMR wind, rain rate, altitude and pressure plots |
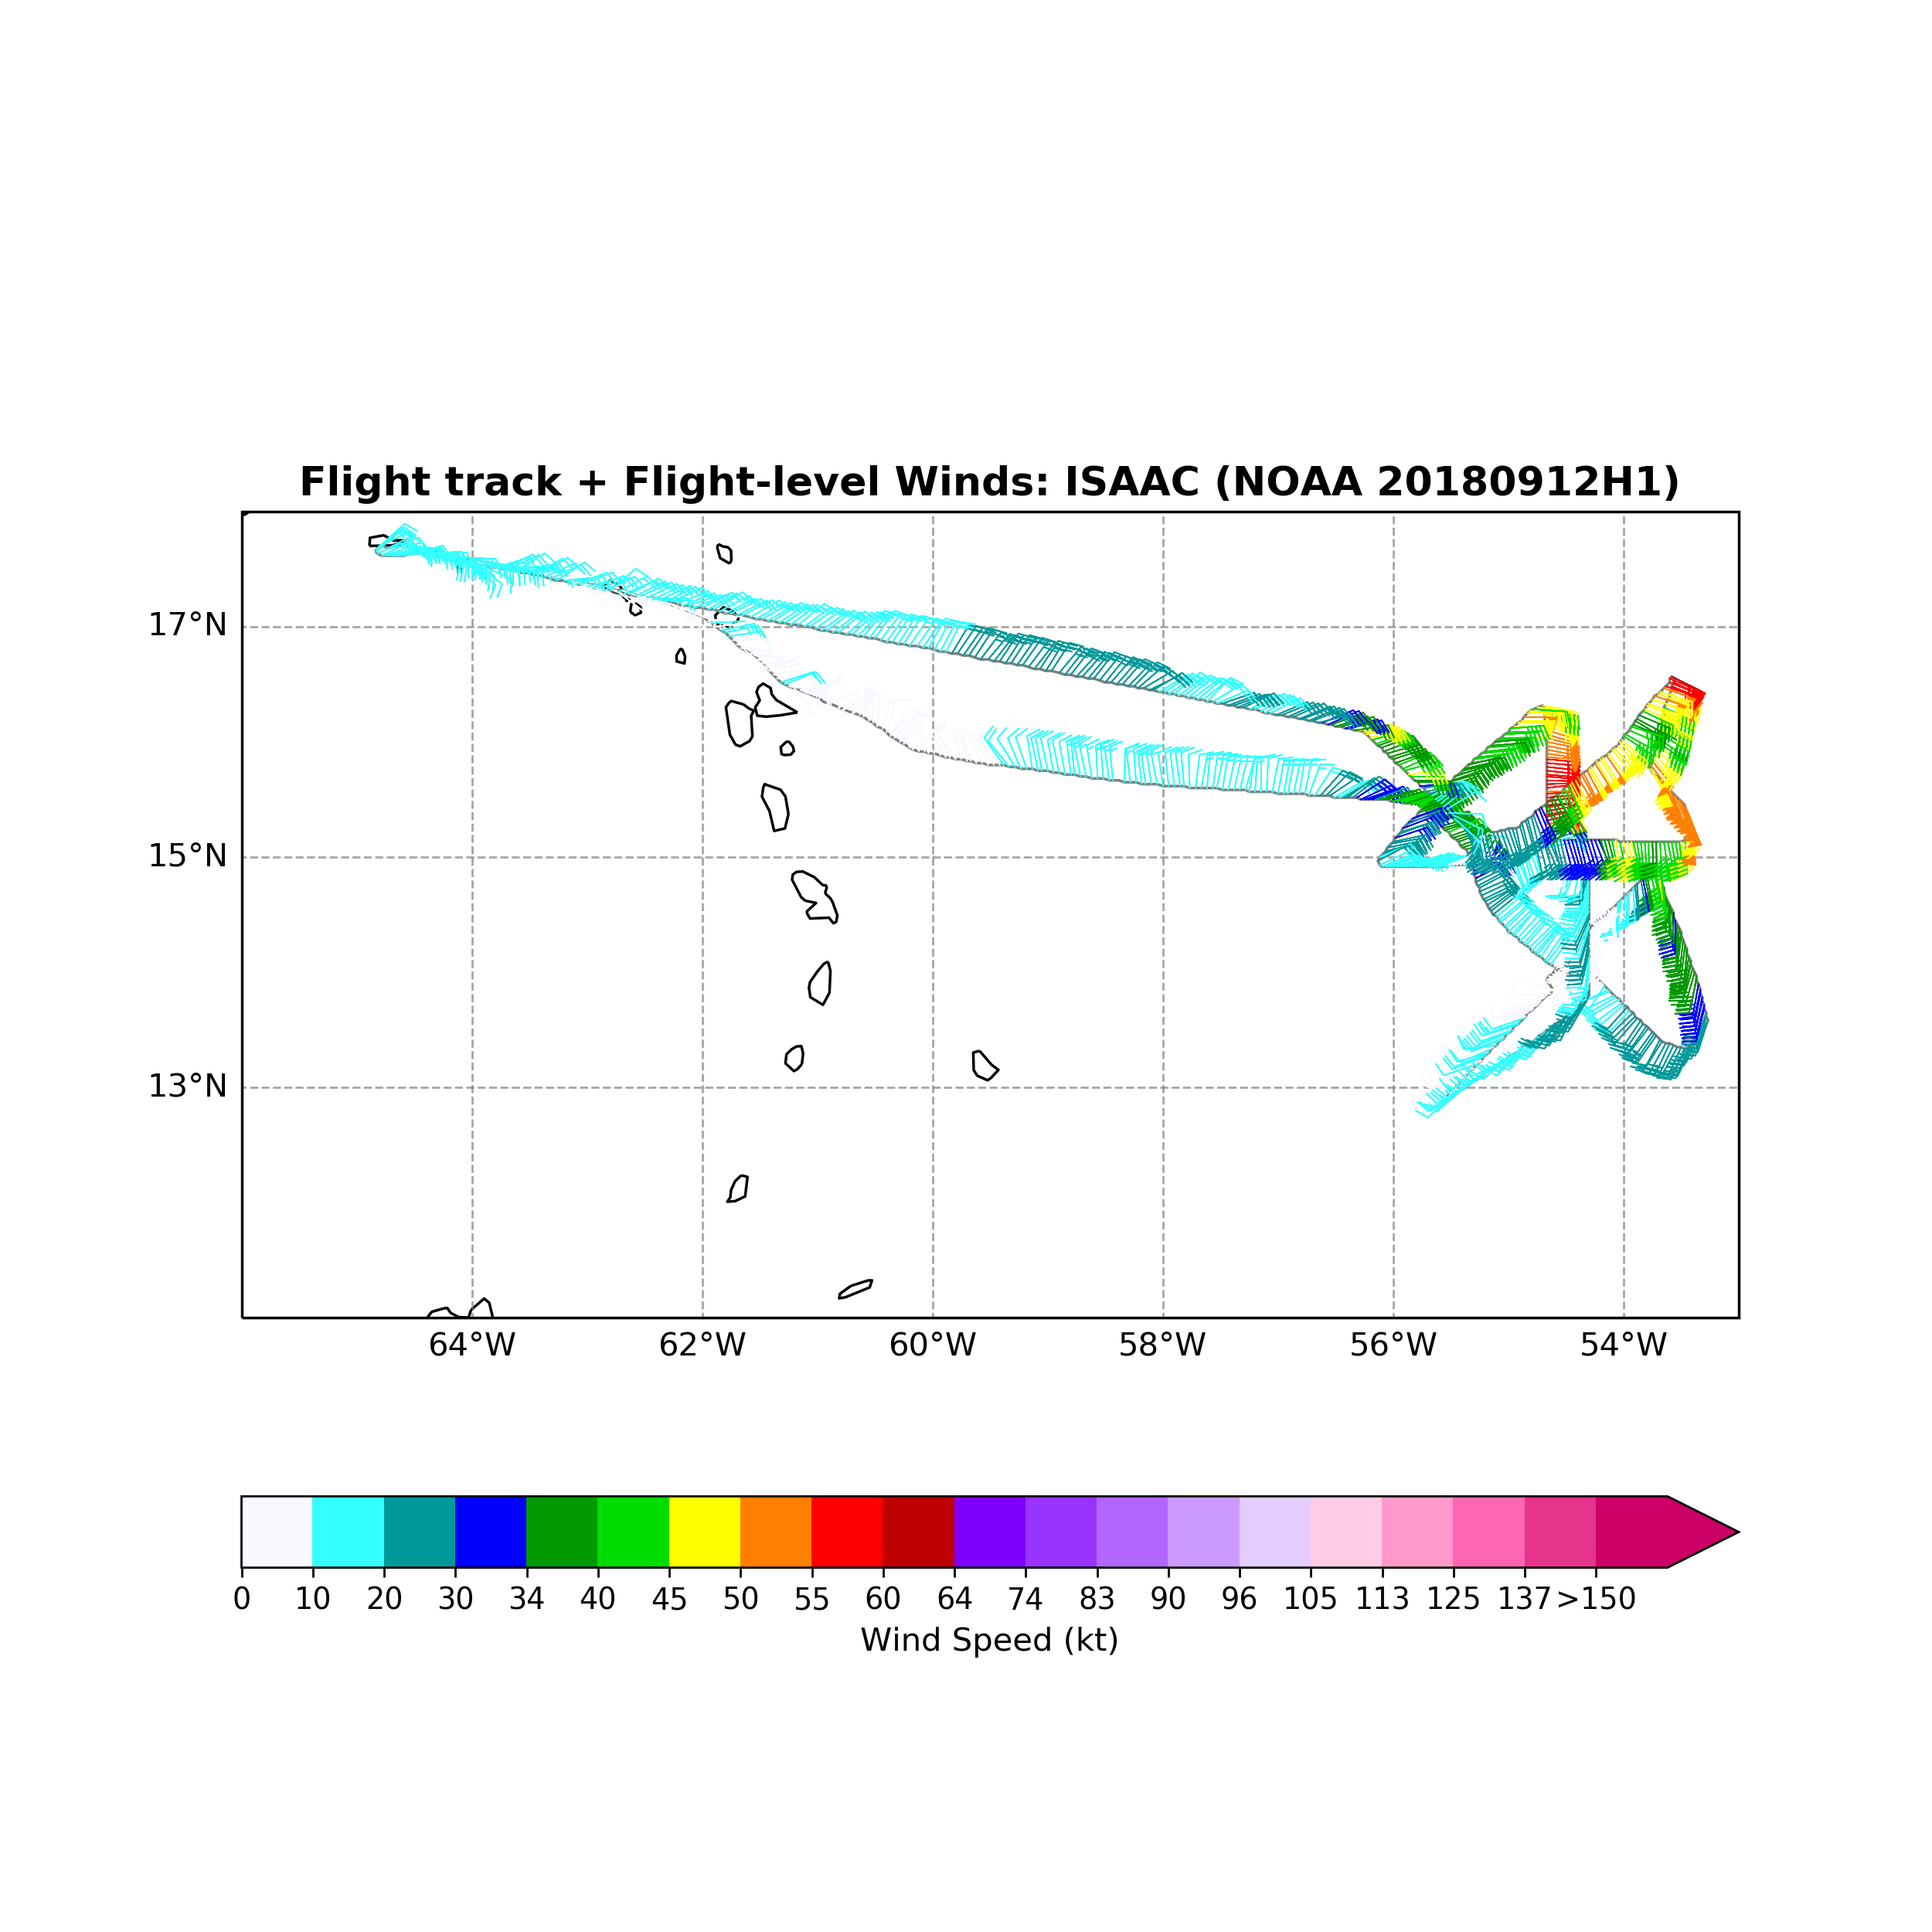
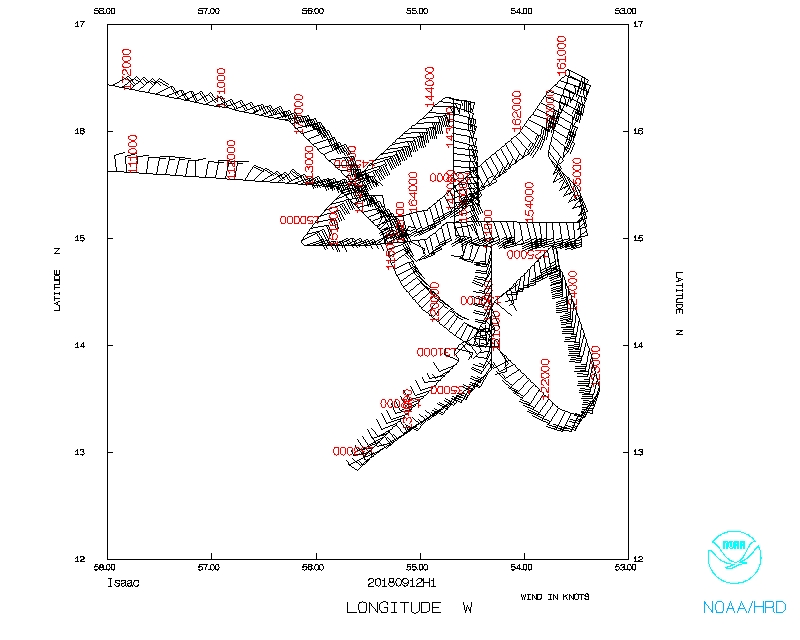
Flight-level wind plot |
 Flight track |
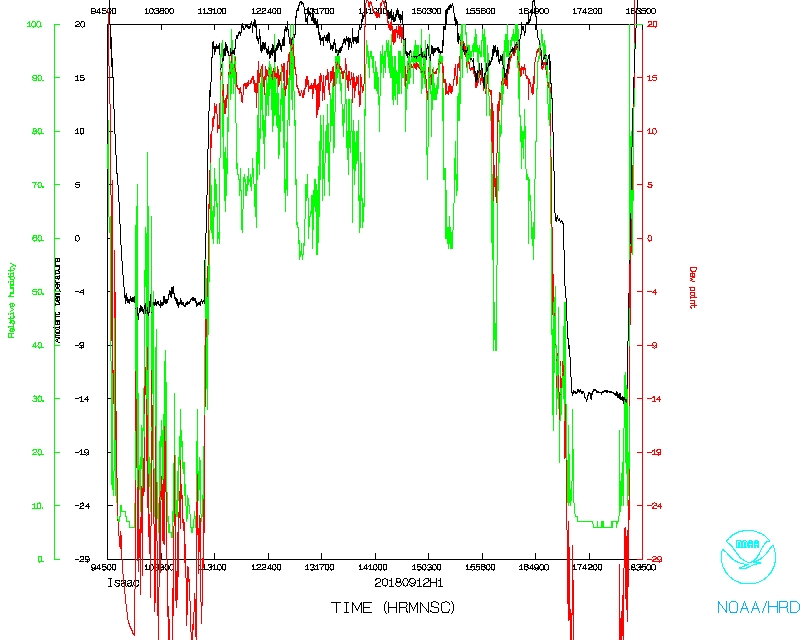 Temperature and Moisture |
 Wind and Atlitude |
 Flight track detail |
Flight Director's manifest |
NetCDF data |
serial data |
SFMR data |
1 second data
LPS log |
Radar log |
Drop log