Mission Summary
20120828H1 Aircraft 42RF
Tropical Storm Isaac TDR flight
Aircraft Crew (42RF)
| Aircraft Commander | Mark Nelson |
| Co-pilot | Mark Sweeny |
| Co-pilot | Chris Kerns |
| Navigator | Chris Slaon |
| Flight Engineer | Paul Darby |
| Flight Engineer | Ken Heystek |
| Flight Director | Ian Sears |
| Data Technician | Joe Bosko |
| Engineer | Charles Lynch |
| Engineer | Carlos Quiles |
| Electronics Technician | Bill Olney |
Scientific Crew (42RF)
| Lead Scientist | Frank Marks (HRD) |
| Dropsonde Scientist | Kathryn Sellwood(HRD) |
| AXBT Scientist | Benjamin Jaimes(RSMAS) |
| AXBT Scientist | Jodie Brewster(RSMAS) |
| AXBT Scientist | Ryan Schuster(RSMAS) |
Proposed track
|
Mission Plan :
NOAA42 will fly a tail Doppler radar (TDR) mission into Tropical Storm Isaac
to gather tail Doppler data.
http://www.aoml.noaa.gov/hrd/HFP2012/1_P3_TDR.pdf
NOAA42 will take off from Jacksonville International at 0800 UTC and will
recover at Jacksonville International by 1600 UTC the next day. The flight
plan (see figure below) called for a rotating Figure 4 pattern with 105 nm
legs at 8,000 ft with AXBT/dropsonde combos at the end, middle, and RMW on
each leg, and on the first and last penetration. Doppler analyses and quality
control would be done on the aircraft and for the first time we would have
someone on the ground (Mike Black) do dropsonde quality control. An array of
AXCP/CTDs will be deployed as part of the TC-Ocean interaction experiment.
http://www.aoml.noaa.gov/hrd/HFP2012/4_TC_Ocean_Interaction.pdf
Mission Summary :
| Take off
| Landing
| Jacksonville, FL | 07:46 UTC
| Jacksonville, FL | 16:04 UTC
| |
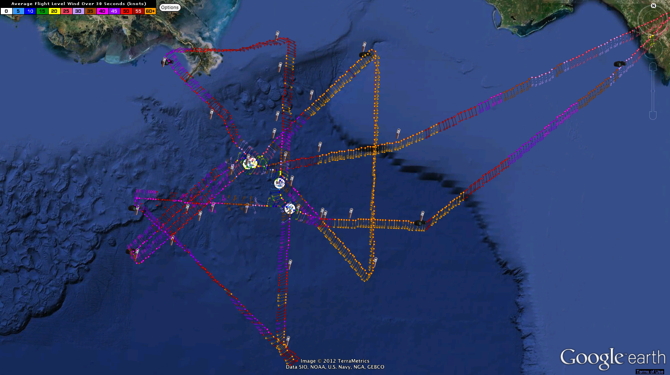
As Tropical Storm Isaac approached landfall in Louisiana near the Mississippi.
NOAA42 missions collected airborne Doppler radar data to use in initializing
and evaluating model guidance (see flight track below). It was clear from the
center drops that the central pressure was around 977 hPa and the SFMR
suggested peak surface winds between 60 and 64 kts.
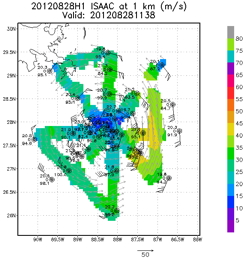
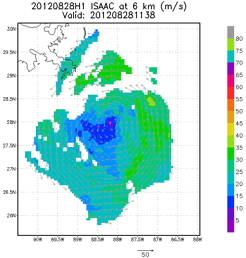
 Included here you see images of the horizontal winds within the inner core of
Tropical Storm Isaac sampled from the tail Doppler radar on the NOAA42 early
on 28 August 2012. These images are at three altitudes, 1 km, 3 km, and 6 km,
using a composite of winds from four legs oriented north-south, east-west,
southwest-northeast, and northwest-southeast. Also plotted on the 1-km altitude
analysis are the locations of dropsondes deployed (plotted using standard
station symbols). Isaac's circulation is much more organized than in the
previous mission, with a clear circulation center at all altitudes shown, but
still asymmetric with the strongest winds north and east of the circulation
center. This asymmetry increases with increasing altitude, and it is very
pronounced at altitudes >6 km. The strongest winds at 1 and 3-km altitude are
above hurricane force, however the surface winds from the SFMR and
dropwindsondes suggested the hurricane force winds were not reaching the
surface until very late in the mission. Hence, NHC did not name Isaac a
hurricane until right after the P-3 left the storm. The circulation center is
only slightly tilted from south to north with increasing altitude from 1-km
altitude to 6-km, much less so than the previous missions. However, the
increasing asymmetry with increasing altitude suggests that the southerly shear
Isaac is embedded in is still a factor in its slow development.
Included here you see images of the horizontal winds within the inner core of
Tropical Storm Isaac sampled from the tail Doppler radar on the NOAA42 early
on 28 August 2012. These images are at three altitudes, 1 km, 3 km, and 6 km,
using a composite of winds from four legs oriented north-south, east-west,
southwest-northeast, and northwest-southeast. Also plotted on the 1-km altitude
analysis are the locations of dropsondes deployed (plotted using standard
station symbols). Isaac's circulation is much more organized than in the
previous mission, with a clear circulation center at all altitudes shown, but
still asymmetric with the strongest winds north and east of the circulation
center. This asymmetry increases with increasing altitude, and it is very
pronounced at altitudes >6 km. The strongest winds at 1 and 3-km altitude are
above hurricane force, however the surface winds from the SFMR and
dropwindsondes suggested the hurricane force winds were not reaching the
surface until very late in the mission. Hence, NHC did not name Isaac a
hurricane until right after the P-3 left the storm. The circulation center is
only slightly tilted from south to north with increasing altitude from 1-km
altitude to 6-km, much less so than the previous missions. However, the
increasing asymmetry with increasing altitude suggests that the southerly shear
Isaac is embedded in is still a factor in its slow development.

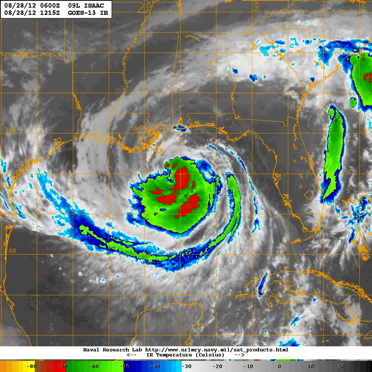
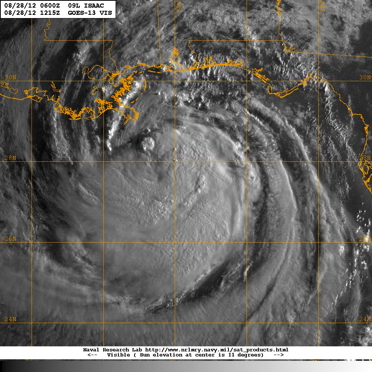
 Satellite imagery (below) depicted the cloud and precipitation structure during
the missions. The top left image show the IR brightness temperatures that show
a very asymmetric high cloud distribution with the coldest cloud tops (or the
central dense overcast) to the southeast of the circulation center and very
little cold cloud north of the center. There were cold clouds rotating around
to the north of the center. The top right image shows the visible cloud filed
with a few tall convective turrets in the rainbands north and west of the
center. Other than those turrets the vast majority of the high bright clouds
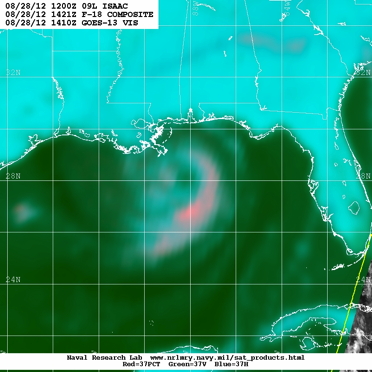
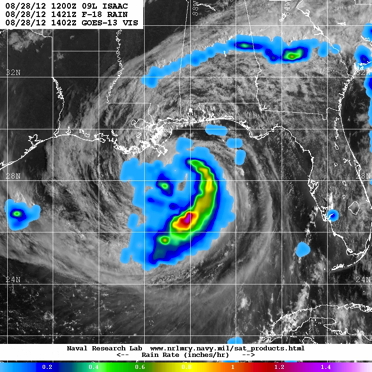
are to the south and east of the center. The bottom two images are showing the
condensed precipitation, where the lower left image is the 37-GHz color image
that shows the emission signal from rain in the blue-green colors and the
scattering emission signal from large ice in the pink colors. The lower right
image depicts estimates of rain. Both images suggest that the heaviest rain was
in the bands the north and west of the center, with strong ice scattering in
convective turrets embedded in the cold cloud shield southeast of the center.
The rain emission signal suggests bands are wrapping around the center, but
there is very little ice scattering on the northwest side.
Satellite imagery (below) depicted the cloud and precipitation structure during
the missions. The top left image show the IR brightness temperatures that show
a very asymmetric high cloud distribution with the coldest cloud tops (or the
central dense overcast) to the southeast of the circulation center and very
little cold cloud north of the center. There were cold clouds rotating around
to the north of the center. The top right image shows the visible cloud filed
with a few tall convective turrets in the rainbands north and west of the
center. Other than those turrets the vast majority of the high bright clouds
are to the south and east of the center. The bottom two images are showing the
condensed precipitation, where the lower left image is the 37-GHz color image
that shows the emission signal from rain in the blue-green colors and the
scattering emission signal from large ice in the pink colors. The lower right
image depicts estimates of rain. Both images suggest that the heaviest rain was
in the bands the north and west of the center, with strong ice scattering in
convective turrets embedded in the cold cloud shield southeast of the center.
The rain emission signal suggests bands are wrapping around the center, but
there is very little ice scattering on the northwest side.
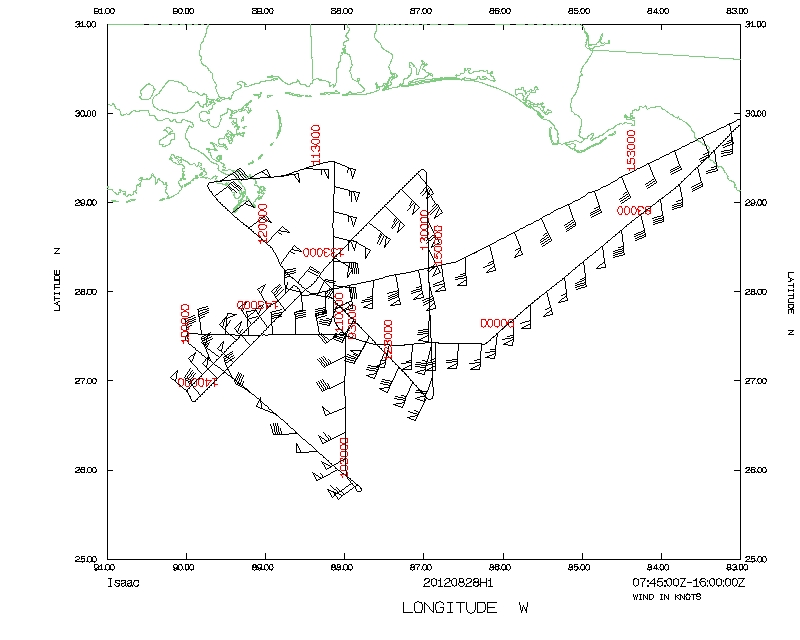
 33 GPS dropsondes were deployed, processed and transmitted during the mission.
The figure below depicts the synoptic map of the surface observations from the
dropsondes.
33 GPS dropsondes were deployed, processed and transmitted during the mission.
The figure below depicts the synoptic map of the surface observations from the
dropsondes.

Evaluation :
This was a very successful mission that met all objectives without any major
issues. 5 radar analyses, sets of superobs and radial files were completed and
transmitted to the ground. The dropsonde quality control from the ground worked
wonderfully. M. Black was able to receive all the dropsondes, quality control
them, notify us when they were completed, and we were able to grab them from
the AOML ftp site and transmit them from NOAA42. The upper-ocean in-storm
pattern was also very successfully executed with >85% of the ocean probes
working. The largest failures were in the AXCPs (50%).
The tail radar transceiver was swapped out for this mission with the
spare.
Problems :
We had a few radar system glitches when the power cycled once during the
mission. No significant amount of radar data was lost during the power
glitches. The tail antenna was stuck in the forward position for about 4
minutes on our inbound leg from the northeast (1320-1324 UTC). The WSRA was
not working during the flight and no WSRA data was collected. There were some
issues with the HDOB wind directions transmitted on our east-west leg
suggesting that there may be a bug in AAMPS causing an 180° ambiguity
in the wind direction between north and south.
Expendables used in mission:
GPS sondes : 33
AXBTs : 20 (18 good)
AXCTDs: 11 launched (10 good)
AXCPs: 8 launched (5 good)
Sonobuoys: 39 total (33 good)
Frank D. Marks
Sept. 18, 2012
Mission Data :
Flight Director log |
LPS log |
LPS digital Log |
Radar log |
Drop log
Serial data |
1 second data |
NetCDF file |
Raw Fast data (NetCDF) |
SFMR data (NetCDF)
Page last updated Feb. 20, 2013
Return to Mission page.