Mission Summary
20120823H2 Aircraft 42RF
Tropical Storm Isaac TDR flight
Aircraft Crew (42RF)
| Aircraft Commander | Harris Halverson |
| Co-pilot | Cathy Martin |
| Co-pilot | Justin Kibbey |
| Navigator | Peter Siegel |
| Flight Engineer | Joe Klippel |
| Flight Director | Jess Williams |
| Data Technician | Terry Lynch |
| AVAPS | Jeff Newnam |
| Electronics Technician | Todd Richards |
| Electronics Technician | Bobby Peek |
Scientific Crew (42RF)
| Lead Scientist | Rob Rogers (HRD) |
| Radar Scientist | John Gamache(HRD) |
| Dropsonde Scientist | Tomislava Vukicevic(HRD) |
Figure 1. Proposed track for 20120823H2.
|
Mission Plan :
NOAA 42RF will fly the third TDR mission into TS Isaac. Original plan called
for a butterfly pattern with the IP on the southeast side (Fig. 1), but we had
a fix responsibility for 00 UTC for NHC, and we were advised not to try the
fix on the southwest-northeast leg. So we modified the pattern to set up the
IP on the southwest side at 210 azimuth, second pass is northwest-southeast
beginning at 330 azimuth, the third pass is east-west, then turn 180 degrees
and do fourth and final pass. Fly at 10,000 ft, except for the second pass,
when we will descend to 5000 ft for a fix responsibility at 00 UTC for NHC.
Dropsondes were launched at turn points, mid points, RMW points, and on first
and last pass.
(a)
|
(b)
|
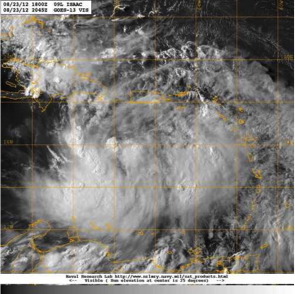
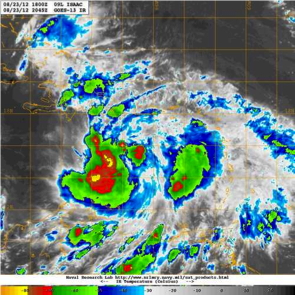
Figure 2. (a) GOES-East 1-km visible image valid 2045 UTC 23 August
(b) GOES-East infrared image valid 2045 UTC 23 August.
|
Mission Summary :
| Take off
| Landing
| Barbados | 20:02 UTC
| Barbados | 04:03 UTC
| |
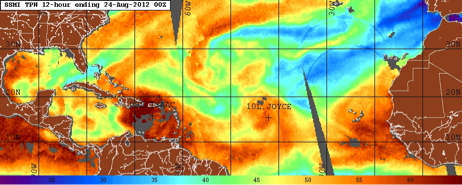
Isaac still appears disorganized on satellite imagery, with peak winds from
NHC reduced to 35 kt. Some areas of deep convection are apparent in the
southwest of the storm (Fig. 2), but the core remains disorganized. It is
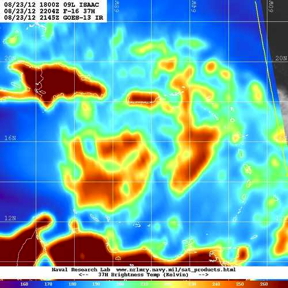
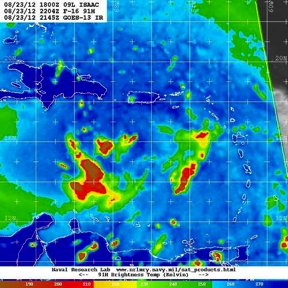
difficult to detect any evidence of circulation in the microwave imagery (Fig.
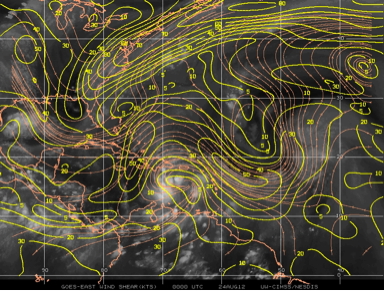
3). Dry air in the environment remains a factor, and high shear surrounds the
circulation envelope on the northwest and northeast of the storm, even if shear
right over the center remains low (Fig. 4).
(a)
|
(b)
|
Figure 3. (a) F-16 37GHz image valid 2004 UTC 23 August
(b) F-16 85GHz image valid 2004 UTC 23 August.
|
(a)
|
(b)
|
Figure 4. (a) SSM/I Total precipitable water (shaded, mm) valid 0000 UTC 24
August
(b) CIMMS-derived 850-200hPa vertical shear magnitude (contour, kt) and
streamline and infrared image valid 0000 UTC 24 August.
|
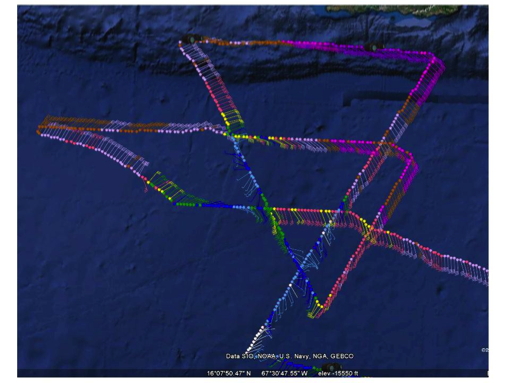
Takeoff was at 2002 UTC from Barbados. The pattern was flown generally as
planned, but there was one modification on the final west-east pass where the
aircraft turned southeast before reaching the center to attempt to actually
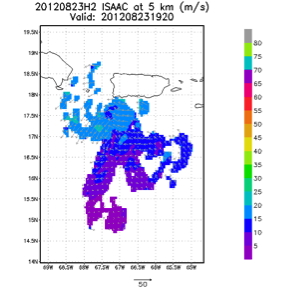
capture a circulation center at flight level (Fig. 5). The storm remained
disorganized during the flight, though by the last two passes the circulation
center did appear to be a bit more vertically coherent and extended over a
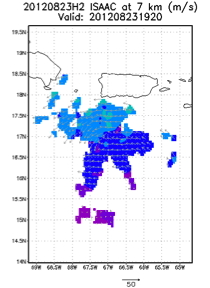
deeper layer. This is particularly evident in the composite radar analyses
(Fig. 6), which showed at least more curvature in the wind field at 5 and 7 km
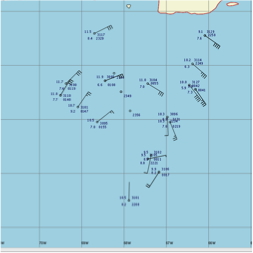
compared with the analysis from the previous 20 UTC flight. The dropsonde
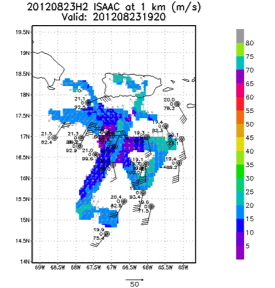
analysis (Fig. 7) suggested that there was a circulation at the surface that
was displaced to the north and west of a possible circulation center at 700
hPa. During the third pass we encountered vigorous convection to the south
of the flight track, with frequent lightning.
|
|
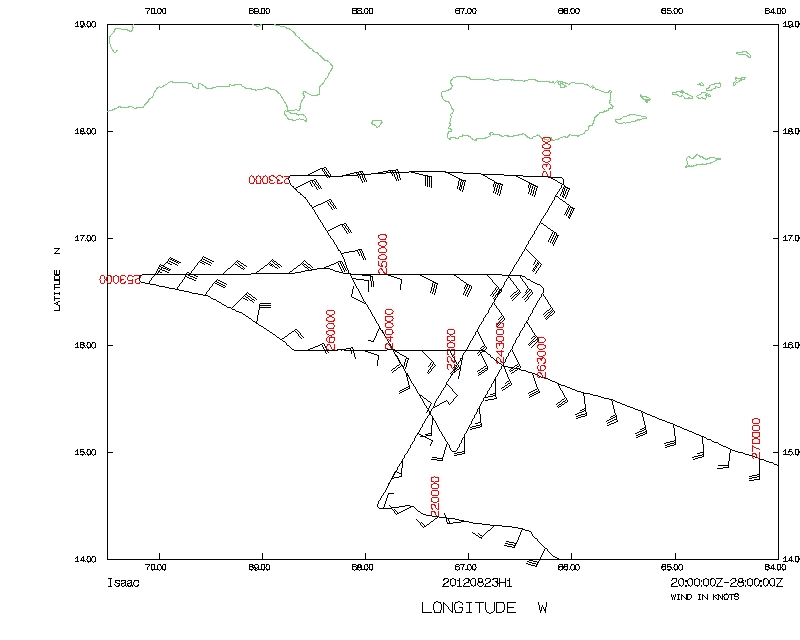
Figure 5. Actual flight track for 20120823H2. Barbs (kt) shon for flight-level
winds.
|
The aircraft completed its mission and landed at Barbados at 0403 UTC.
Mission Evaluation:
The mission did meet its primary objectives. There was good radar and
dropsonde coverage, and the radar analysis worked better and was able to
transmit data to EMC. We perhaps sampled a disorganized tropical storm that
got itself better organized.
(a)
|
(b)
|
(c)
|
(d)
|
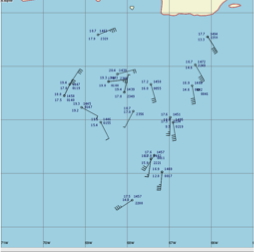
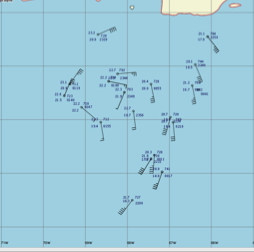
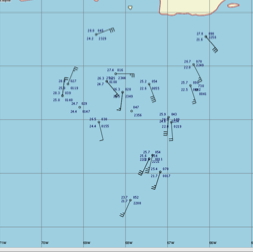
Figure 6. Dropsondes released during 20120823H2. Barbs show wind in knots.
(a) 700 hPa; (b) 850 hPa; (c) 925 hPa; (d)surface.
|
Problems :
There were no major problems. Only one dropsonde had a problem, but that
sonde was backed up by another. A total of 22 sondes were released.
(a)
|
(b)
|
(c)
|
(d)
|
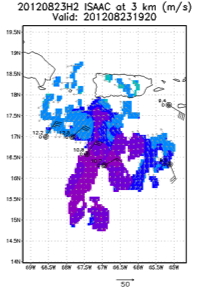
Figure 7. Doppler-derived wind speed (shaded, m/s) and vectors (m/s) at
(a) 7 km; (b) 5 km; (c) 3 km; (d) 1 km. Dropsonde measurements at same level
are also indicated.
|
Mission Data :
Flight Director log |
Flight Director's manifest |
LPS log |
Radar log |
Drop log
serial data |
1 sec data |
NetCDF file |
SFMR data
Page last updated February 20, 2013
Return to Mission page.