Mission Summary
20120822H1 Aircraft 42RF
Tropical Storm Isaac TDR flight
Aircraft Crew (42RF)
| Aircraft Commander | Harris Halverson |
| Co-pilot | Cathy Martin |
| Co-pilot | Justin Kibbey |
| Navigator | Peter Siegel |
| Flight Engineer | Joe Klippel |
| Flight Engineer | Lonnie Kregelka |
| Flight Director | Paul Flaherty |
| Flight Director | Jess Williams |
| Data Technician | Terry Lynch |
| AVAPS | Jeff Newnam |
| Electronics Technician | Todd Richards |
| Electronics Technician | Bobby Peek |
Scientific Crew (42RF)
| Lead Scientist | Rob Rogers (HRD) |
| Radar Scientist | John Gamache(HRD) |
| Dropsonde Scientist | Tomislava Vukicevic(HRD) |
Figure 1. Proposed track for 20120822H1
|
Mission Plan :
NOAA 42RF will fly an EMC-tasked Tail Doppler Radar (TDR) mission into TS
Isaac, which is moving over the windward islands north of Barbados. This is
the first P-3 mission into the system. Fly a rotating figure-4 (Fig. 1), with
105 nm leg length, with the initial point on the south side of the storm. Upon
completion of the fourth pass, set up for a second west-east pass, and exit the
storm on the east side. Drop sondes at turn points, mid points, RMW, and on
first and last passes. Fly at 10,000 ft on the first pass over the islands,
then descend to 8000 ft for the remainder of the mission to optimize scanning
radar altimeter (SRA) measurements. No AXBT's will be dropped.
Mission Summary :
| Take off
| Landing
| Barbados | 20:16 UTC
| Barbados | 03:57
UTC
| |
(a)
|
(b)
|
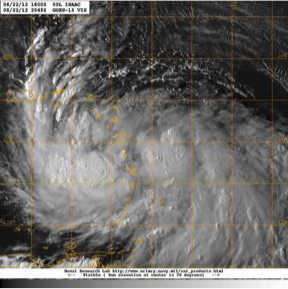
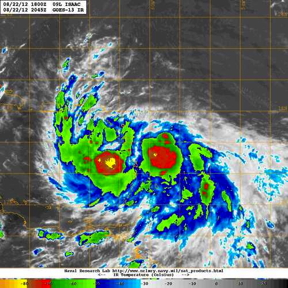
Figure 2. (a) GOES-East 1-km visible image valid 2045 UTC 22 August
(b) GOES-East infrared image valid 2045 UTC 22 August.
|
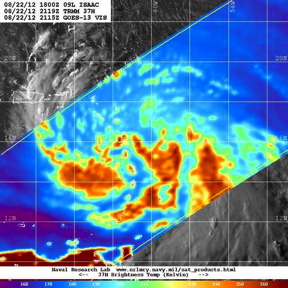
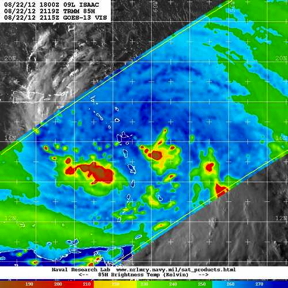
Isaac appears disorganized on satellite imagery, with peak winds from NHC at
40 kt. There are some areas of deep convection on the southwest and east sides
of the center (Figs. 2-3), but the core does not appear to be organizing at
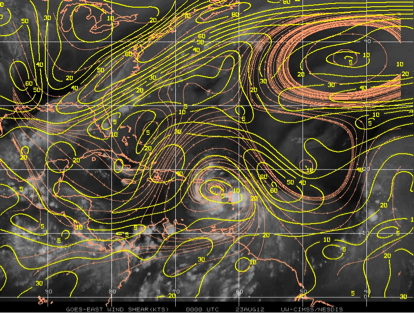
this time. It does appear to be encountering some shear around the periphery
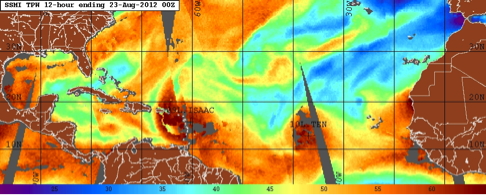
and some dry air is evident on the north side (Fig. 4). There appear to be
abundant scatterers near the center and south of the center, but limited
coverage on the north side.
(a)
|
(b)
|
Figure 3. (a) TRMM 37GHz image valid 2119 UTC 22 August
(b) TRMM 85GHz image valid 2119 UTC 22 August.
|
(a)
|
(b)
|
Figure 4. (a) SSM/I Total precipitable water (shaded, mm) valid 0000 UTC 23
August
(b) CIMMS-derived 850-200hPa vertical shear magnitude (contour, kt) and
streamline and infrared image valid 0000 UTC 23 August.
|
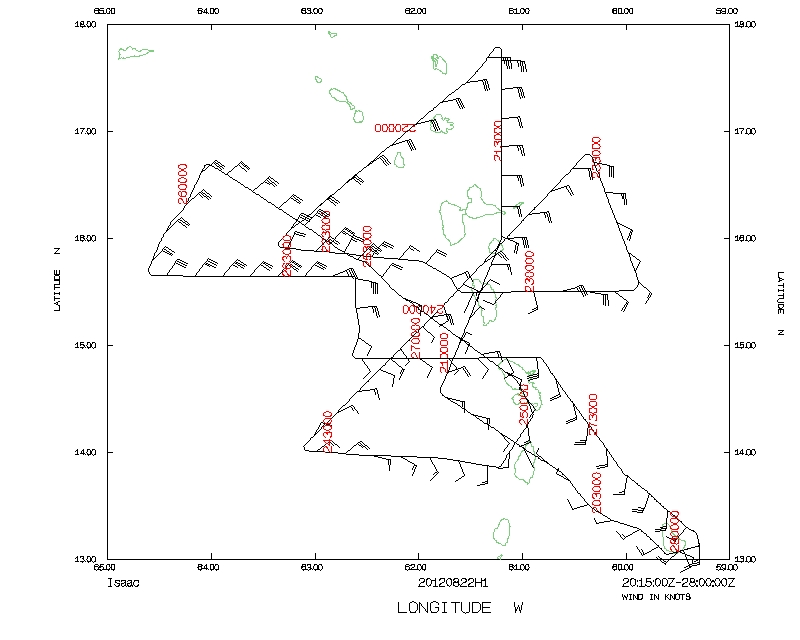
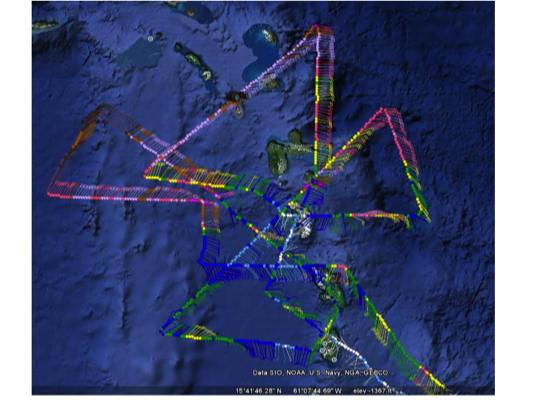
Takeoff was at 2016 UTC from Barbados. The pattern was flown generally as
planned, but there were frequent modifications because of the difficulty in
finding the center (Fig. 5). This modification was particularly evident on
the final west-east pass, where the aircraft deviated to the south prior to
reaching its center because of the suspicion that the center at flight-level
was significantly displaced to the south. The SRA was not working so the
aircraft climbed to 10,000 ft for most of the pattern.
|
|
Figure 5. Actual flight track for 20120822H1. Barbs (kt) shon for flight-level
winds.
|
There were many challenges on this flight. The Doppler analyses are suspect,
but we are not sure if that is related to the use of old quality-control
parameters being used in the new radar data system (i.e., RVP-8), a lack of
scatterers, a weak, disorganized system, or some combination of factors. The
transmission scripts to EMC also had problems during the flight. Attempts were
made to manually ftp the data. The dropsondes worked fine, but we had to
manually transmit the tempdrop messages. The SRA did not work.
(a)
|
(b)
|
(c)
|
(d)
|
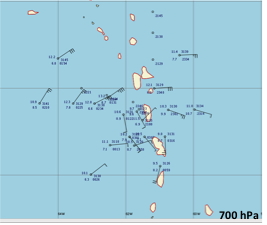
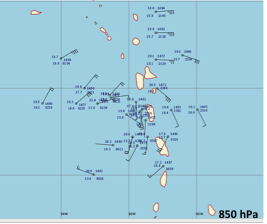
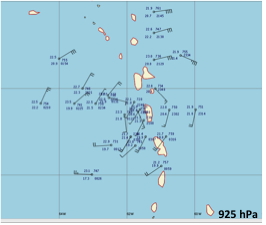
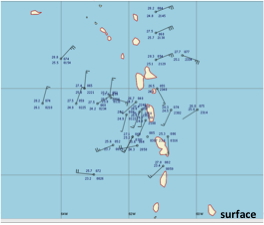
Figure 6. Dropsondes released during 20120822H1. Barbs show wind in knots.
(a) 700 hPa; (b) 850 hPa; (c) 925 hPa; (d)surface.
|
Adding to these challenges, as mentioned above, was that this was a very
disorganized storm. Dropsondes clearly showed a cyclonic circulation, but it
was not at all clear that it was a closed circulation, especially at 700 hPa
(note these dropsondes are plotted earth-relative, not storm-relative). Some
of the difficulty of seeing a closed circulation at 700 hPa may have been
related to the presence of a strong easterly jet at that altitude, particularly
north of the storm, as winds as strong as 30 kt were evident at the most
northwestern point. Dewpoint depressions as large as 5-6 K were also evident
at 700 hPa, especially on the west and southwest side of the storm. It is not
known at this time whether this is consistent with the total precipitable water
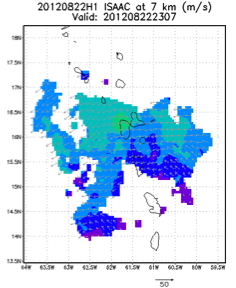
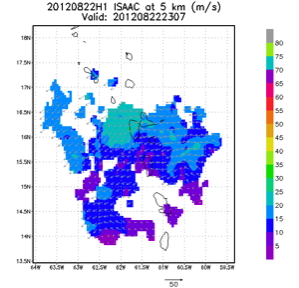
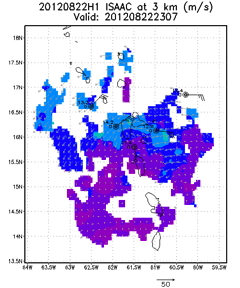
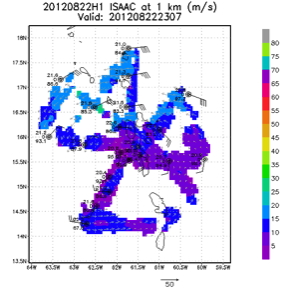
plot shown in Fig. 4a. While the winds are suspect, an examination of the
Doppler-derived fields from 1-7 km altitude (Fig. 7) shows a closed circulation
at 1 km altitude (as confirmed by coincident dropsondes) and primarily strong
easterlies at higher altitudes. Easterly winds as strong as 20-25 m/s were
seen on the north side of the storm at 7 km altitude. Even with this
disorganization, there were some areas of deep convection and lightning,
especially on the east side of the storm. It remains to be seen if the storm
will become better organized.
The aircraft completed its mission and landed at Barbados at 0357 UTC.
(a)
|
(b)
|
(c)
|
(d)
|
Figure 7. Doppler-derived wind speed (shaded, m/s) and vectors (m/s) at
(a) 7 km; (b) 5 km; (c) 3 km; (d) 1 km. Dropsonde measurements at same level
are also indicated.
|
Mission Evaluation:
The primary objectives of the mission were accomplished, though there were
problems with the transmission of the radar analyses and tempdrop messages,
which had to be manually transmitted.
Problems :
The primary problems with this flight were the suspect Doppler analyses,
difficulty transmitting radar analyses and dropsonde tempdrop message, and the
SRA not working. Despite these problems, data was collected that will be
useful for future research.
Mission Data :
Flight Director log |
LPS log |
Radar log |
Drop log
serial data |
1 sec data |
NetCDF file |
raw Fast data |
SFMR data
Page last updated February 20, 2013
Return to Mission page.