|
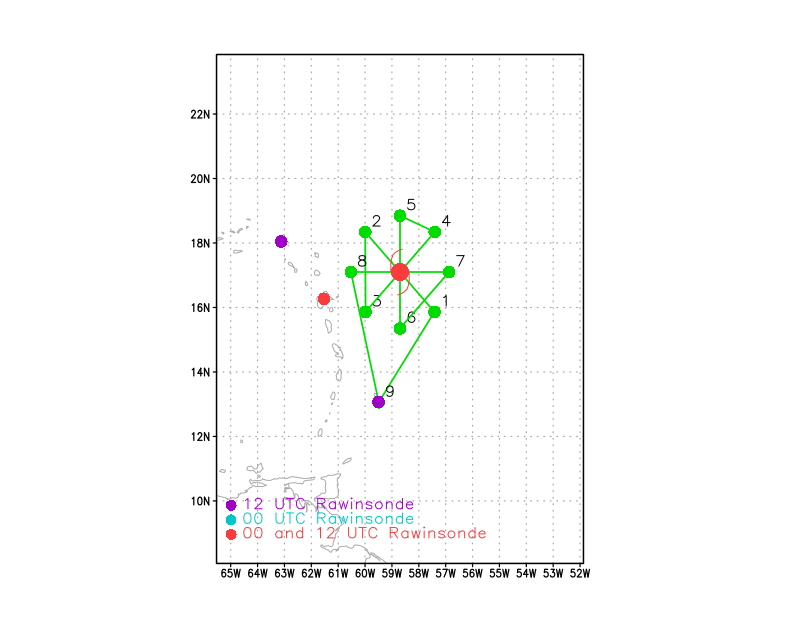
| Figure 1. Proposed flight track for mission 20170905H2 |
| Aircraft Commander | Scott Price |
| Co-pilot | Rees |
| Co-pilot | Mitchell |
| Flight Engineer | Paul Darby |
| Flight Engineer | Todd Tuffnel |
| Navigator | Urato |
| Navigator | Sloan |
| Flight Director | Jack Parrish |
| Flight Director | Brian Belson |
| System Engineer | James Warnecke |
| Data Technician | Mike Mascaro |
| Dropsonde Operator | McAlister |
| Lead Project Scientist | Jon Zawislak | HRD |
| Radar Scientist | Jun Zhang | HRD |
| Radar Scientist | Paul Reasor | HRD |
Mission Plan :
|
|
| Figure 1. Proposed flight track for mission 20170905H2 |
NOAA 42 will fly a rotated Figure-4 at 10 kft pressure altitude (altitude may vary due to de-confliction with Teal) with 105 nmi radial legs (Figure 1). 8 dropsonde (12 total for entire pattern) will be launched at each turn point in the pattern, as well as on each center pass (4, NHC). We'll also be launching 2 maximum wind sondes during the mission, likely on the first pass. Additional modification is possible between legs 3 and 4 to align with a CYGNSS pass, which will require a dropsonde in the maximum wind, as well. The final leg outbound to the west may have to be truncated or rotated to avoid overland flight. No AXBTs were requested for this mission. SHIPS shear, as of the 1200 UTC analysis is 351° / 12 kt. The NHC advisory at 2 pm EDT / 1800 UTC: Motion, 270 / 12 kt; Intensity, 160 kt (gust 190 kt), 926 mb; Position, 16.9°N / 59.1°W. From the official 1500 UTC NHC forecast, the forecast position at 6/0000 UTC is 17.2°N / 60.3°W with 155 kt (Gust 190 kt). The last Teal fix at 1638 Z was at 16.88°N / 59.88°W, with an extrapolated MSLP of 926 mb, and 160 kt.
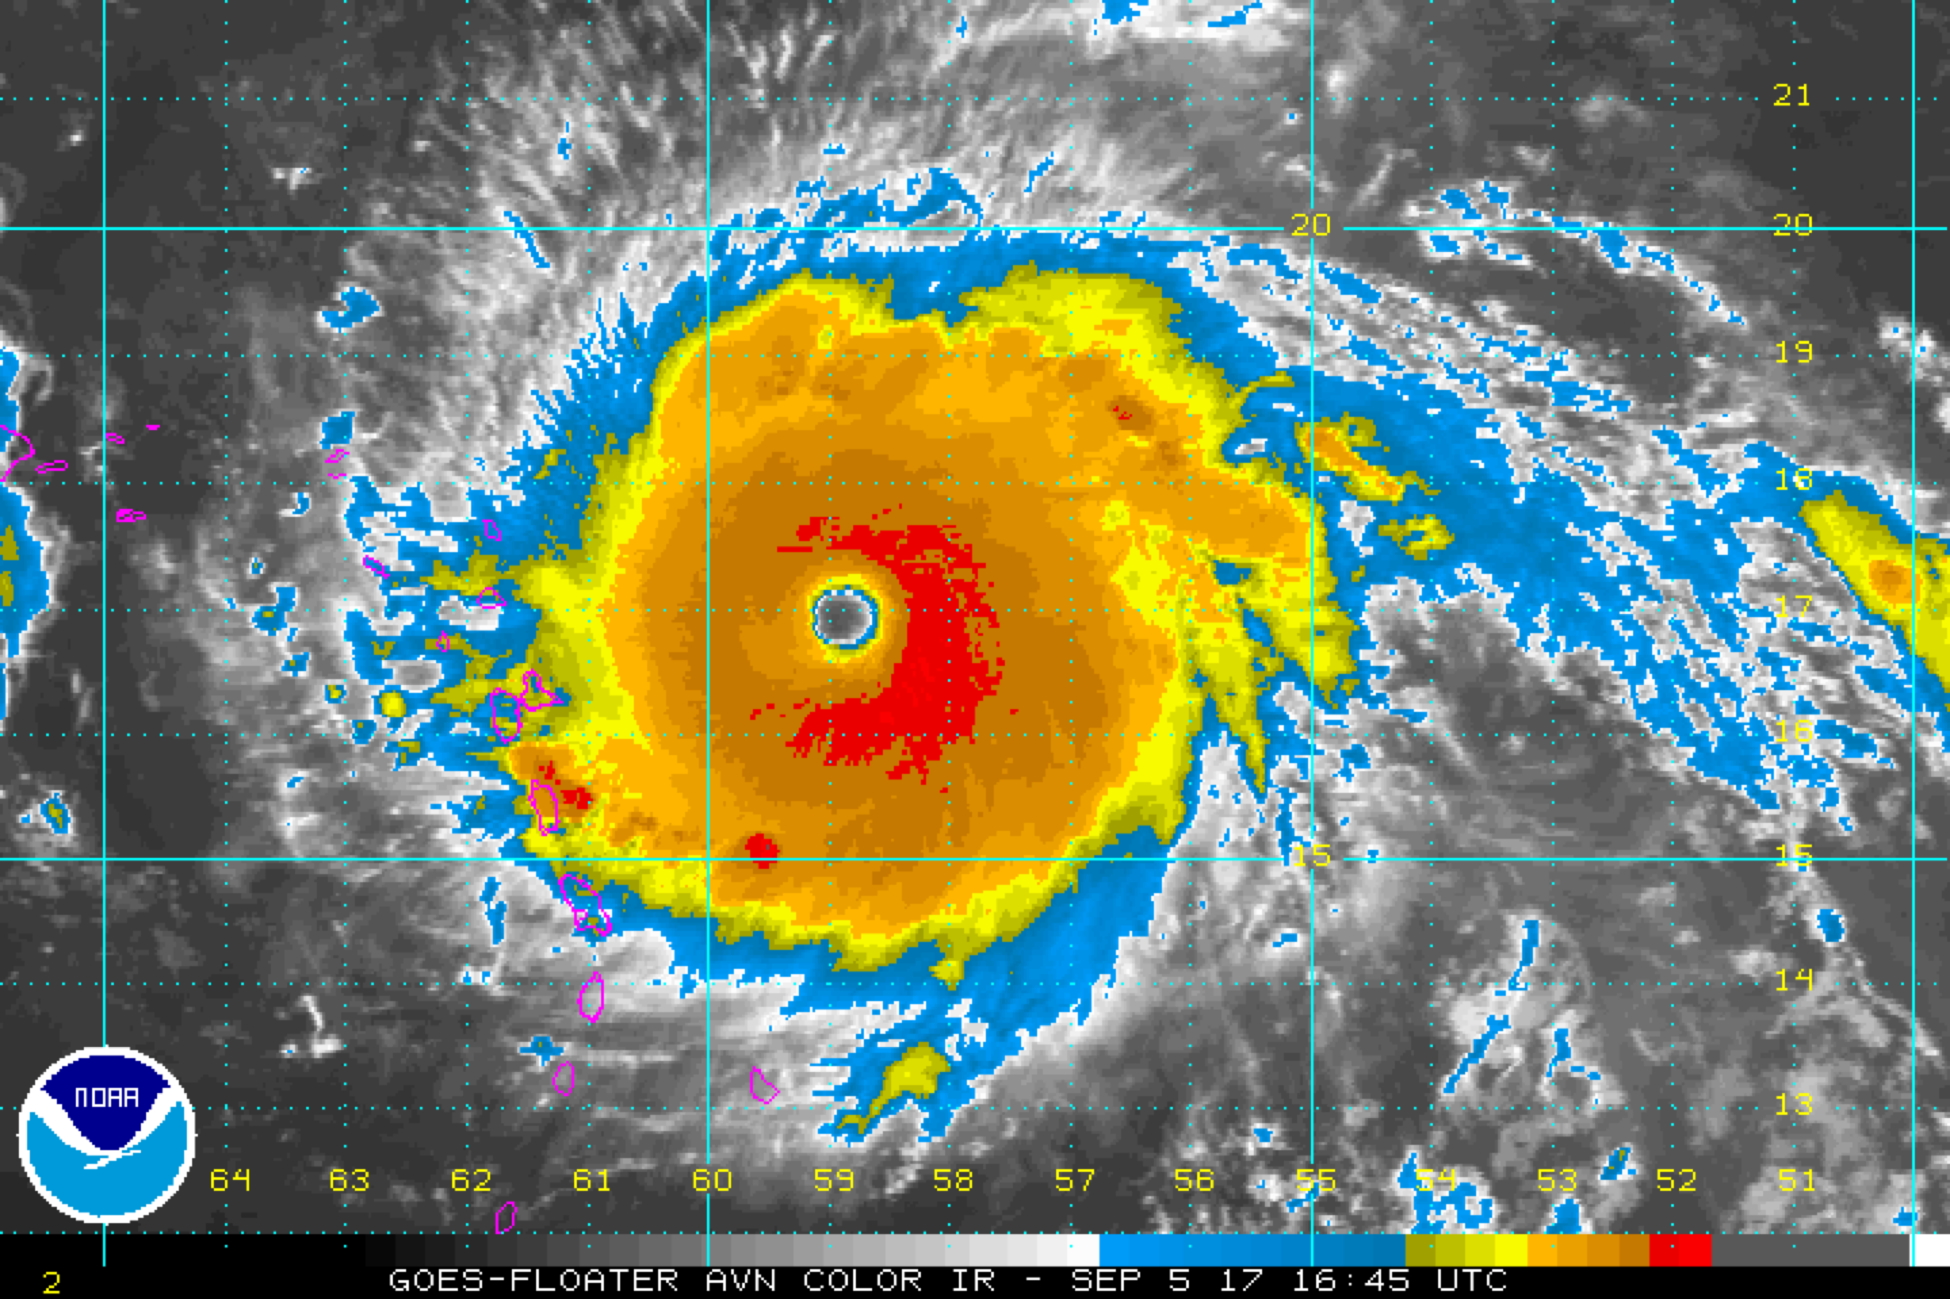
Figure 2. GOES-13 IR imagery of Irma from 1645 UTC 5 September |

Figure 3. GOES-13 visible imagery of Irma from 1645 UTC 5 September |
Data from the previous flight (170905H1) indicated that Irma had intensified to 150 kt (SFMR winds reported even higher gusts), and has since further intensified to 160 kt. It appears that Irma experienced yet another RI event as Irma had intensified about 10 kt during our previous flight (170904H2), and continued to intensify through the morning mission. The intensity at the beginning of 170904H2 (4/2100 UTC) was 115 kt, while the intensity at 1200 UTC during 20170905H1 was 150 kt. Satellite imagery (Figs. 2 and 3) indicates as we

|
|
Figure 4. IR imagery and CIMSS-derived deep-layer (850-200-hPa) vertical wind shear (contoured; contours colored by favorability for intensification, with green being "favorable", yellow being "neutral", and red being "unfavorable"), valid at 1500 UTC 5 September (images courtesy CIMSS, tropic.ssec.wisc.edu). |
head out to the storm, the CDO is very symmetric with a very clear, pronounced eye. The environment (e.g., deep-layer vertical wind shear, Fig. 4) remains very favorable for maintenance, or even a little more intensification. The official NHC forecast (Fig. 5), consistent with most of the model guidance, is to have Irma begin to move northwestward during the mission, and continue on that track north of the Puerto Rico and Hispaniola. Models, as well as the official forecast, indicate that Irma will remain at least Category 4 intensity over the next 72 hours (Fig. 6), dependent on additional ERCs.
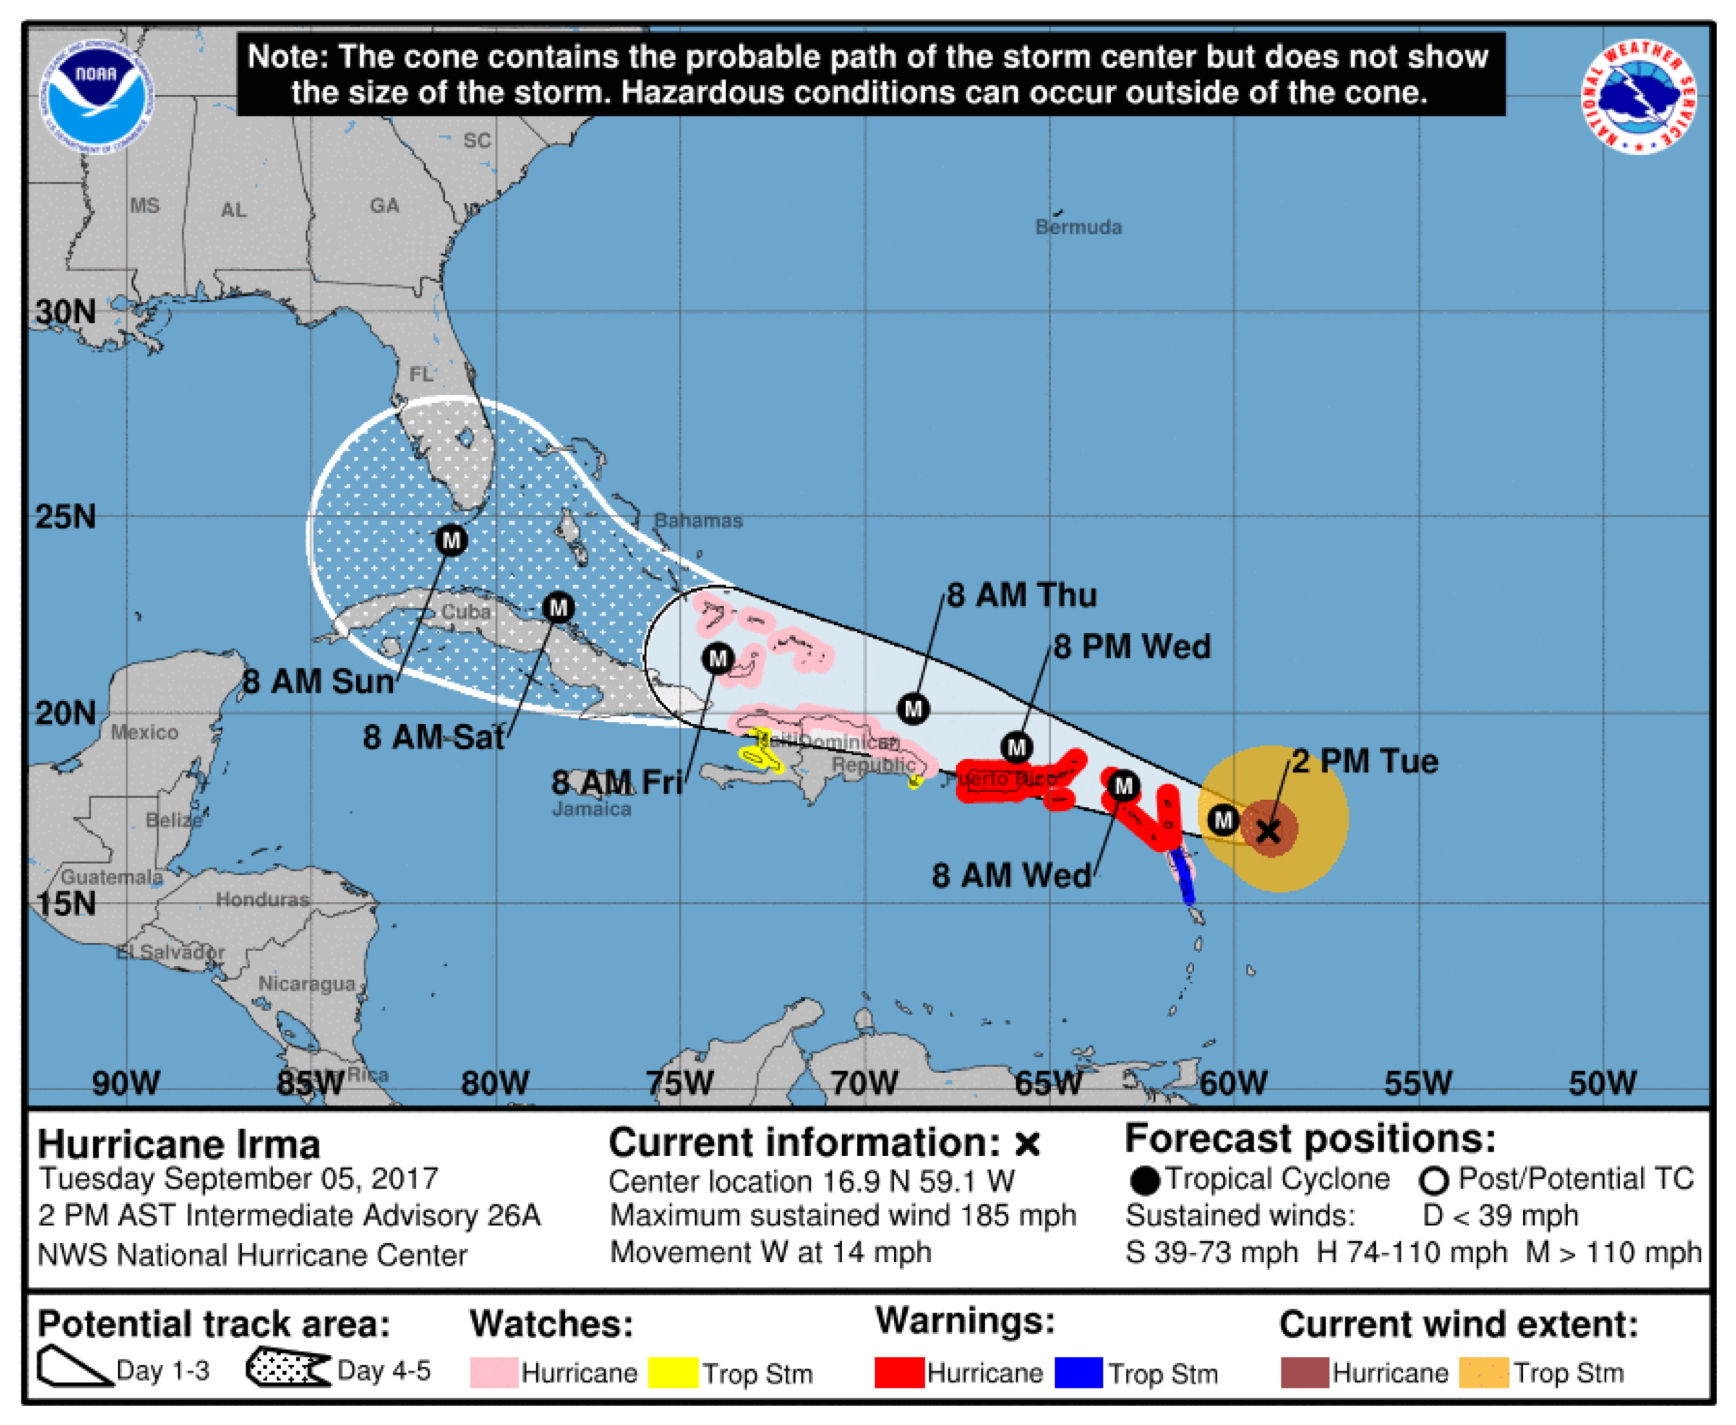
Figure 5. Official NHC forecast at 2 pm EDT (1800 UTC) 5 September |
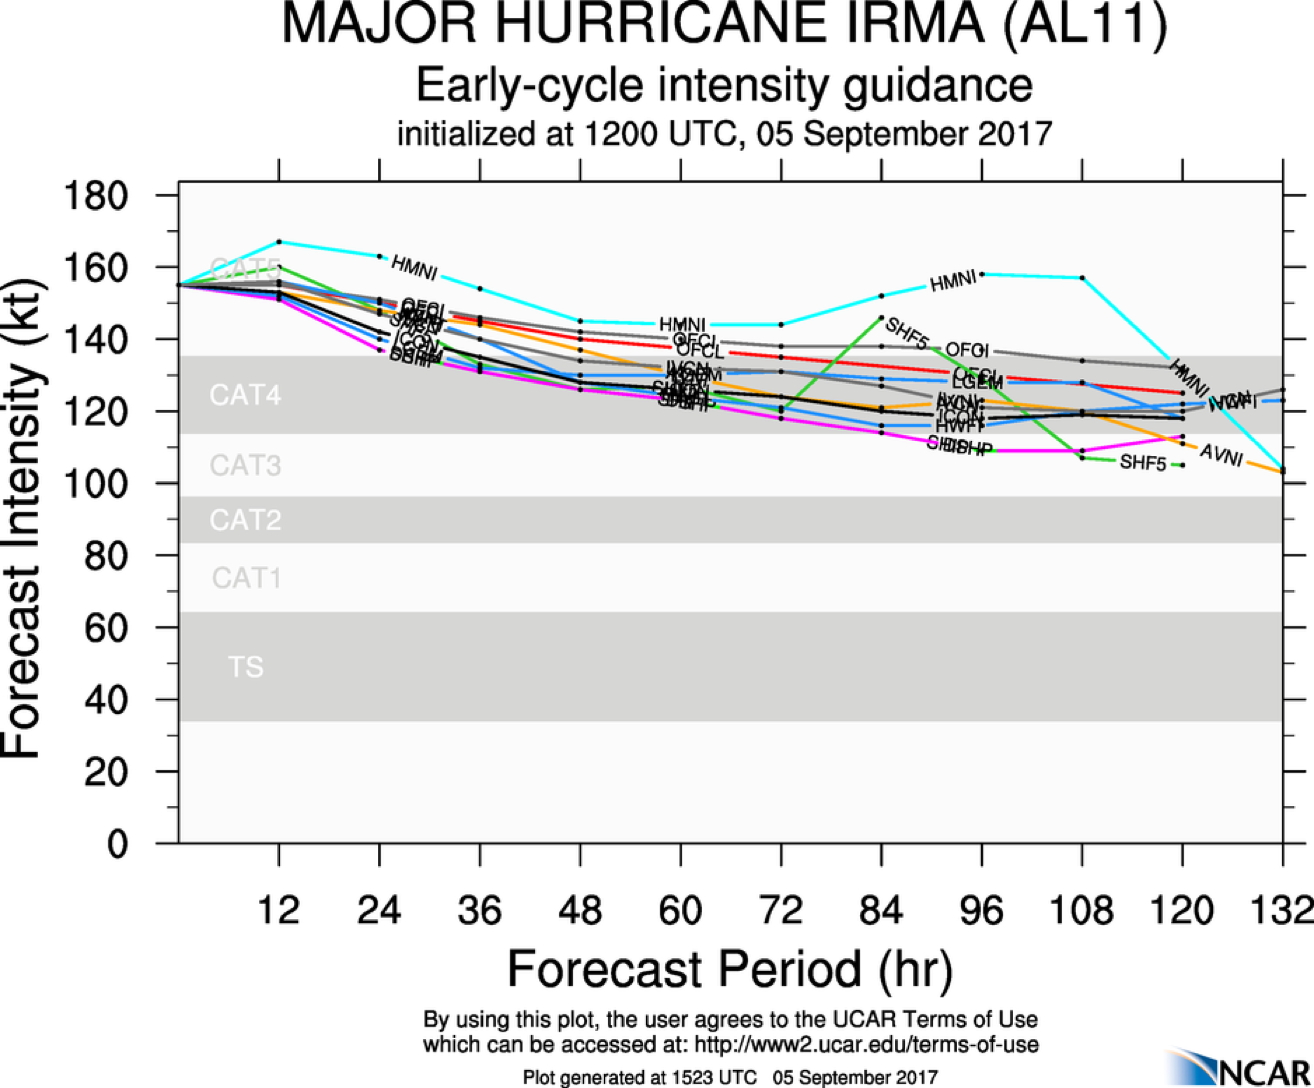
Figure 6. Intensity forecast guidance for Irma valid 1200 UTC 5 September (image courtesy http://www.ral.ucar.edu/guidance/realtime/current/) |
|
Prepared by the Hurricane Research Division August 07, 2017 Aircraft: N42RF Proposed takeoff: 03/1900Z
DROP LOCATION TABLE
| #
| LAT
| LON
| RAD/AZM
| Time
|
| deg min
| deg min
| n mi/deg
| hr:min
| 1S | 16 11 | 49 12 | 105/210 | 1:56
| 2S | 19 13 | 47 23 | 105/030 | 2:49
| 3S | 19 13 | 49 13 | 105/330 | 3:16
| 4S | 16 11 | 47 24 | 105/150 | 4:09
| 5S | 17 42 | 46 28 | 105/090 | 4:36
| 6S | 17 42 | 50 08 | 105/270 | 5:29
| | ||||||||||||||
Mission Summary :
| Take off | Landing
| Barbados, BWI
| 20:34 UTC
| Barbados, BWI
| 02:47 UTC
| Expendables
| 15 Dropsonde (8 HFIP, 6 NHC, 1 NESDIS), 0 AXBTs
| Penetrations
| 4
| | ||||||
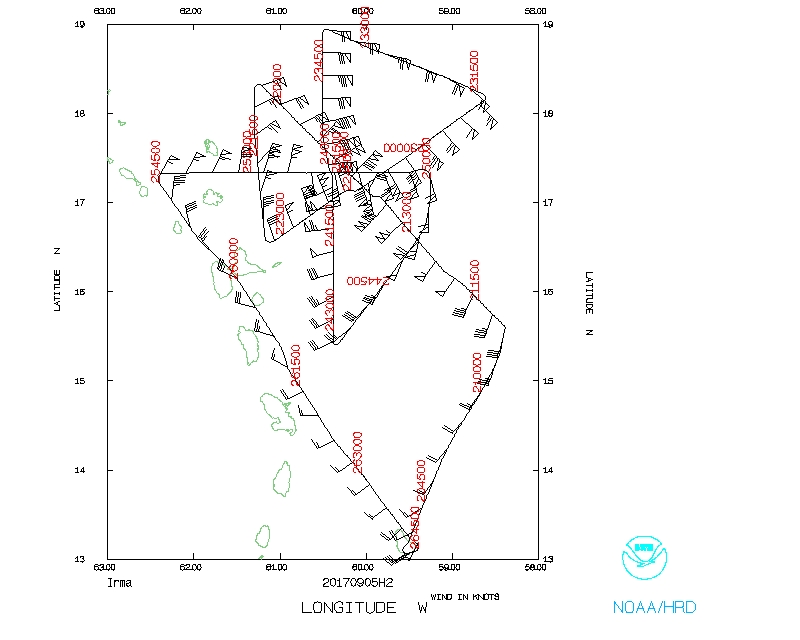
We requested to arrive at the IP no earlier than 2100 UTC, such that all of the data collected during the mission would be assimilated into the 0000 UTC cycle. Prior to takeoff we decided to rotate the inbound/outbound on the 2nd pass (between WP #3 and #4) 10° clockwise (inbound 235°/outbound 055°) so that the leg would be parallel to a CYGNSS overpass (Fig. 7), which will pass over the storm around 2230 UTC. The timing of the P3 leg would be in very close proximity to the CYNGSS overpass, although they will not pass through the storm in the same location. The overpass will be through the storm southeast of the center. Just prior to takeoff, the overpass was right over the most recent fix of Irma's center from Teal. All other legs of the rotated Figure-4 were not adjusted.
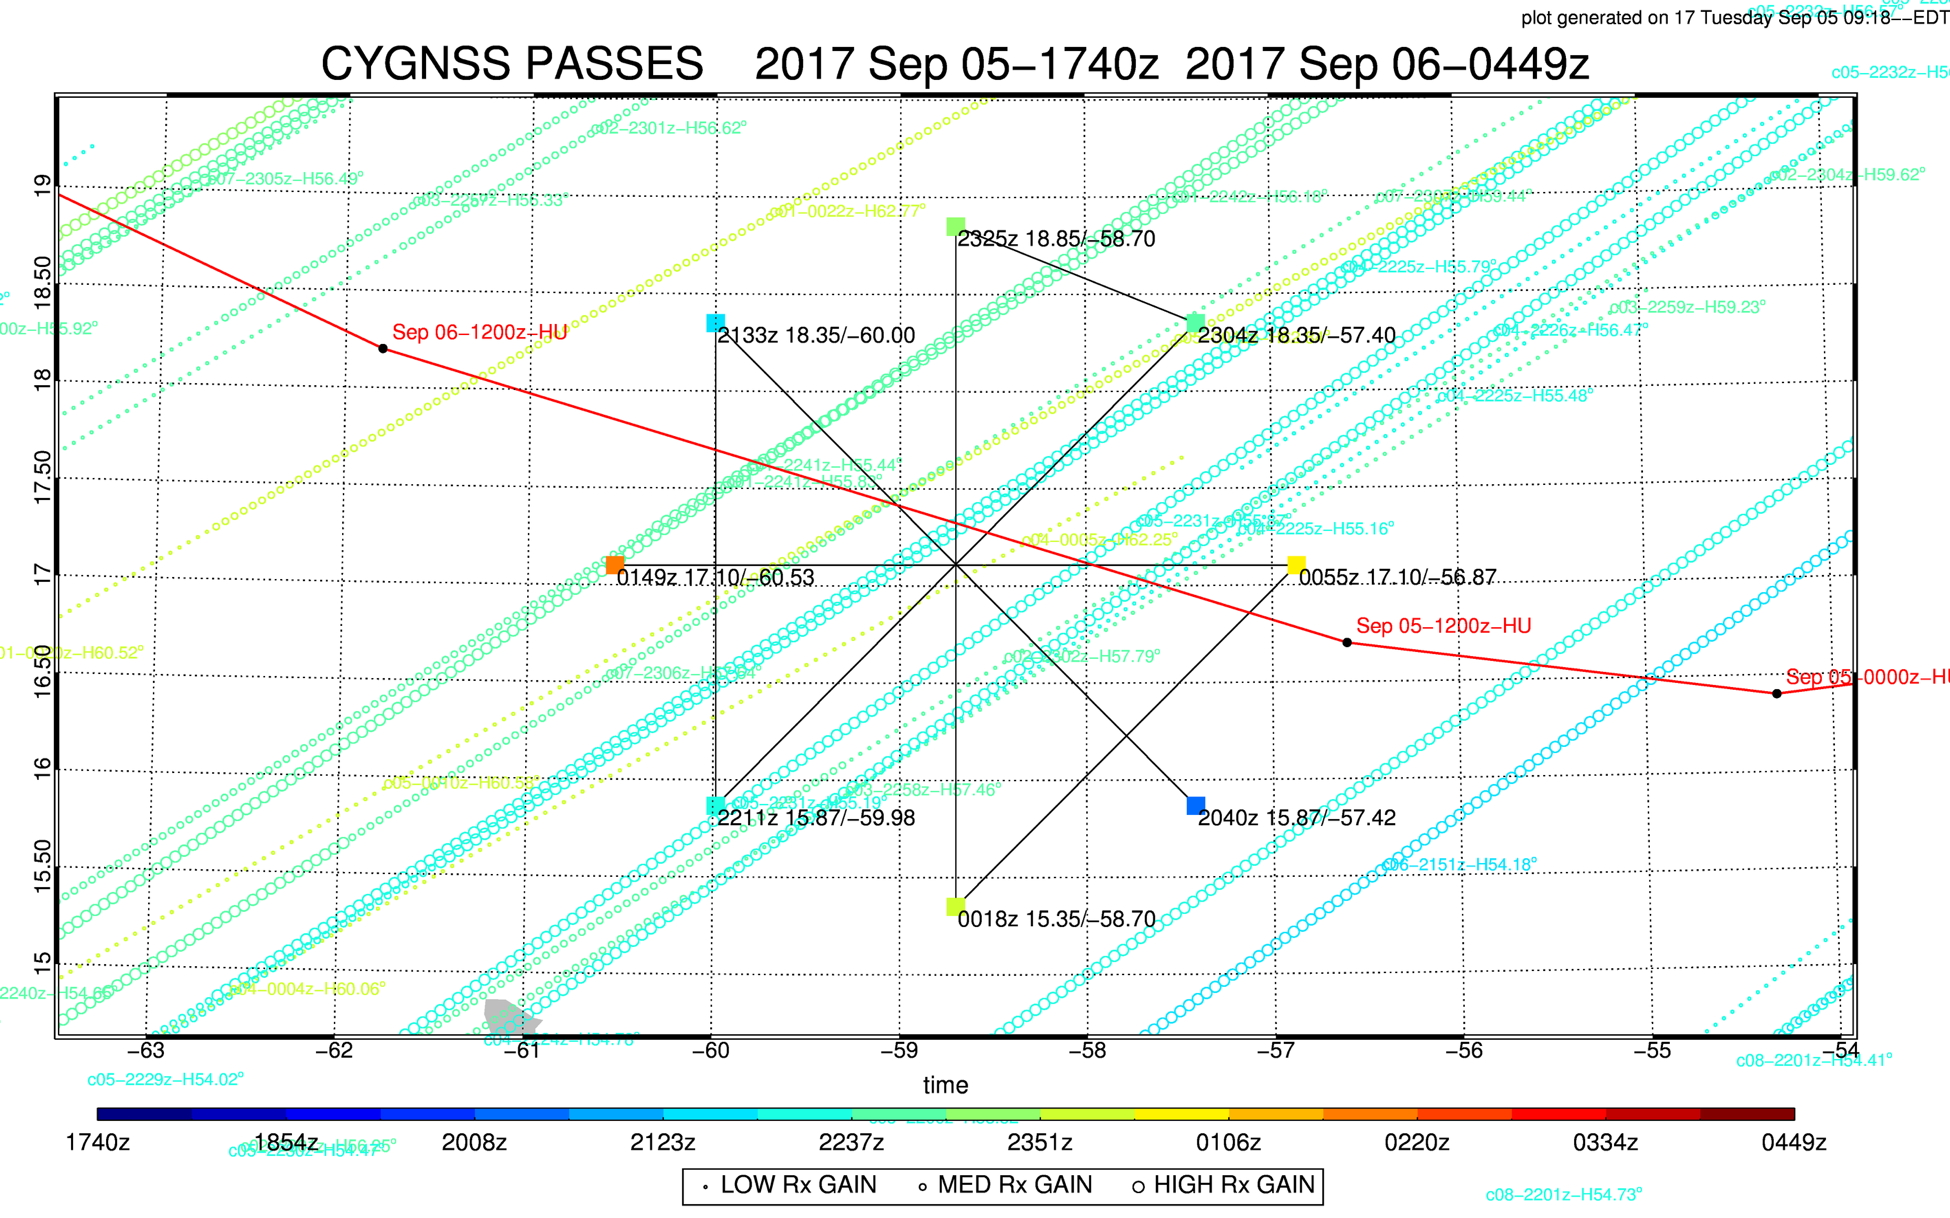
Figure 7. CYGNSS overpasses during the mission (time is colored), overlaid with the planned flight track (black) and timing of turnpoints. The track of the storm is colored red. |
The actual flight track is shown in Fig. 8. On the ferry we checked the TDR for surface returns, as well as radial winds and reflectivity in both fore and aft. We arrived at the IP at 2108 UTC (Sonde #1) and went inbound for the first center pass on the 135° azimuth. While inbound, we decided to drop a sonde at the location of the inbound maximum wind (Sonde #2 at 2135 UTC). The wind at 11 m from this sonde was 152°/124 kt. We fixed the center at 2138 UTC near 17°4'N / 59°54'W (the IR imagery near the time of the center pass is in Fig. 10; lower fuselage, LF, imagery in Fig. 11; TDR cross section in Fig. 12), dropped a sonde (Sonde #3) and went outbound on 315°. We dropped another sonde at the radius of maximum outbound wind (Sonde #4 at 2142 UTC). The extrapolated MSLP was 915 mb on the first pass (Fig. 9). Although the data at low-levels in this sonde were compromised (most likely due to the sonde splashing in the ocean, undetected due to high waves), the maximum "good" wind observed was 326°/126 kt at 37 m. The 150 m layer mean wind was 6°/ \144 kt. We continued outbound to WP #2, which we reached at 2203 UTC (Sonde #5). The peak SFMR surface wind outbound to the NW was 158 kt (Fig. 9).
We proceeded downwind to WP #3 (arrived 2226 UTC, Sonde #6), which was now inbound on 235° to coordinate with the CYGNSS overpass at approximately the same time. Unfortunately, as there was an island near the WP, we had to shorten the inbound leg. There was no inbound maximum wind sonde. We fixed the center at 2245 UTC near 17°7'N / 60°8'W (IR imagery near the time of the center pass is in Fig. 13; LF imagery in Fig. 14; TDR cross section in Fig. 15) , and dropped another sonde (Sonde #7). The extrapolated MSLP on this second pass was 916 mb. On the outbound leg on 055°, we dropped a maximum wind sonde for NESDIS (as this was a coordinated leg for CYGNSS) (Sonde #8) at 2248 UTC. This sonde reported 192 kt at 200 m, 173 kt at 50 m, and 167 kt at 30 m, We arrived at WP #4 at 2313 UTC (Sonde #9), completing the first Figure-4, and turned downwind for WP #5.
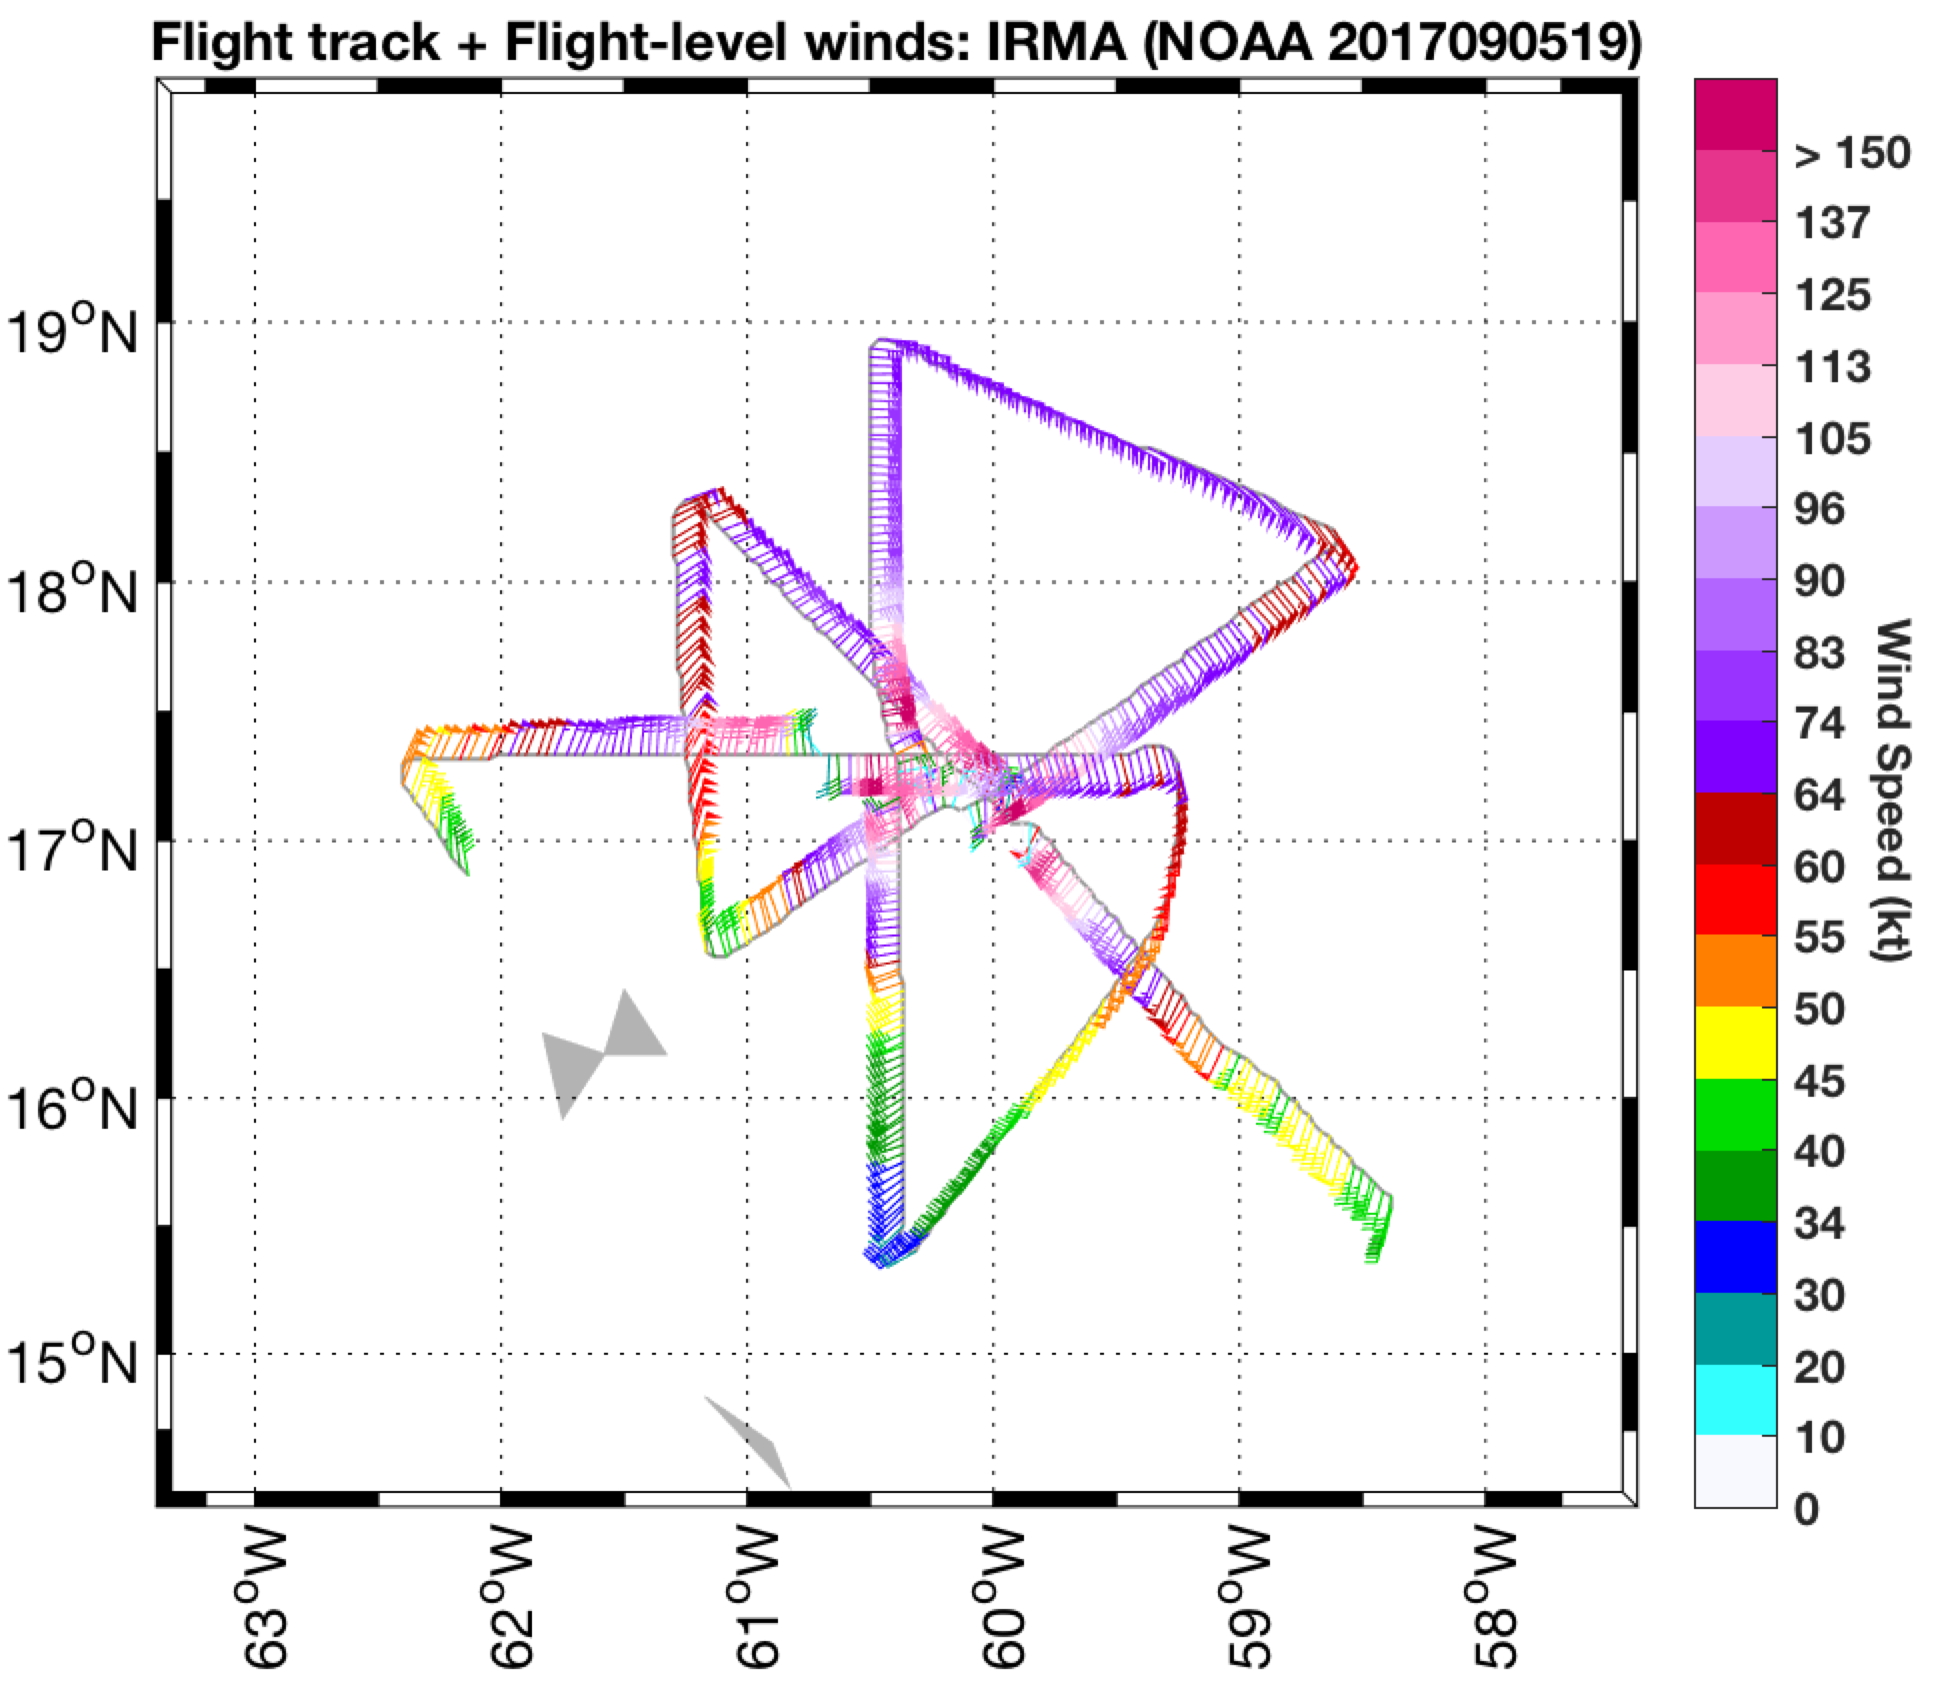
Figure 8. Actual flight track for mission 20170905H2. Flight-level winds (barbs) and wind speeds (shaded, kt) indicated. |

Figure 9. Time series of flight-level winds (green, kt), SFMR surface winds (blue, kt), and SFMR rain rate (red, mm/hr) for mission 20170905H2, as well as the extrapolated surface pressure (mb). |
At WP #5 (Sonde #10, 2335 UTC), we turned inbound towards the center from the north. As in the previous two passes, it was apparent on the LF that there were two distinct concentric eyewalls (two distinct radial reflectivity peaks). On the inbound, we observed a peak flight-level wind of 170 kt, the highest value of the mission (Fig. 9). We fixed the center at 0003 UTC near 17°12'N / 60°23'W (Sonde #11) (IR imagery near the time of the center fix, Fig. 16; LF imagery in Fig. 17; TDR cross section, Fig 18). After the fix, our outbound was on 180° to WP #6, which was reached at 0031 UTC (Sonde #12). On the downwind to WP #7, it was apparent that there was a lightning-producing outer rainband near WP #7. As such, we decided to shorten the next inbound leg to about 80 nm to avoid flying through the rainband. At WP #7 (0100 UTC, Sonde #13), we went inbound on 090°. We fixed the center a final time at 0121 UTC near 17°20'N / 60°43'W (Sonde #14) (IR imagery at the time of this pass in Fig. 19; LF imagery, Fig. 20; TDR cross section, Fig. 21). On the final pass, we observed 158 kt FL winds on the east side of the storm and 142 kt on the west side (Fig. 9). The peak surface wind from SFMR was 144 kt, and the extrapolated MSLP during the center fix was 915 mb. On this final pass, the two concentric eyewalls seen earlier in the LF appeared more connected. While we had a concern at the beginning of the mission that the islands would interfere with the final outbound leg to the west of the storm, by the time we left flew the leg we were able to get the full 105 nm leg to the west. After experiencing moderate to moments of severe turbulence throughout most of the outbound leg, we arrived at WP #8, completing the second Figure-4 at 0143 UTC (Sonde #15).
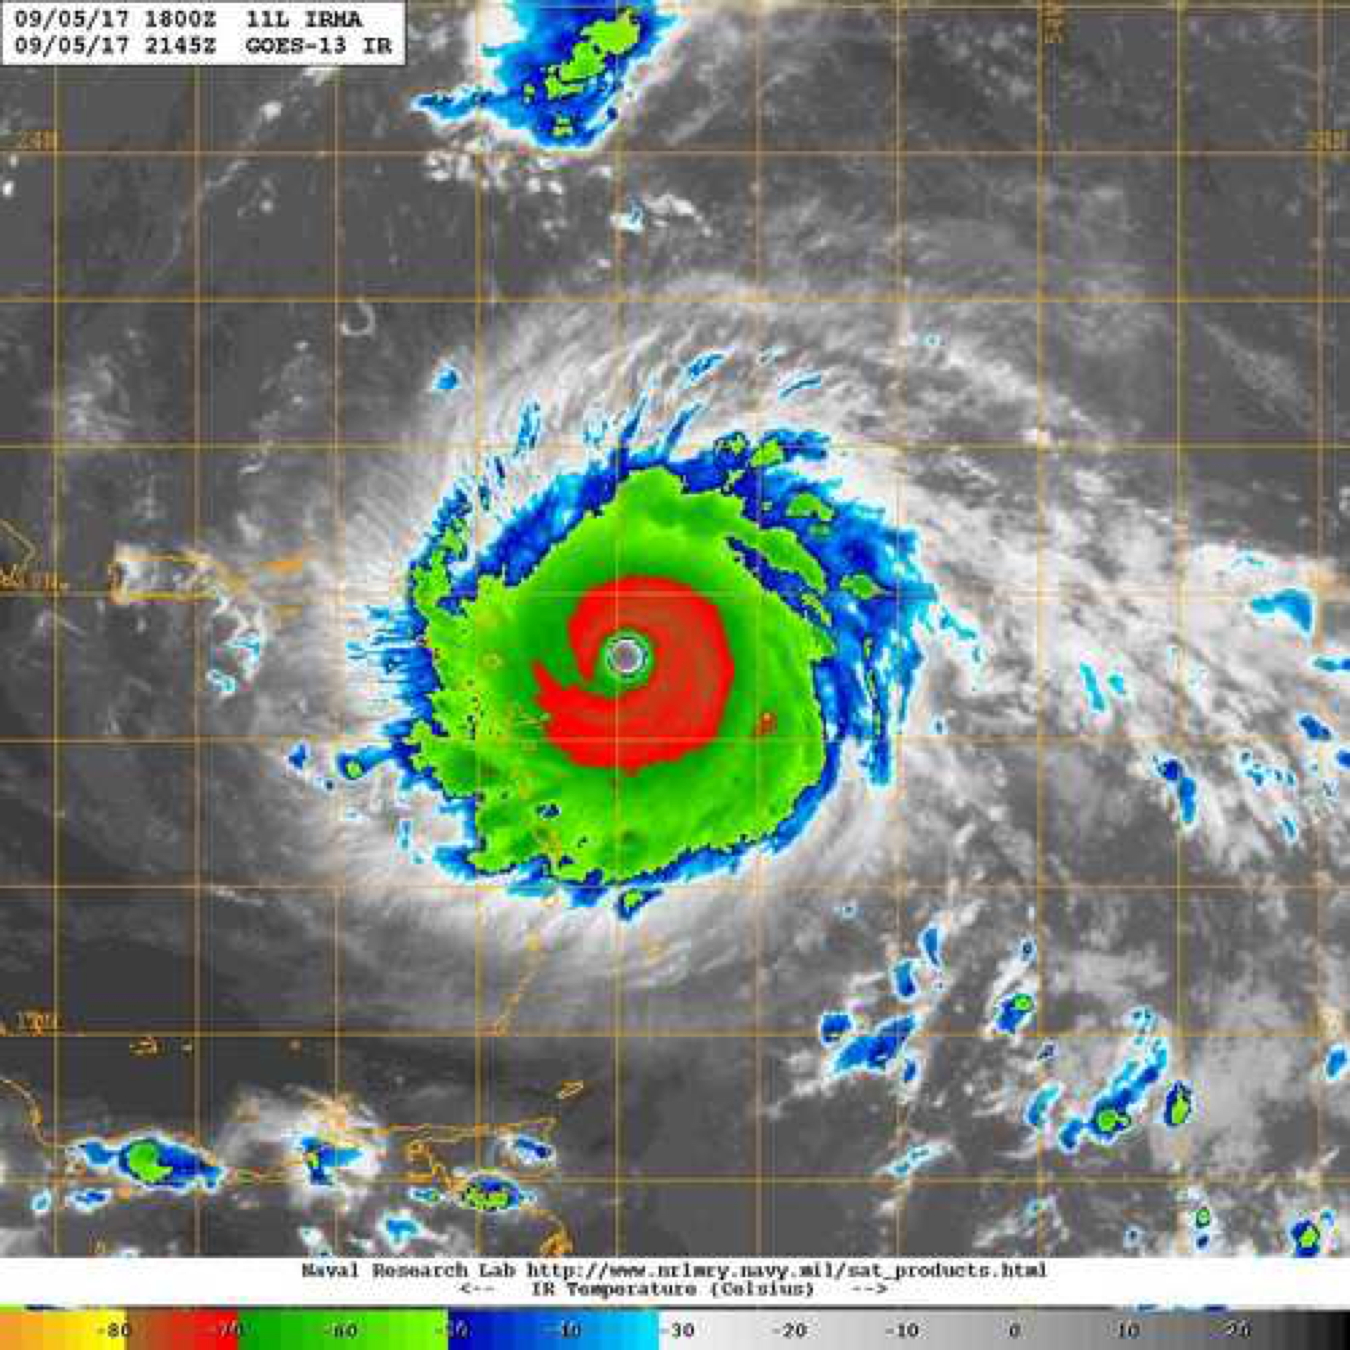
Figure 10. IR imagery at 2145 UTC 5 September, around the time of the first center pass (image courtesy the Naval Research Laboratory, nrlmry.navy.mil/TC.html) |
Figure 11. LF imagery at 2136 UTC 5 September |
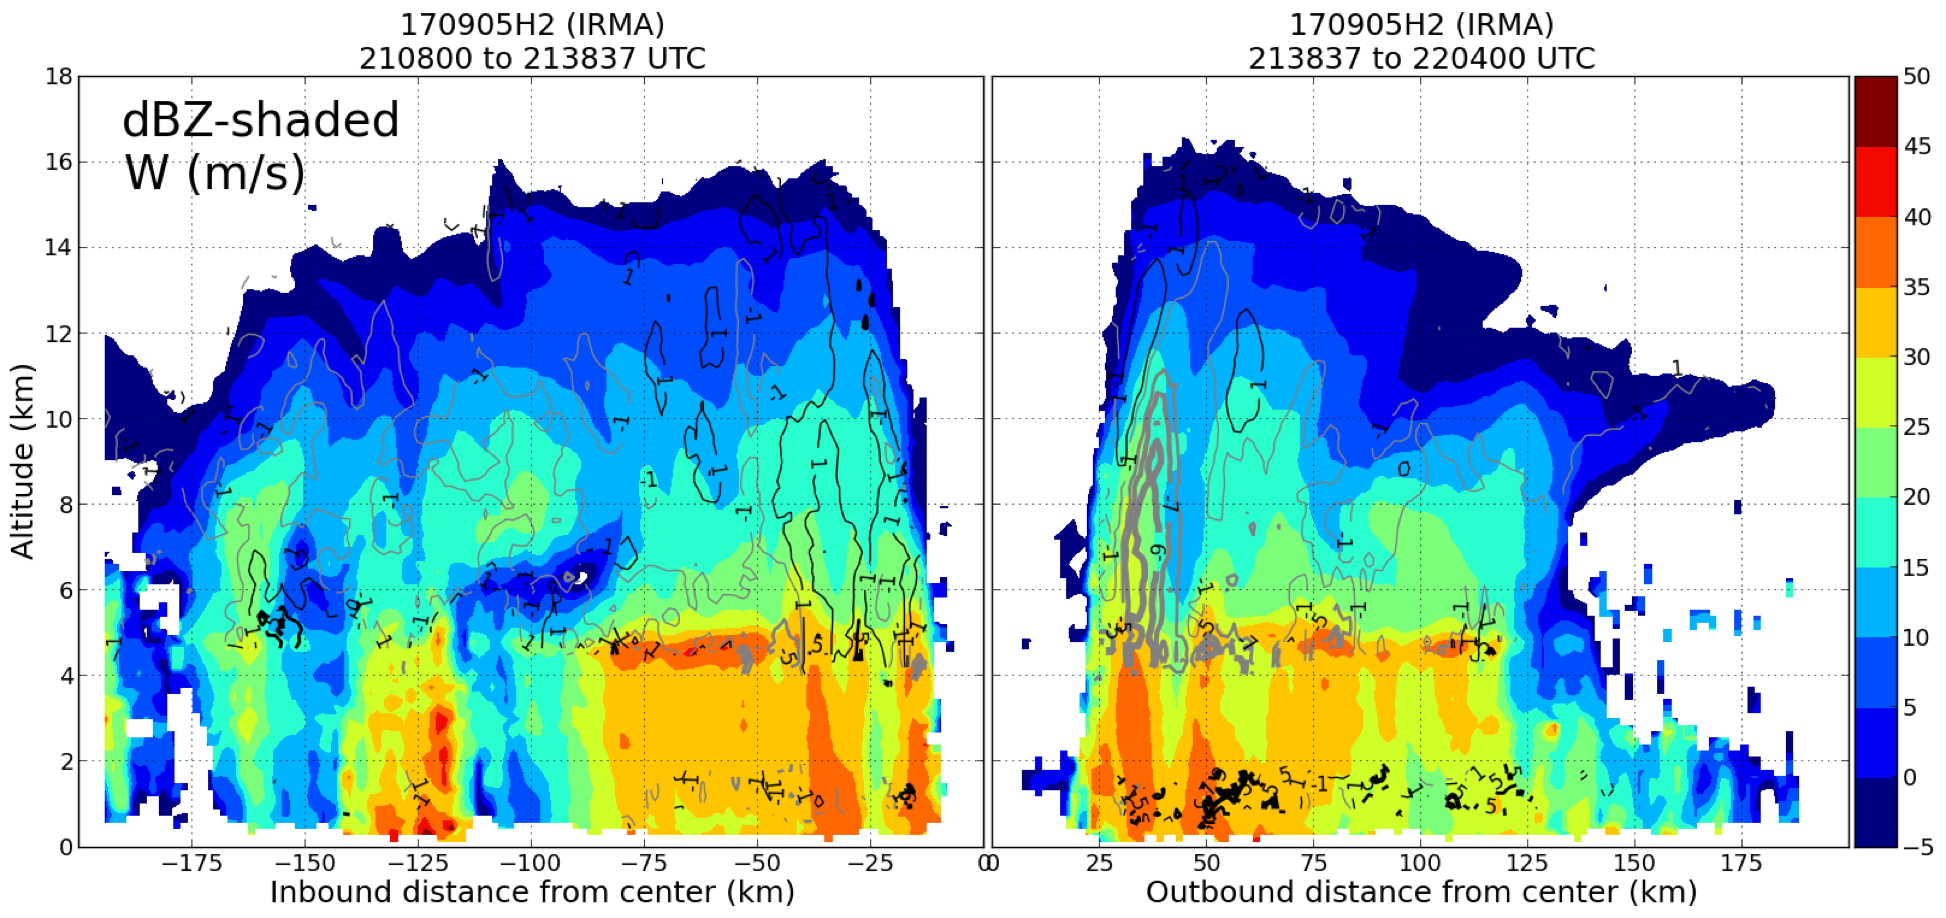
Figure 12. TDR vertical profile analysis of reflectivity (shaded, dBZ) and vertical velocity (contoured, m s-1) for the first pass (between the IP to the SE and WP #2 to the NW), centered at 2138 UTC |
Mission Evaluation / Problems:
We were able to successfully complete the rotated Figure-4, producing 4 TDR analyses, as well as all turn point sondes (8), center sondes (4), and 3 maximum wind sondes (2 NHC, 1 NESDIS). The maximum wind sondes were on the first pass inbound in the SE eyewall (124 kt at 11 m) and outbound in the NW eyewall (126 kt at 37 m), then on the second pass on the outbound in the NE eyewall (167 kt at 30 m), which was for the CYGNSS coordination leg. So a total of 15 sondes were dropped during the mission. We successfully aligned the second pass (between WP #3 and #4) with the orientation of CYGNSS pass (which ended up being right of aircraft track) close in time to the leg by rotating the azimuth's 10° clockwise. The inbound on the coordination leg, however, had to be truncated due to an island near WP #3. The final inbound on 090° was also truncated due to a lightning-producing rain band near WP #7 to the east of the storm. The final outbound leg to WP #8 was unaffected, although islands were located just to the north and south.
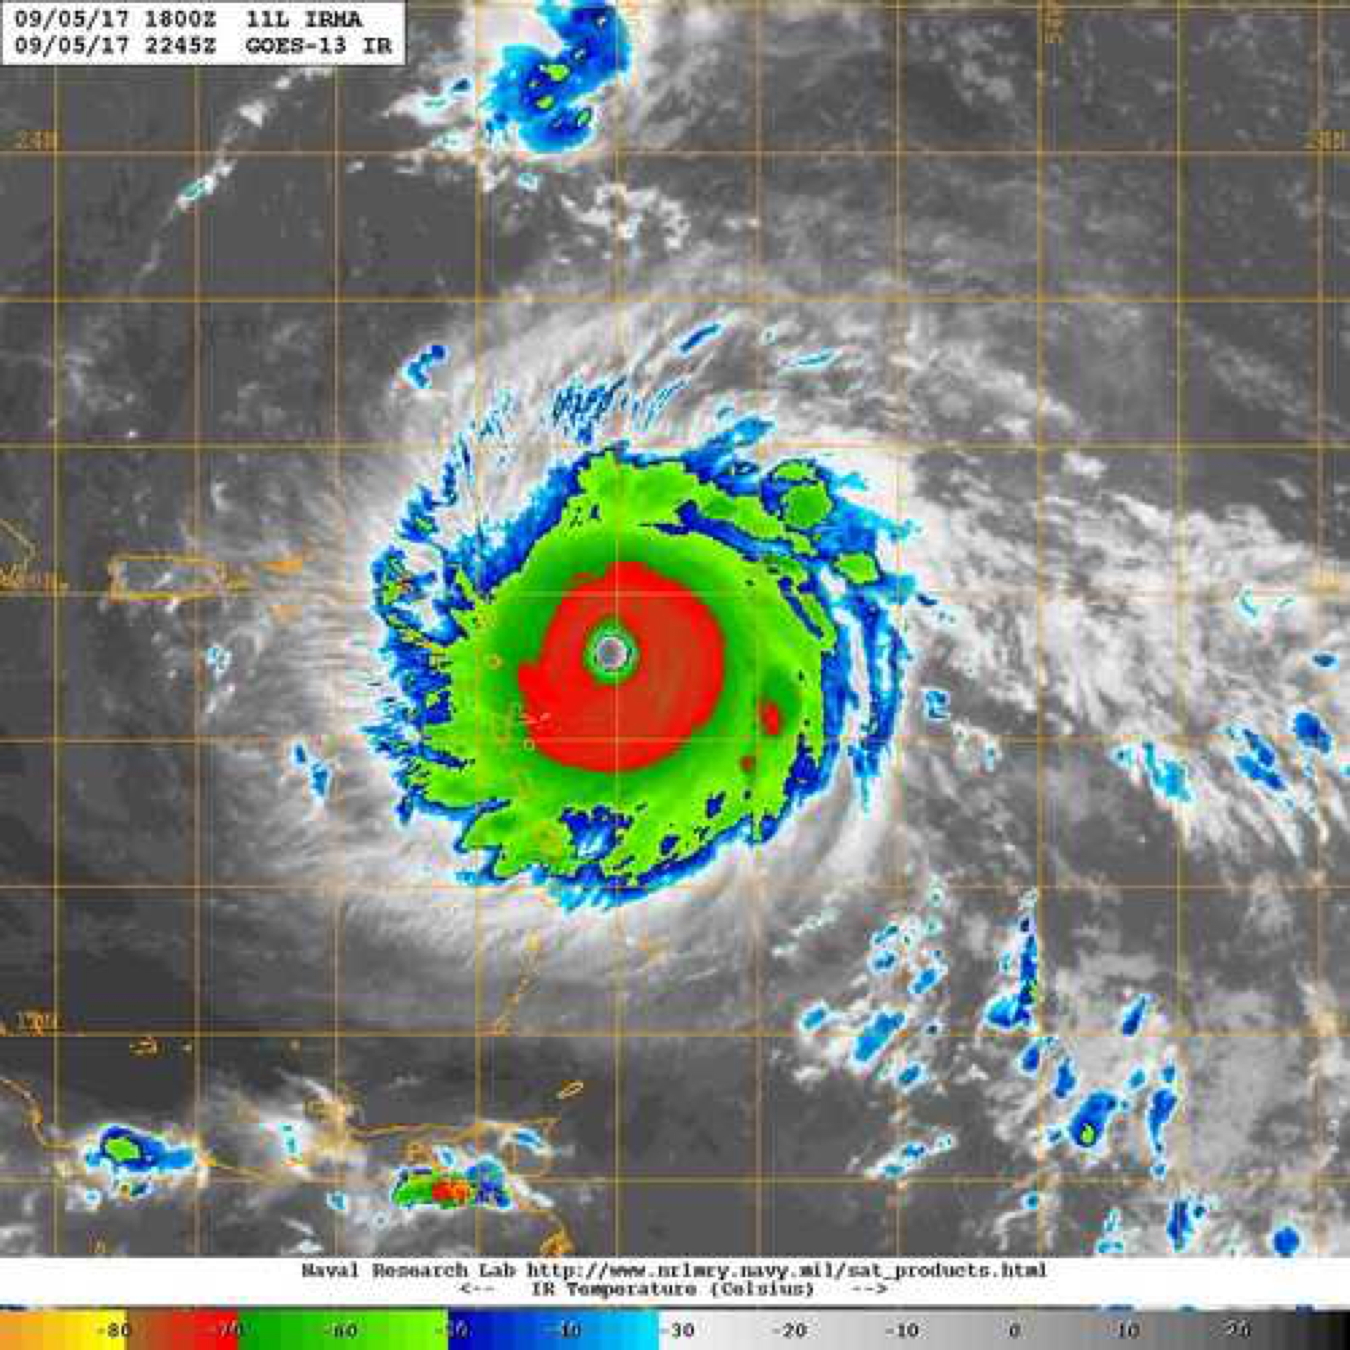
Figure 13. IR imagery at 2245 UTC 5 September, around the time of the second center pass (image courtesy the Naval Research Laboratory, nrlmry.navy.mil/TC.html) |
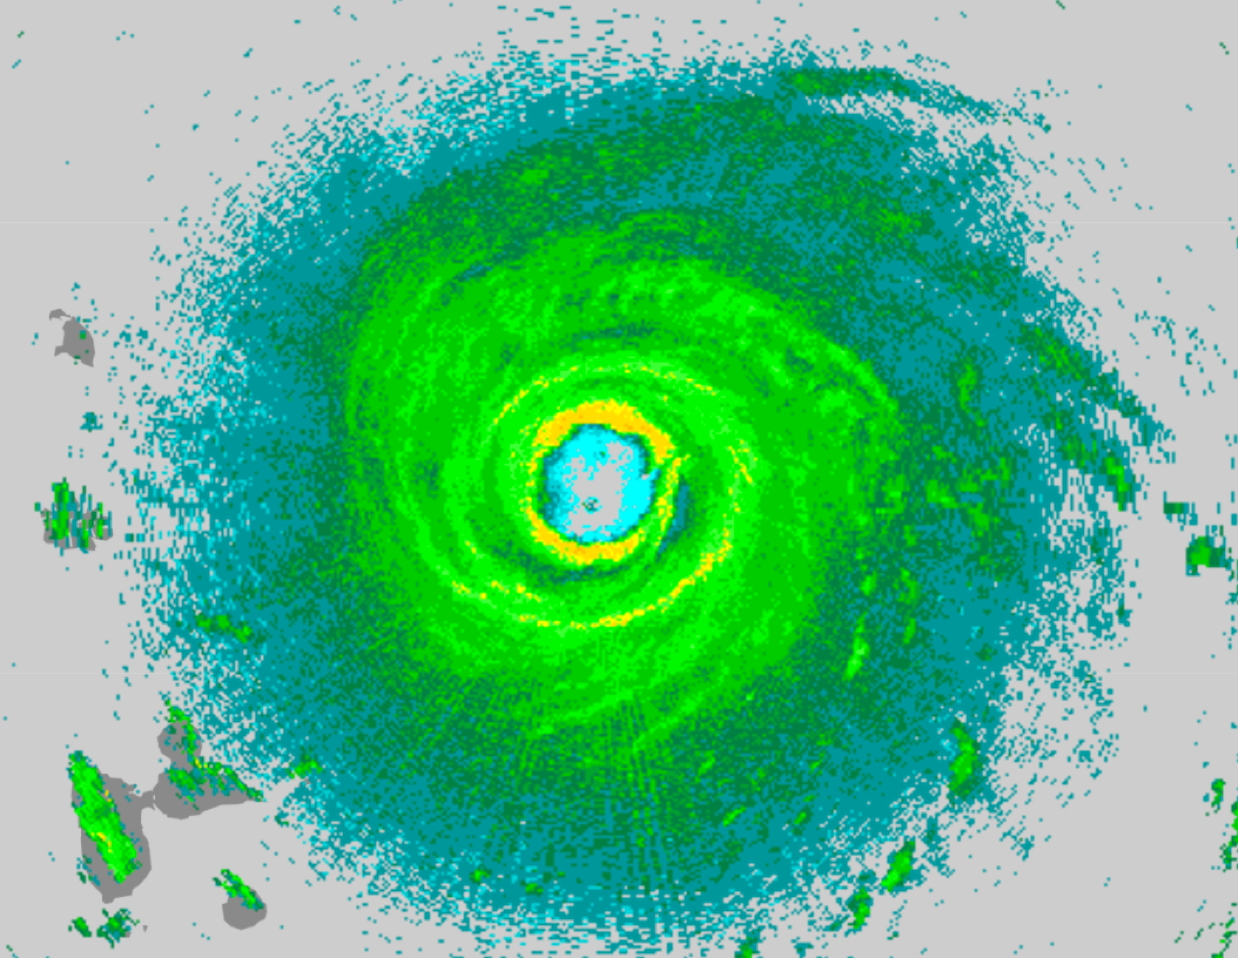
Figure 14. LF imagery at 2244 UTC 5 September |
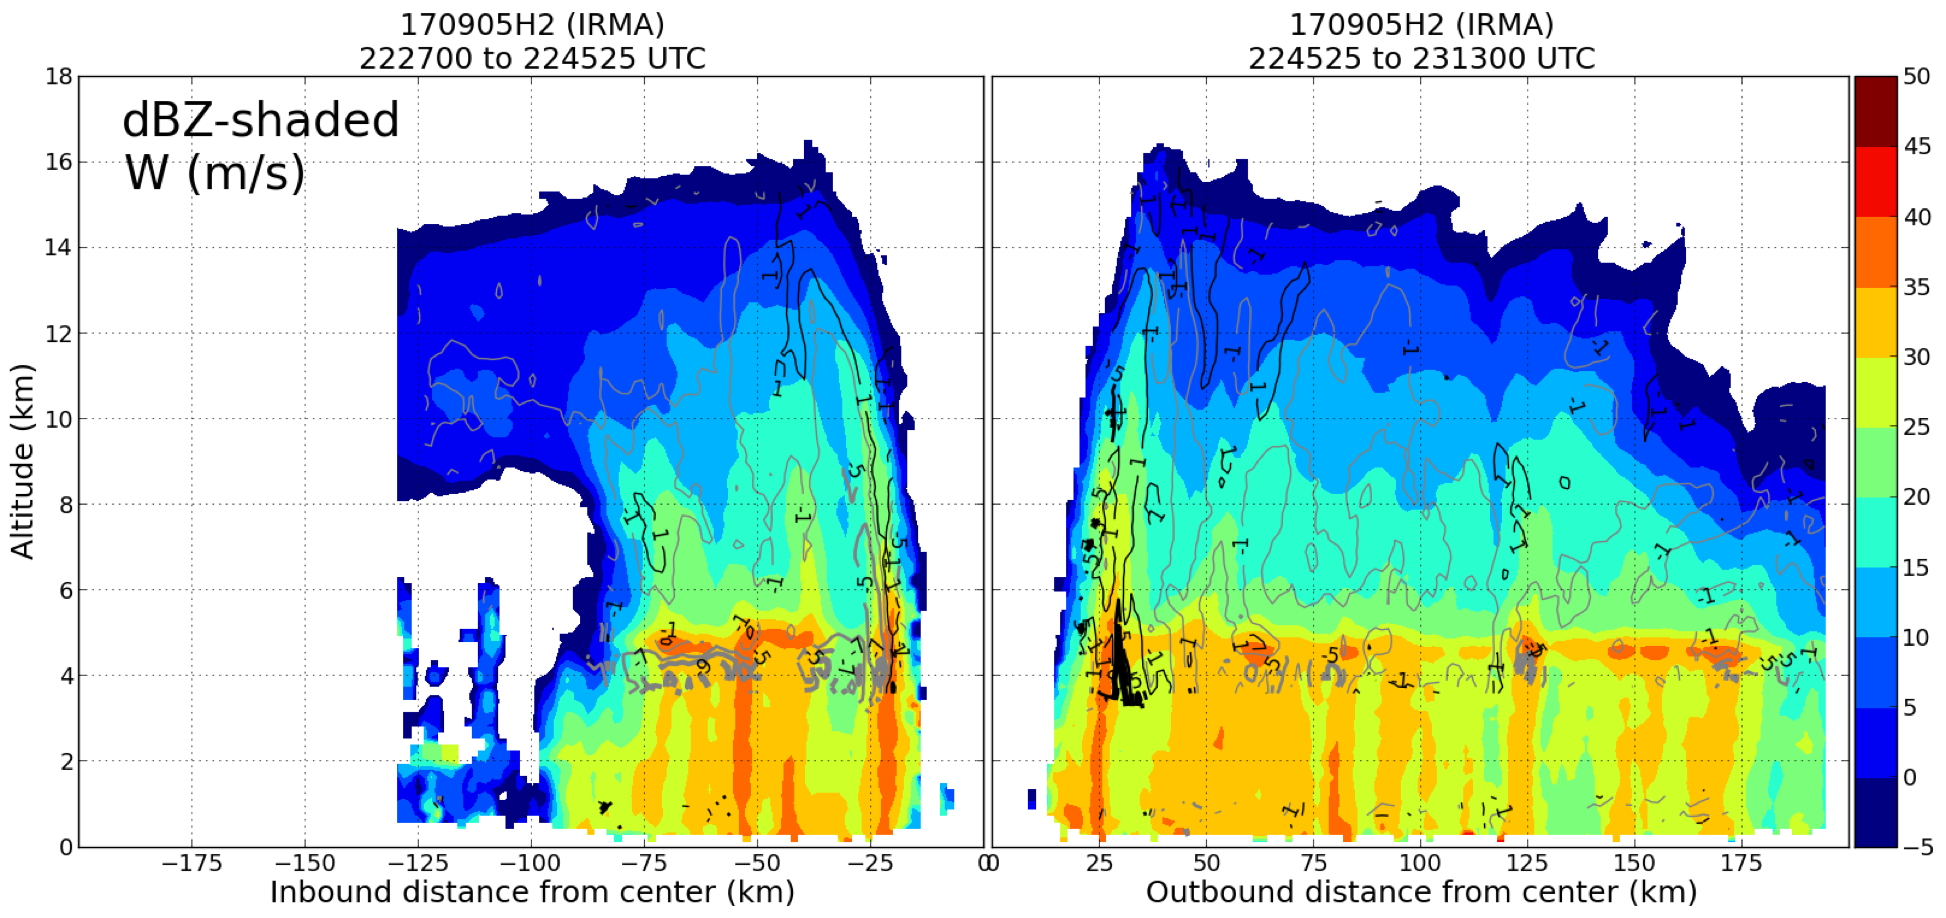
Figure 15. TDR vertical profile analysis of reflectivity (shaded, dBZ) and vertical velocity (contoured, m s-1) for the second pass (between WP #3 to the SW and WP #4 to the NE), centered at 2245 UTC |
Overall, we saw some drop in MSLP during the flight (926 mb to 914 mb), but little change in the sustained wind speed (remained peak sustained of 160 kt), therefore Irma was a steady-state Category 5 hurricane during the mission. After the first center sonde reported 920 mb, each of the last 3 reported 916 mb. Radar indicated two concentric eyewalls for the first few passes, but that characteristic was less obvious on the final pass. Moderate (and some instances of severe turbulence) were experienced during each penetration, but was most notable on the final outbound to the west of the storm.
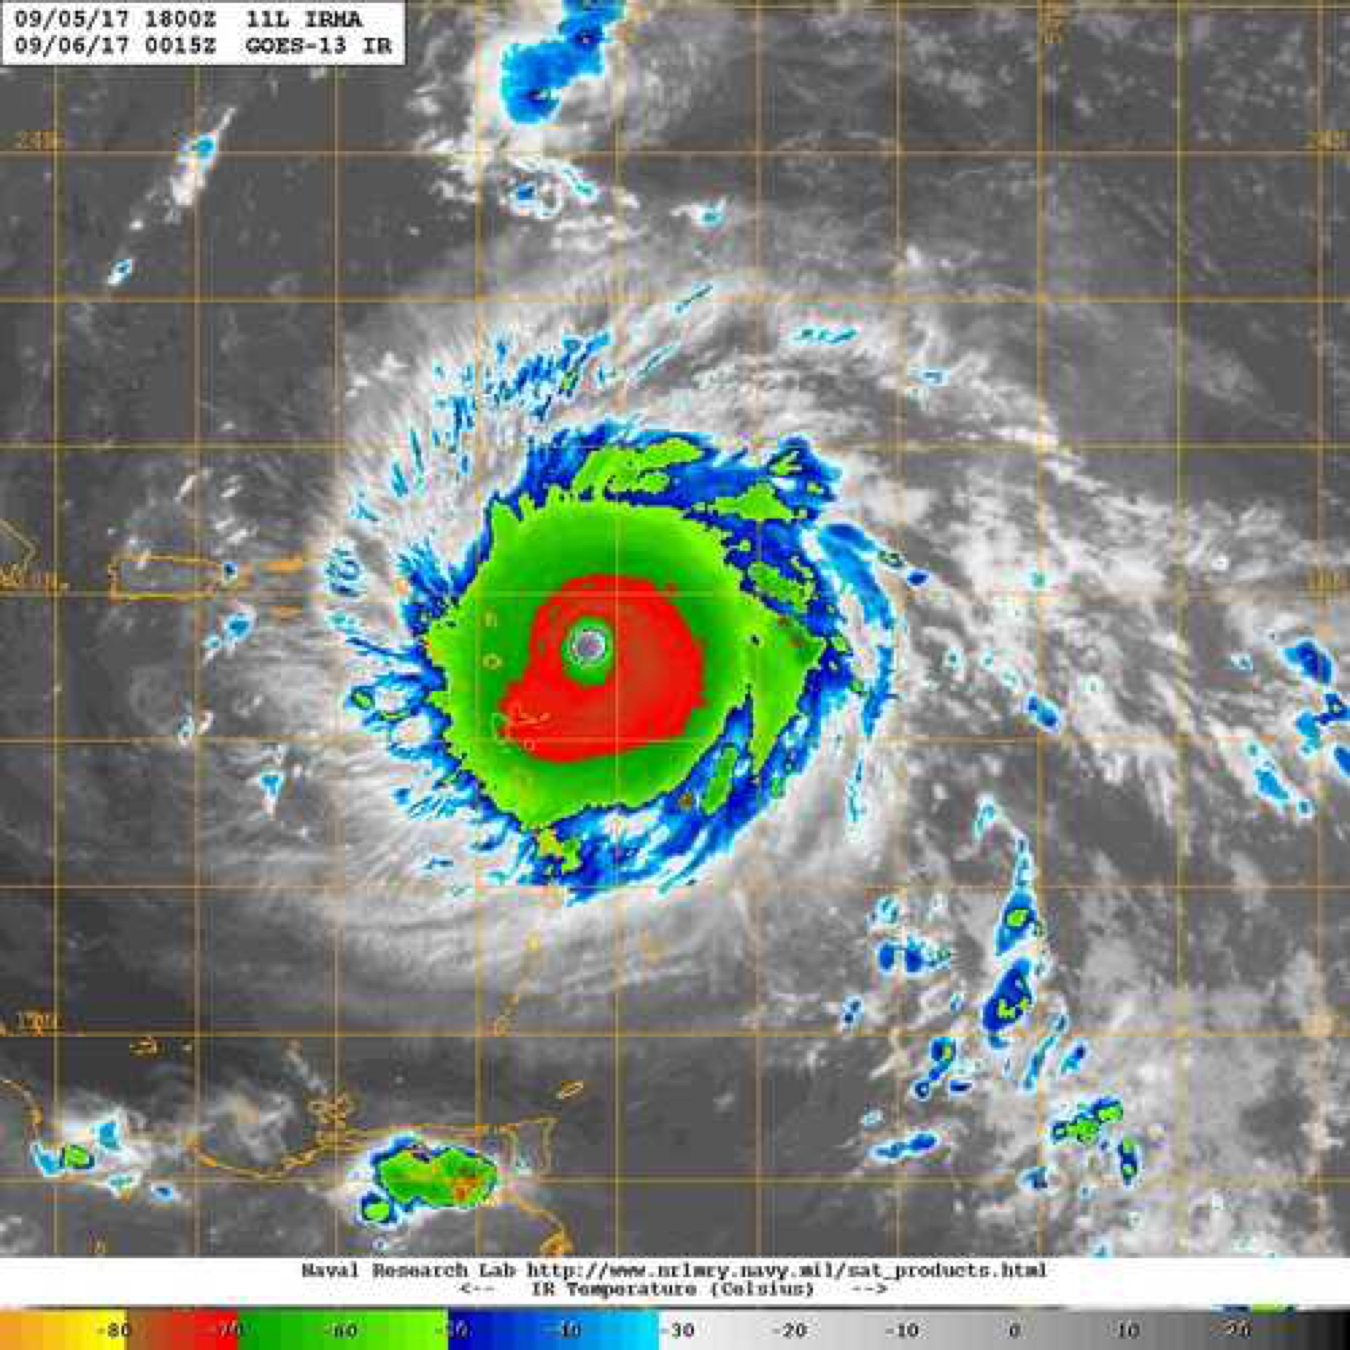
Figure 16. IR imagery at 0015 UTC 6 September, around the time of the third center pass (image courtesy the Naval Research Laboratory, nrlmry.navy.mil/TC.html) |
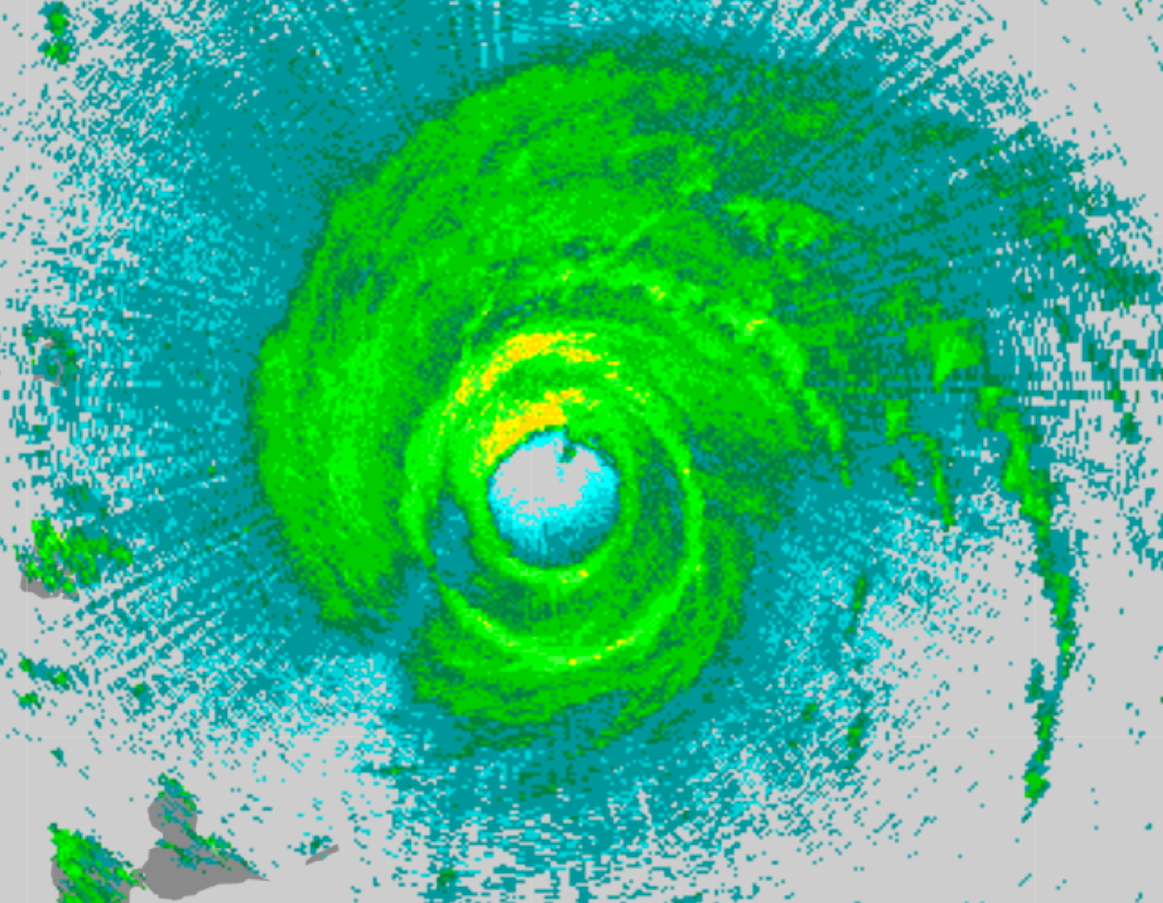
Figure 17. LF imagery at 2357 UTC 5 September |
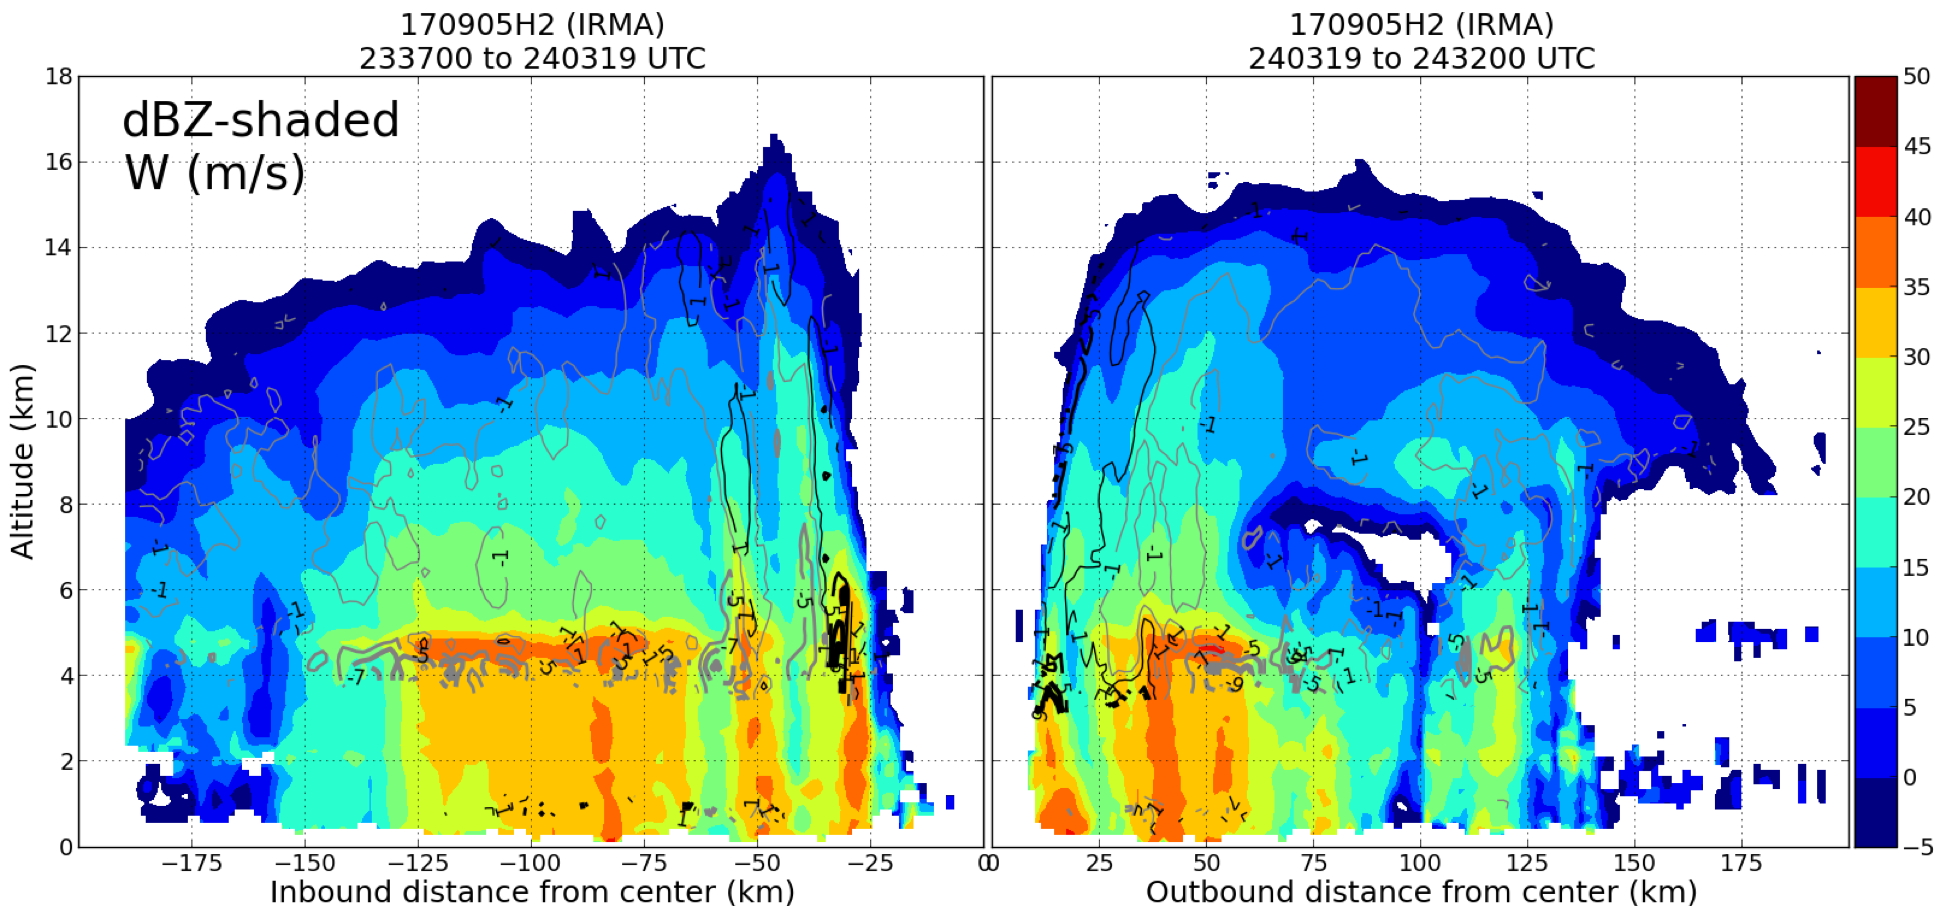
Figure 18. TDR vertical profile analysis of reflectivity (shaded, dBZ) and vertical velocity (contoured, m s-1) for the third pass (between WP #5 to the N and WP #6 to the S), centered at 0003 UTC |
The instruments performed nominally, and there were no safety issues. The maximum wind sondes were difficult to QC as they were seemingly reporting even after splash. We were able to relay the winds at the lowest confident level to NHC, but the WMO messages were void of surface wind information.
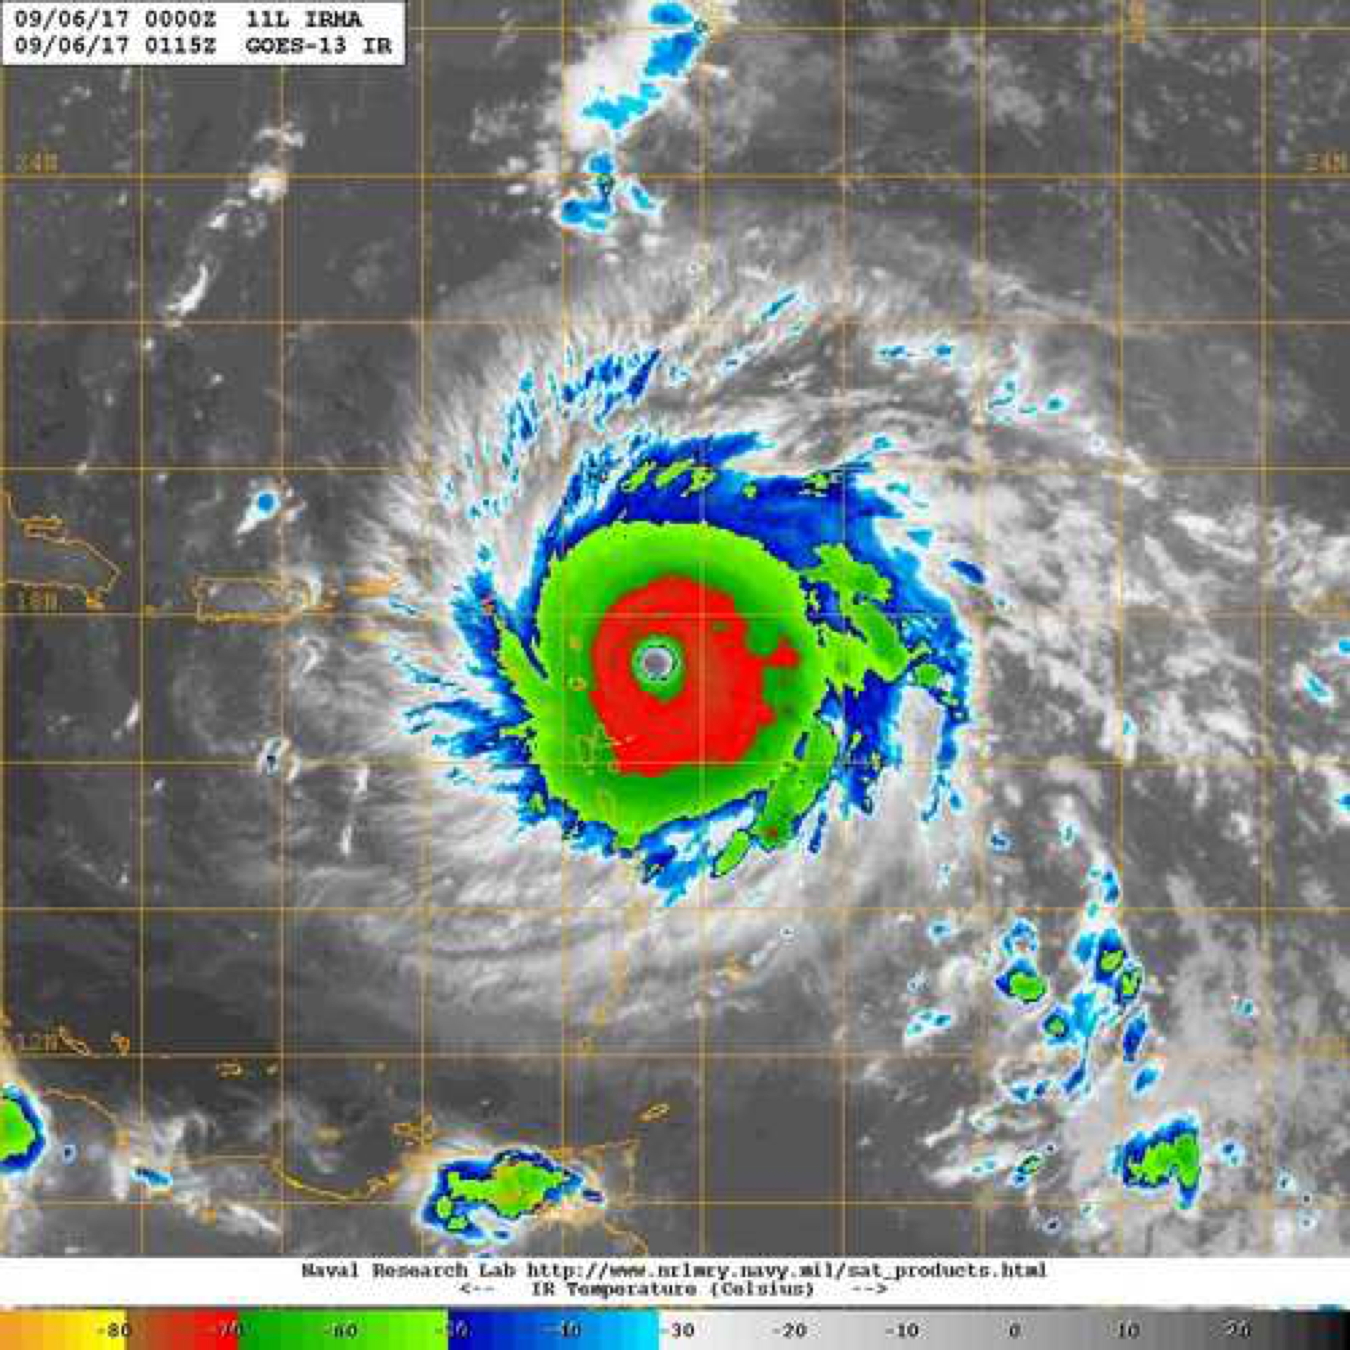
Figure 19. IR imagery at 0115 UTC 6 September, around the time of the fourth and final center pass (image courtesy the Naval Research Laboratory, nrlmry.navy.mil/TC.html) |
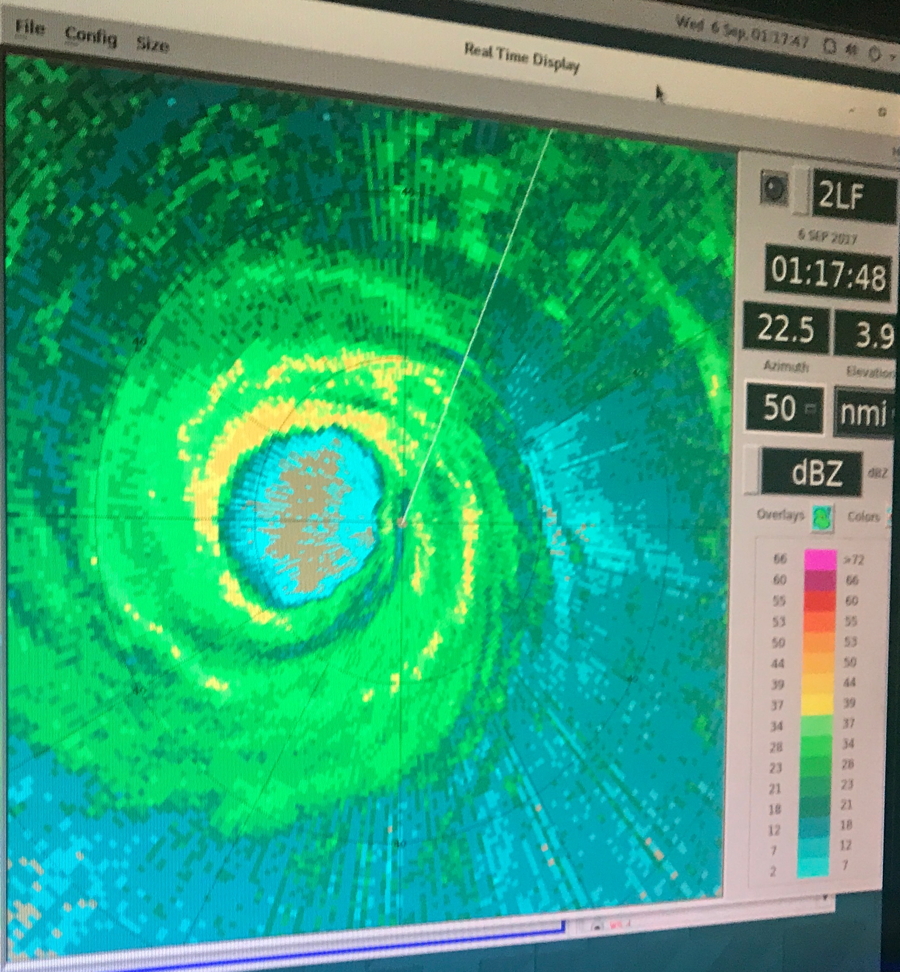
Figure 20. LF imagery at 0117 UTC 5 September |
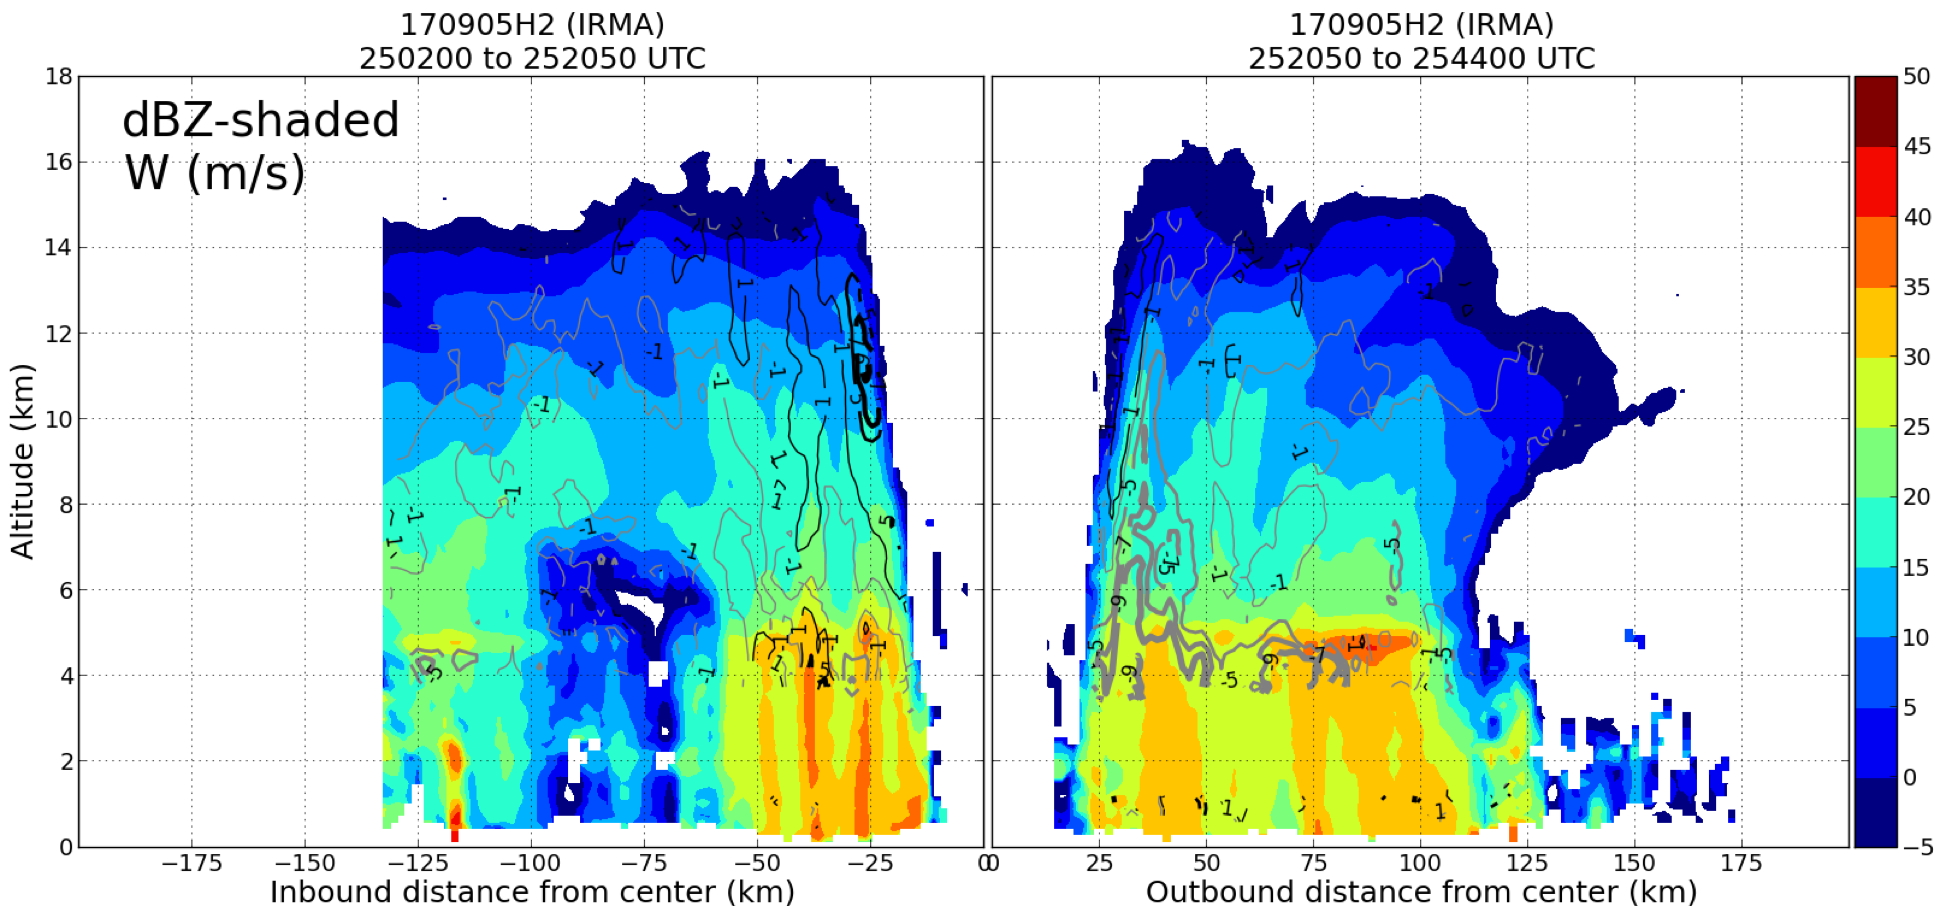
Figure 21. TDR vertical profile analysis of reflectivity (shaded, dBZ) and vertical velocity (contoured, m s-1) for the fourth and final pass (between WP #7 to the E and WP #8 to the W), centered at 0120 UTC |
Jon Zawislak
Sept. 28, 2017
 Flight track |
 Temperature and Moisture |
 Wind and Atlitude |
LPS log |
Radar log |
Drop log
Flight Director's manifest
Flight Director's log |
NetCDF data |
SFMR data |
serial data
1 second data