| Aircraft Commander | Carl Newman |
| Co-pilot | Chris Kerns |
| Co-pilot | Mark Sweeny |
| Flight Engineer | Dewie Floyd |
| Flight Engineer | Paul Darby |
| Navigator | Devin Brakob |
| Flight Director | Ian Sears |
| Data Technician | Joe Bosko |
| Electronics Technician | Bill Olney |
| Electronics Technician | Todd Richards |
| Electronics Technician | Bobby Peek |
| Lead Scientist | Rob Rogers (HRD) |
| Radar Scientist | Sylvie Lorsolo (HRD) |
| Dropsonde Scientist | Brad Klotz (HRD) |
| Observer | John Harrison (AOC) |
| Guest | Jamie McGlinchy (CBS) |
| Guest | Bigad Shaban (CBS) |
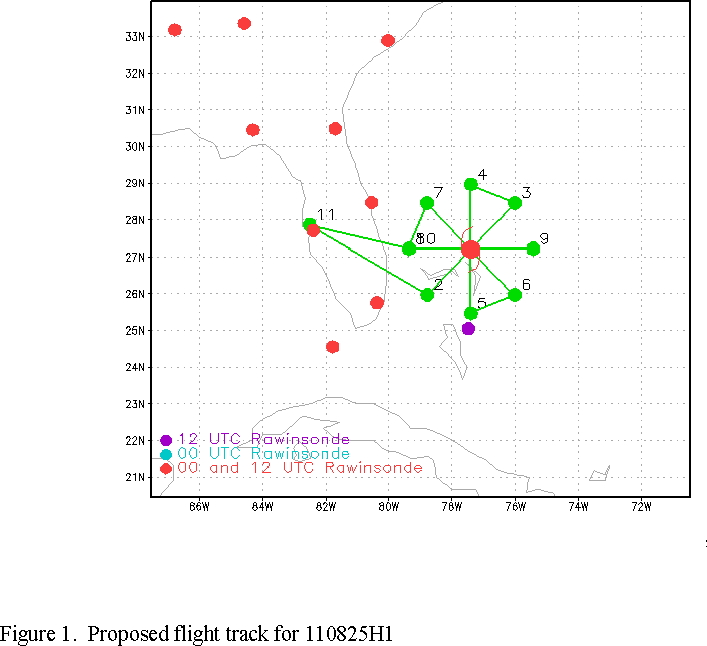
Mission Plan :
NOAA 42RF will perform Tail Doppler Radar (TDR) mission into Hurricane Irene. Fly a rotating figure-4 (Fig. 1) at 8000 ft, with IP 105 nm southwest of center. End up on east side of storm, so perform final pass from east to west before RTB. Drop sondes at turn and midpoints, RMW and first and last center passes. Also try to do high-rain/light-wind drops. The storm is struggling to maintain its intensity, with possible eyewall replacement cycles occurring. There is no eye discernible in satellite or in recent Air Force fixes.
Mission Summary :
| Take off | Landing
| MacDill AFB, FL | 25/19:49 UTC
| MacDill AFB, FL | 26/03:25 UTC
| | ||
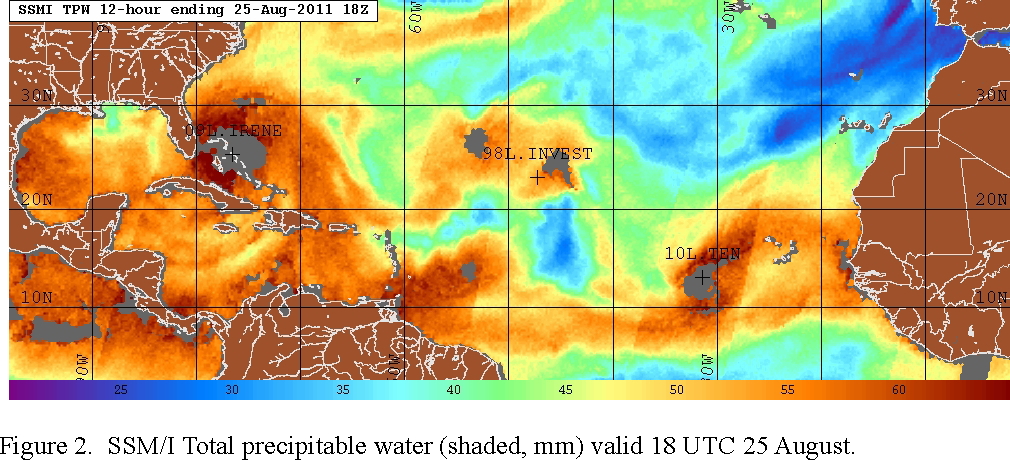
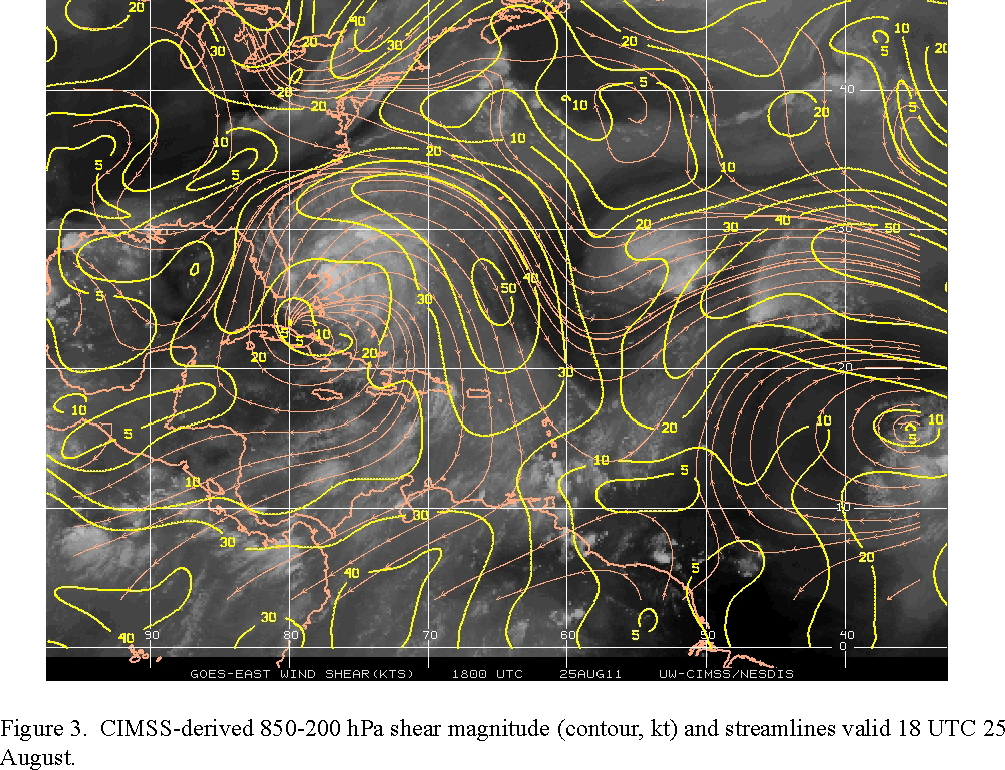
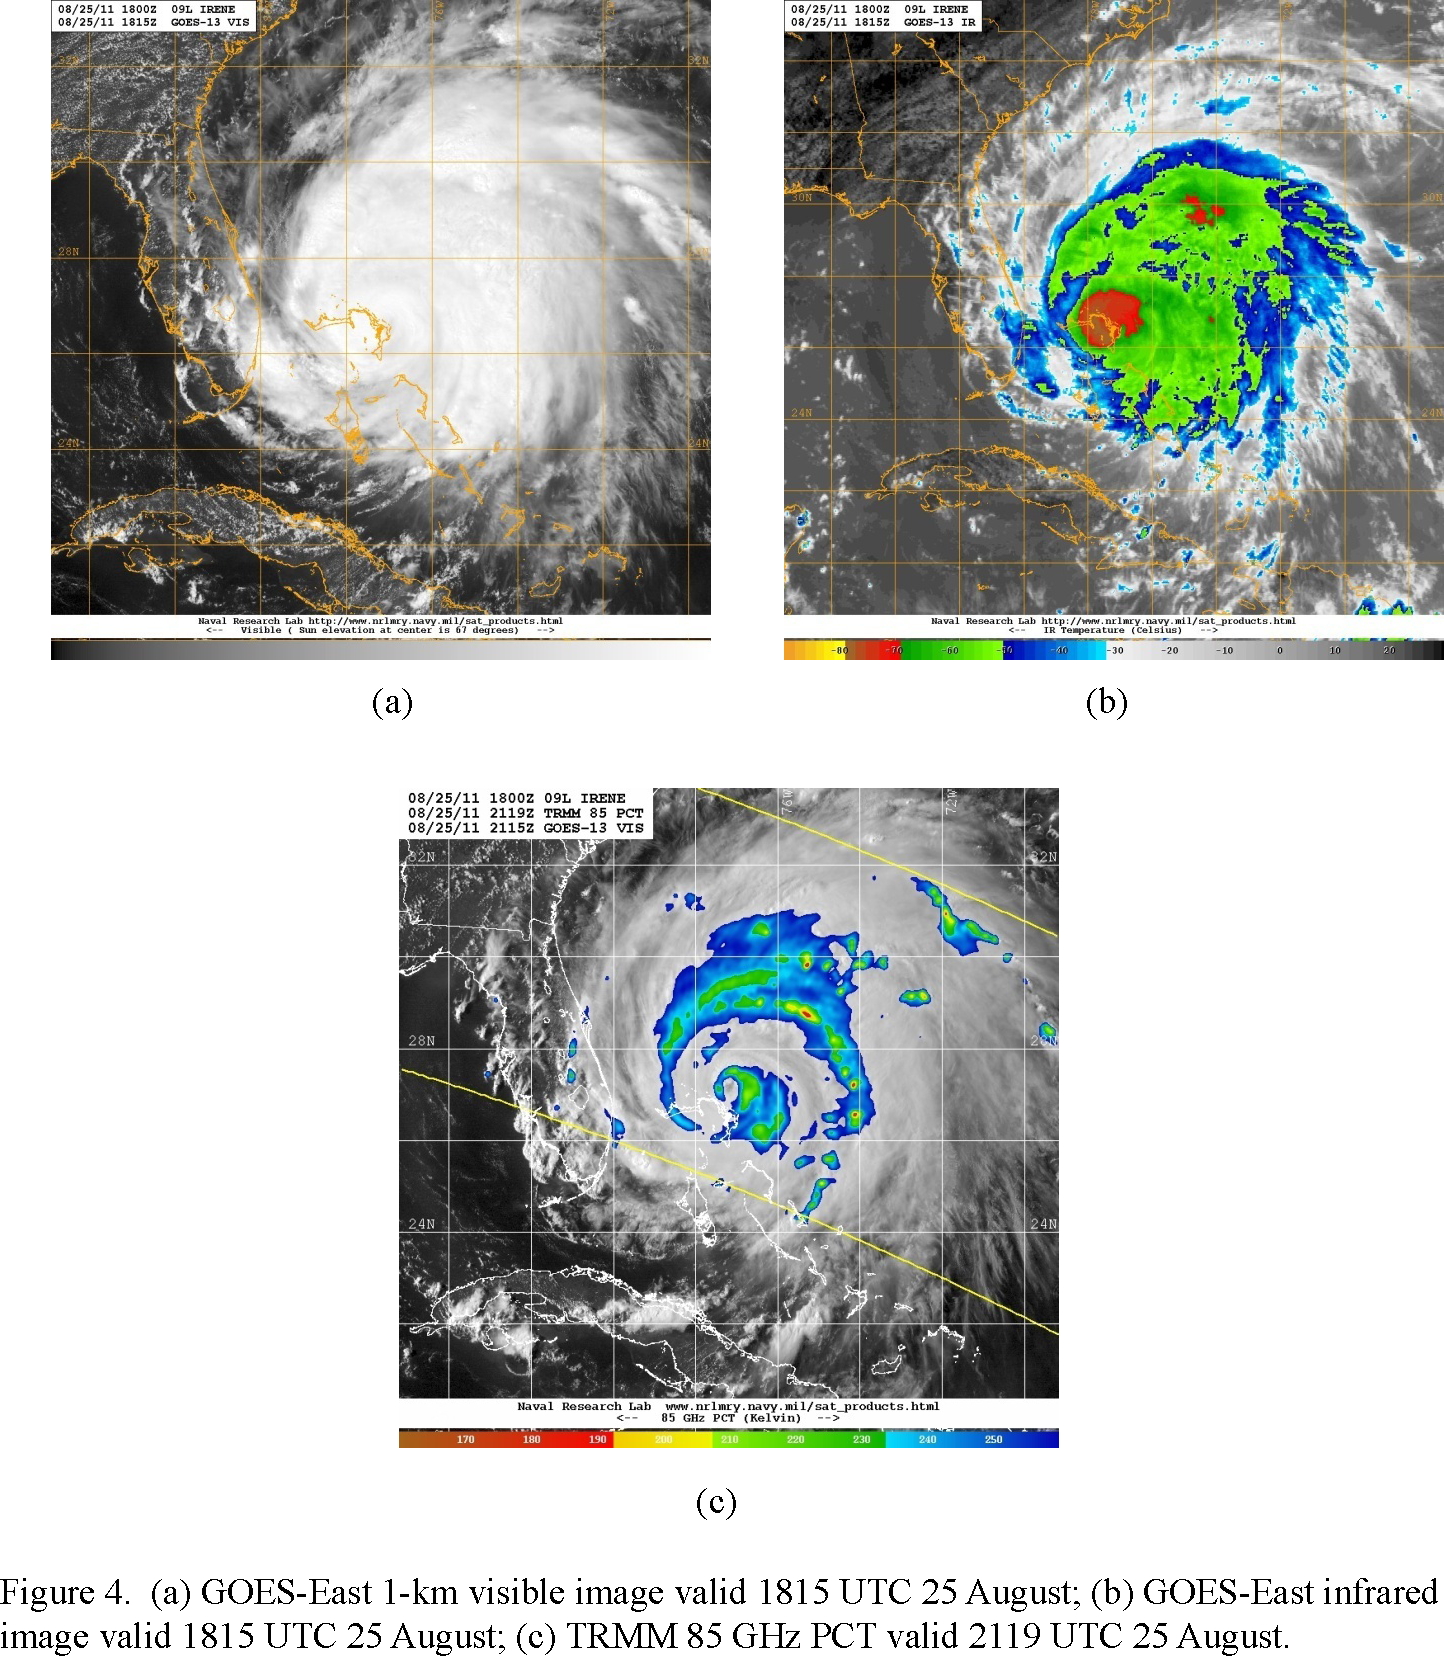
Satellite imagery of the environment of Irene shows that it is in relatively moist lower-tropospheric humidity (Fig. 2), and the 850-200 hPa CIMSS-derived shear is of moderate intensity (~15 kt) and from the southwest (Fig. 3). Therefore the environment is presumed to be moderately favorable for intensification, or at least not detrimental. Visible and infrared satellite imagery (Figs. 4a-b) continues to show a well-defined cloud shield. The bulk of the cloud cover extends to the northeast and that, coupled with the appearance of sharp IR gradients on the southwest side of the storm, is also indicative of southwesterly shear. Cloud top temperatures have warmed a bit from the previous day, suggesting that convective vigor has decreased in the past 24 h. A microwave overpass (Fig 4c) shows some ice scattering within the core, and a broad band of ice scattering extending around the storm on the north and east side ~ 150-200 km from the center.
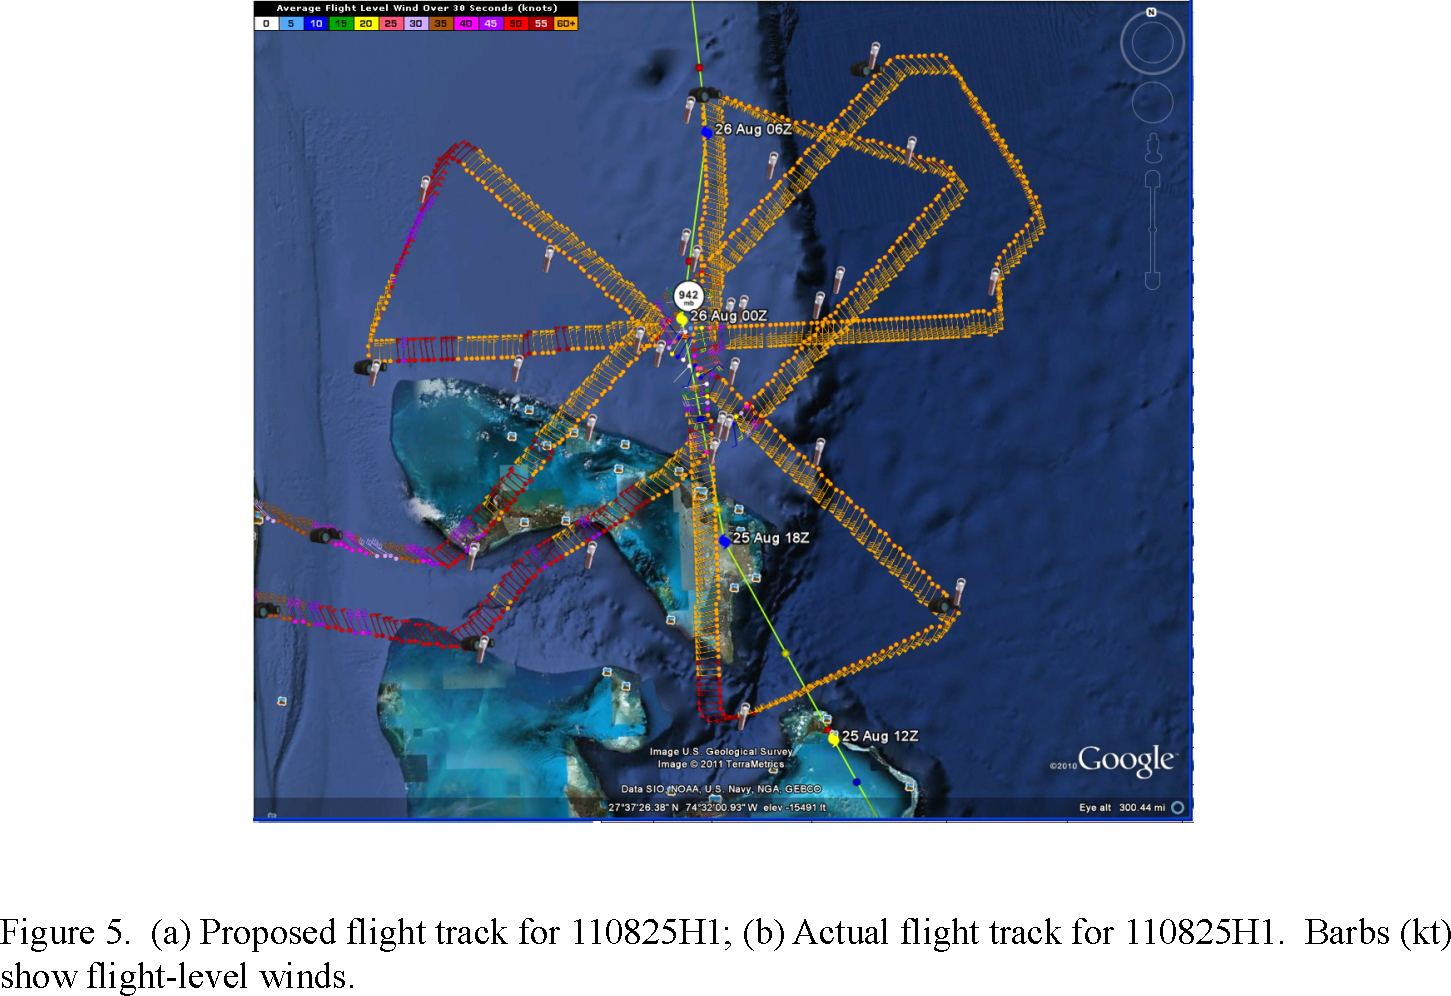
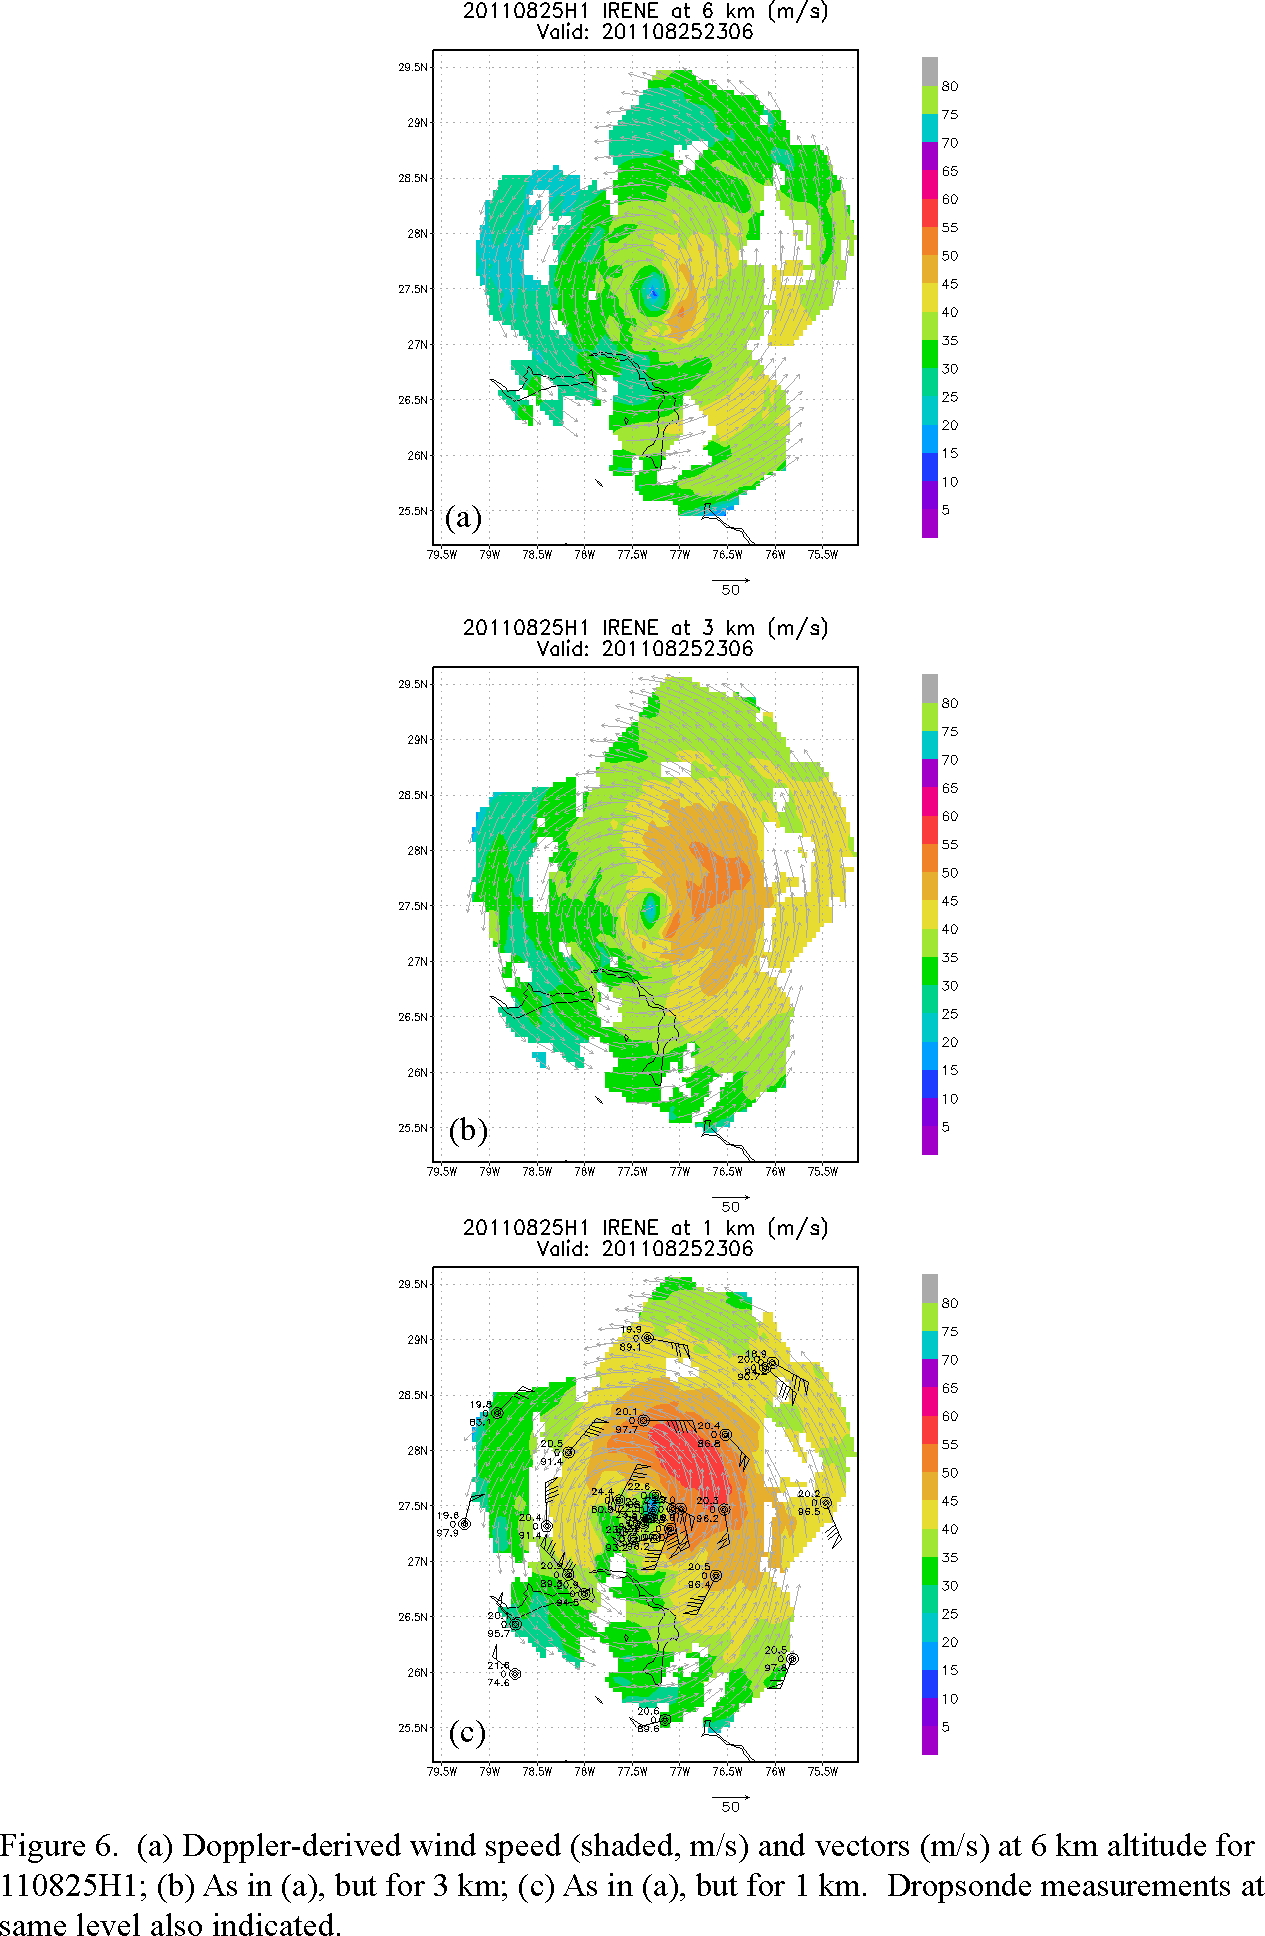
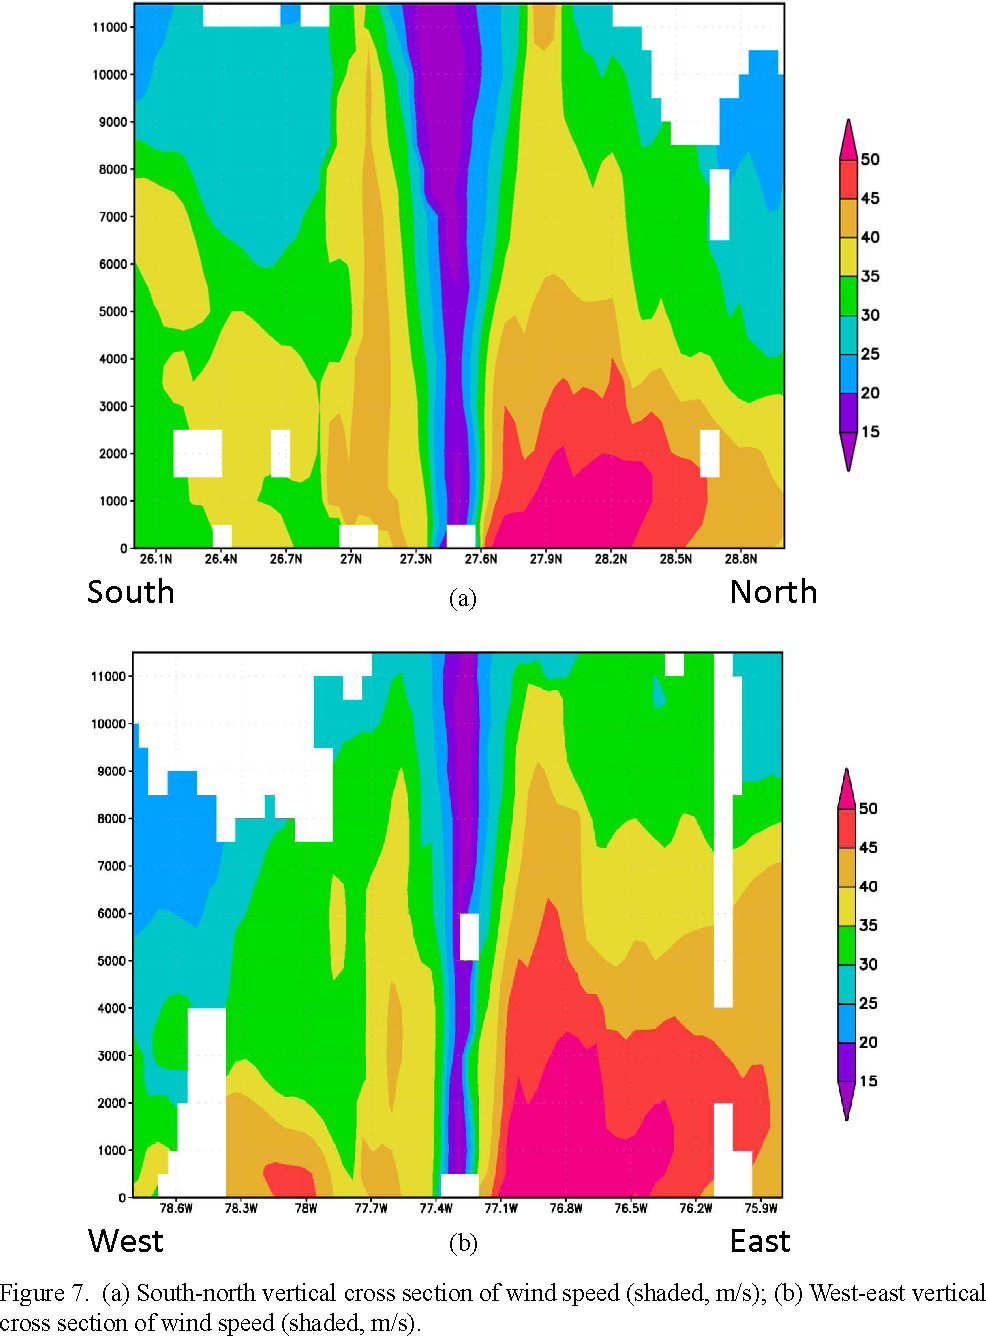
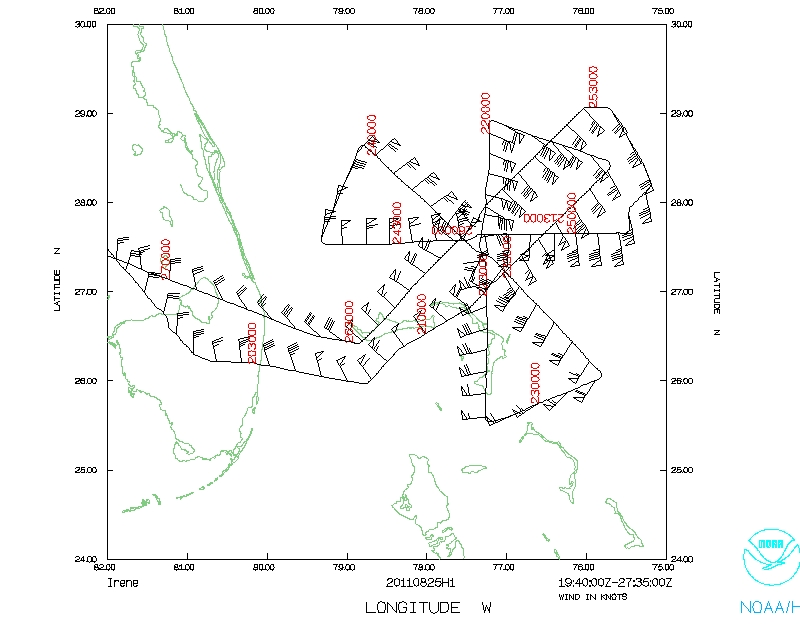
Takeoff was at 1949 UTC from MacDill AFB. The pattern was flown as planned (Fig. 5), except at the end the aircraft rotated 45 degrees on the east side of the storm before making the final pass from northeast-southwest. This enabled a pass along the same azimuth separated by ~ 4 h. Preliminary radar analyses (Fig. 6) show that the peak winds of 55 m/s at 1-km altitude were located on the northeast side of the storm. This asymmetry rotated slightly upwind with height, becoming situated on the southeast side of the storm by 6 km. Dropsonde measurements at 1 km showed relative humidity generally > 90%, except for the far northwest and southwest points, where RH values of 83 and 75% were seen, respectively. Vertical cross sections of wind speed taken through the storm center (Fig. 7) again show a highly asymmetric storm, with peak wind speeds of > 50 m/s on the north and east sides. An inner core of winds > 35 m/s extends up to 11 km on all sides of the storm, and a secondary maximum appear on the south and west side about 100 km from the storm center. Peak SFMR (flight-level) winds of ~ 80 kt (100 kt) were seen on the east side of the storm. The central pressure measured from the dropsondes was ~950 hPa.
Mission Evaluation:
The mission did accomplish the objectives. Radar analyses were completed and transmitted, with 29 dropsondes released. A complex and interesting structure was documented - would the winds eventually increase as the pressure appears to have fallen?
Problems :
There were no major problems, except for a few fast fall sondes that eventually ended up OK. The Mac laptops did have some problems freezing up during the flight, but by the end of the flight they were operating well.
Rob Rogers
Sept. 7, 2011
 Track |
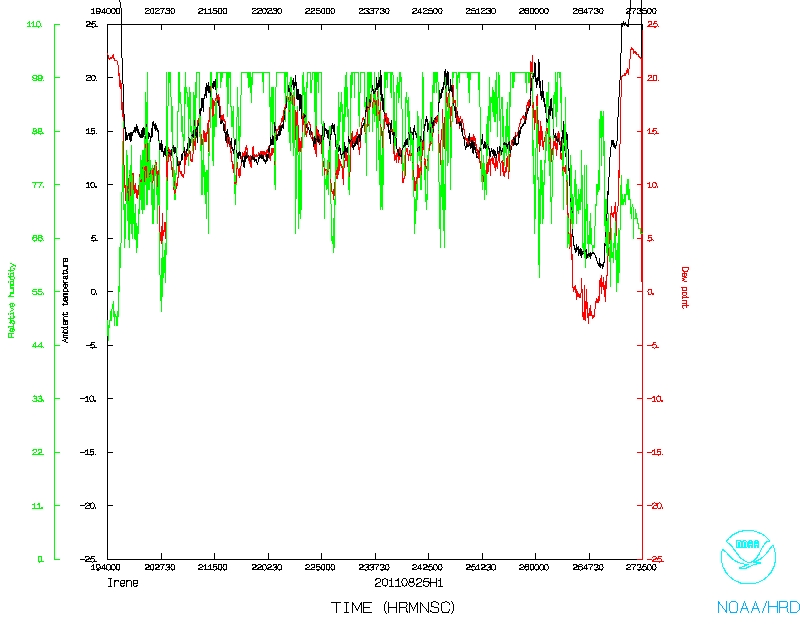 Temperature and Moisture |
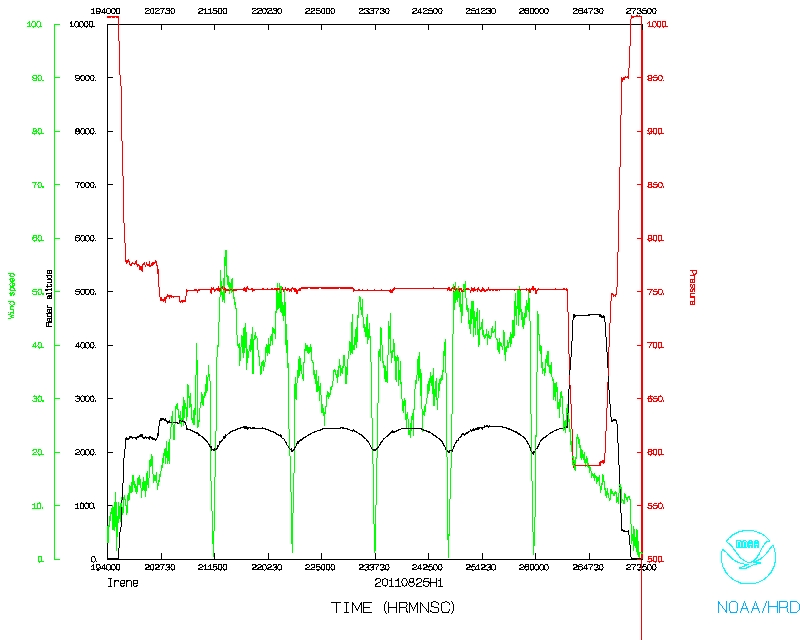 Wind and Atlitude |
Note: Vertical winds are suspect. Use with caution.
1 second data |
NetCDF flight level data |
serial data |
SFMR (NetCDF)
F Dir log | Error Summary | LPS log | Radar log | Dropsonde log