Mission Summary
20050808N1 Aircraft 49RF
SALEX Flight 2005 (Irene)
| Aircraft Crew (49RF)
|
| Aircraft Commander | Michele Finn |
| Pilots | Jeff Hagan
Will Odell |
| Project Manager | Jack Parrish |
| Flight Meteorologist | Barry Damiano |
| Equipment Specialist | Gordon Kitson |
| Electronics Technician | Dave Brogan |
| Electronics Technician | Dale Carpenter |
| Electronics Technician | Ray Tong |
| Scientific Crew (49RF) |
| Sonde Scientist | Jason Dunion |
SALEX mission summary
Mission Plan :
NOAA 49RF will fly a Saharan Air Layer Experiment around Tropical Storm
Irene as part of IFEX. The G-IV will leave Barbados at 1450 UTC and will
recover back at Barbados at 2145 UTC. The flight track will take the
G-IV into an area of 'newer' Saharan Air Layer (SAL) air east of Irene,
followed by a traverse around the southern semicircle of the storm.
Finally, two flight legs will sample regions of 'older' SAL air west of
Irene during the return to Barbados (Fig. 1). 23 dropwindsondes will be
launched during the mission.
Fig. 1: Flight track (green line) for SALEX mission 20050808N. The GPS
dropsonde points (23 total) are indicated by green circles.
Mission Summary :
a) Synoptic Situation
TD #9 emerged from the coast of North Africa as a disorganized AEW on 01
August (Fig. 2). Figure 2 also shows that a very large SAL outbreak was
located to the north and west of this system at this time. As the system
moved across the basin over the next several days, its northwest heading
brought it into the SAL and it struggled to intensify. The previous
day's mission (20050807N) successfully circumnavigated Irene, sampling two
distinct air masses on the west and east sides of the storm. Data from
this flight clearly showed that Irene was surrounded by dry air and
strong mid-level winds associated with the SAL, which may partly explain
why the system was struggling.
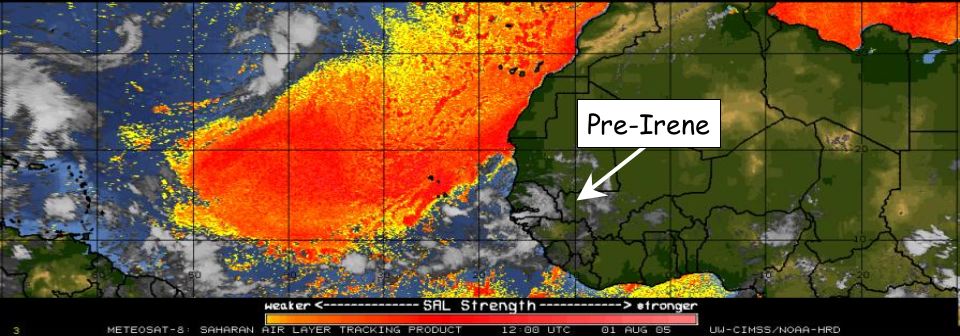
Fig. 2: SAL imagery (01 August 1200 UTC) showing a large SAL outbreak
(yellow to red shading) north and west of the AEW that eventually
developed into Hurricane Irene.
On the morning of the 20050808N mission, Irene was located at ~22.4°N
50.7°W and had been downgraded to a 30 kt tropical depression. Irene's
low-level circulation was now located well west of its deeper convection and
the circulation was becoming increasingly exposed.
b) Mission Specifics
The flight plan was designed to investigate several areas of SAL air
around Irene, including 'older Saharan air to its west (Fig. 3, SAL 2)
and a 'new' SAL outbreak that was impinging on the inner core region from
the east (Fig. 3, SAL 3). The more recent SAL outbreak (Fig. 3, SAL 3)
had substantial dust associated with it, and was evident in GOES visible
imagery (Fig. 4, left).
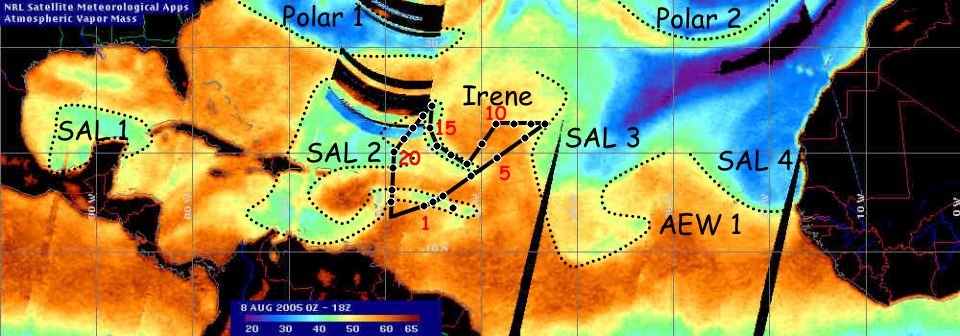
Fig. 3: Mosaic of total precipitable water (TPW) from the constellation
of SSM/I satellites (1800 UTC 08 August 2005). Regions with TPW values
of <45 mm (dotted lines) indicate dry air in the low to mid-levels of the
atmosphere (~600-925 hPa). Four distinct areas of dry SAL air (SAL 1, 2,
3, & 4) and two areas of dry polar air (Polar 1 & 2) are indicated in the
imagery. The G-IV flight track and dropsonde points are overlaid on the
image. Irene was located at ~22.4N 50.7W at this time. Imagery courtesy
of NRL-Monterey.
Takeoff was at 1450 UTC from Barbados. The flight plan called for an
optimal flight level of 41,000-45,000 ft and required that all
dropwindsondes be transmitted in real-time, so that the humidity data
from the sondes could be included in parallel runs of the NOAA GFS model.
An initial traverse across and into the SAL outbreak located east of
Irene (Fig. 3, SAL 3; Fig. 4, right) was made. The easternmost drop
(drop 7) exhibited very dry air in the 550-850 hPa layer, with ~25% RH at
700 hPa. The following east-west leg investigated how far the SAL had
encroached upon the system from the east (drops 7-10). These
dropwindsondes indicated that the SAL had advanced as far west as drop
#10, although the dry air was 'hidden' beneath the cirrus clouds
associated with Irene's convection.
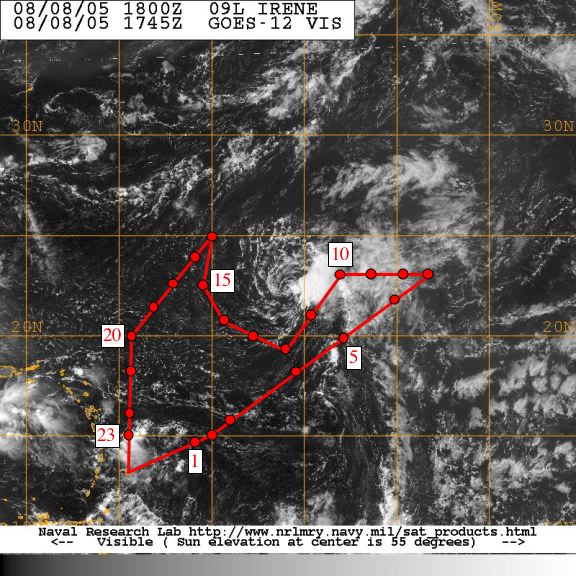
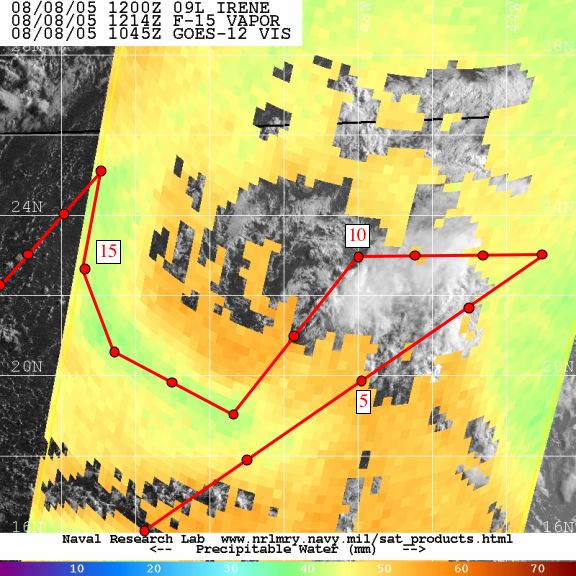
Fig. 4: Visible imagery (left) and total precipitable water (TPW) imagery
(right) showing Tropical Depression Irene (1745 and 1214 UTC 08 August
2005). The SAL's dry, dusty air is evident in the visible image east of
Irene (seen as a milky white haze) and is indicated by values of <45 mm
(green shading) in the TPW image. The G-IV flight track and dropsonde
points are overlaid for reference. Imagery courtesy of NRL-Monterey.
The next few legs targeted an area of 'older' SAL air (Fig. 3, SAL 2)
along Irene's southern and western flanks [(drops 12-16), Fig. 4]. This
dry air appears to have been wrapping into Irene's circulation from the
west. Earlier in the mission, an updated SSM/I overpass provided by
NRL-Monterey indicated that the region of low (<45 mm, green shading)
total precipitable water (TPW) in Irene's southwest quadrant was farther
south than anticipated. It quickly became clear that the original flight
track and dropsonde points (not shown) were too far north and would miss
this arc of dry SAL air. A request was put in to the flight director,
requesting a ~1-2 degree shift to the south and west of this portion of
the flight track (drop points 12-16). Flight was able to get these track
changes approved through New York Center and Fig. 4 (right) shows how
well this corrected track corresponds to the arc of low TPW (<45 mm,
green shading) in the southwest quadrant of Irene. These drops (drops
12-16) indicated ~15-30% RH in the low to mid-levels of the atmosphere in
this region southwest of the center of circulation. Additionally, a
contrasting atmosphere was evident out of the right (looking northeast)
versus left (looking southwest) windows of the aircraft just after drop
14 (Fig. 5). The right side (northeast view) showed a clear blue
atmosphere with scattered low cumulus that reflected Irene's exposed
low-level circulation (Fig. 5, right). However, the left side (southwest
view) clearly depicted vast amounts of Saharan dust (seen as a milky
white haze) far below the aircraft flight level for as far as the eye
could see (Fig. 5, left). There were undoubtedly substantially higher
concentrations of dust to the left of the aircraft at this time.
However, it is also likely that because the Saharan dust appears to be a
more effective forward scatterer of sunlight, the position of the
aircraft probably made the dust appear more pronounced out of
the left side of the aircraft at this time.
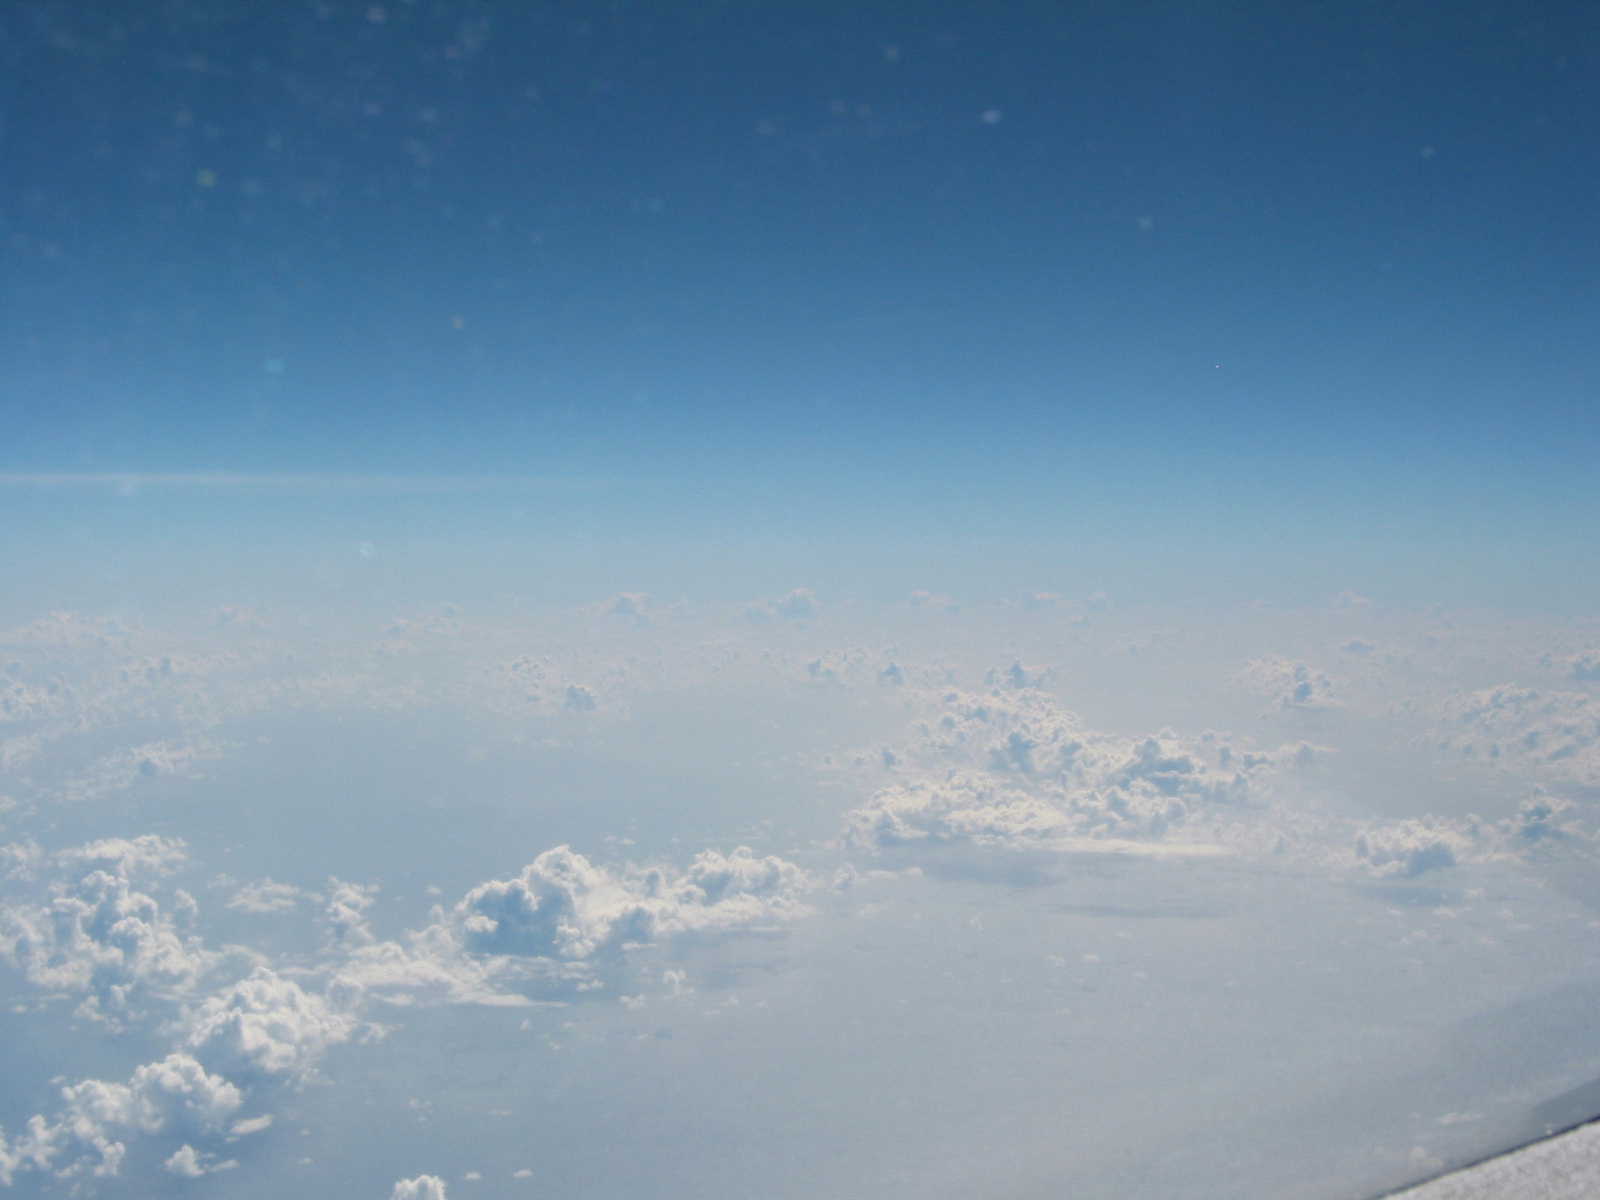
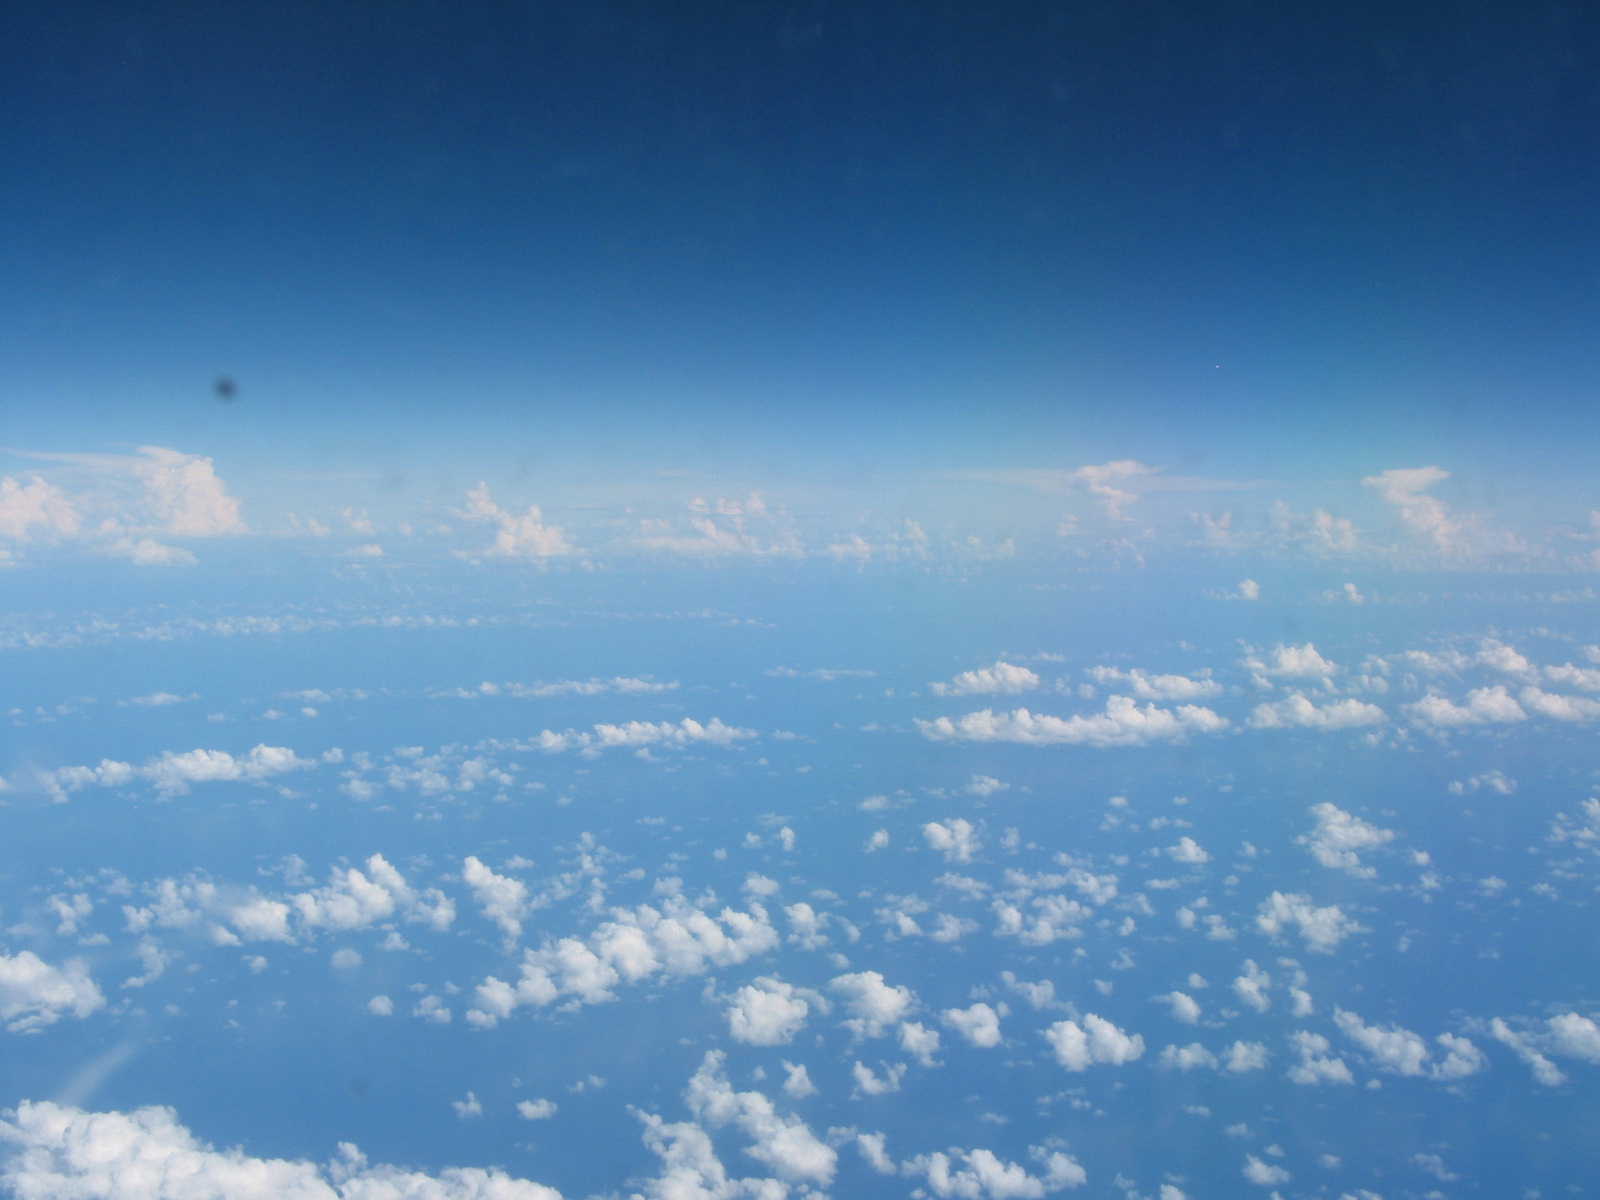
Fig. 5: Photographs taken from the G-IV (from ~45,000 ft) at 1917 UTC, a
few minutes after drop 14. The photos correspond to the views from the
left and right sides of the aircraft respectively. Low-level arcing
clouds associated with Tropical Depression Irene and a relatively clear
atmosphere could be seen out of the right side of the aircraft. In
contrast, substantial amounts of dust associated with the SAL could be
seen out of the left side of the aircraft.
The final two legs of the flight track (drops 16-20 and drops 20-23) took
the G-IV over 'older' SAL air (Fig. 3, SAL 2) en route back to Barbados.
Here, values of RH were as low as 10-20% in the 600-850 hPa layer.
Problems :
There were no major problems related to this flight. Even though vintage
2000 GPS dropsondes were used, only one dropwindsonde failed out of the
24 that were dropped. This flight would definitely have been more
manageable with two scientists onboard. As it was, there were probably
too many tasks to be effectively handled by one scientist. These
included utilizing satellite imagery obtained via the G-IV's high speed
internet to help guide changes to the flight track and several of the GPS
dropsonde points during the mission, as well as working up/transmitting
all of the dropsondes in real-time.
Jason Dunion
Principal Investigator
SALEX MISSION PLAN
IRENE
Aircraft: N49RF
Altitude: FL410-450
Takeoff: 08/1450Z
|
| Drop #
| Lat
(degrees)
| Lon
(degrees)
| UTC time
|
| 1 | 14.502 | 56.168 | 1520
|
| 2 | 15.001 | 55.004 | 1530
|
| 3 | 15.998 | 53.619 | 1544
|
| 4 | 17.835 | 51.003 | 1610
|
| 5 | 19.914 | 47.912 | 1640
|
| 6 | 21.656 | 45.192 | 1705
|
| 7 | 23.030 | 43.225 | 1724
|
| 8 | 23.017 | 44.682 | 1736
|
| 9 | 23.017 | 46.338 | 1748
|
| 10 | 22.957 | 48.009 | 1802
|
| 11 | 20.999 | 49.782 | 1824
|
| 12 | 19.065 | 51.564 | 1845
|
| 13 | 19.758 | 52.998 | 1858
|
| 14 | 20.527 | 54.496 | 1911
|
| 15 | 22.516 | 55.481 | 1930
|
| 16 | 24.852 | 55.171 | 1950
|
| 17 | 23.998 | 55.832 | 1959
|
| 18 | 22.500 | 57.046 | 2015
|
| 19 | 21.506 | 57.833 | 2025
|
| 20 | 19.983 | 58.990 | 2040
|
| 21 | 17.992 | 59.146 | 2057
|
| 22 | 15.991 | 59.288 | 2113
|
| 23 | 14.991 | 59.358 | 2121
|
PDF of drops
Page last updated January 24, 2006
Return to Mission page.