Fig. 1: Flight track (green line) for SALEX mission 050807N. The GPS
dropsonde points (26 total) are indicated by green circles.
| Scientific Crew (49RF) | |
| Sonde Scientist | Jason Dunion |
| Aircraft Crew (49RF) | |
| Aircraft Commander | Michele Finn |
| Pilots | Jeff Hagan Will Odell |
| Project Manager | Jack Parrish |
| Flight Meteorologist | Barry Damiano |
| Equipment Specialist | Gordon Kitson |
| Electronics Technician | Dave Brogan |
| Electronics Technician | Dale Carpenter |
| Electronics Technician | Ray Tong |
Mission Plan :
NOAA 49RF will fly a Saharan Air Layer Experiment around Tropical Depression #9 as part of IFEX. The G-IV will leave Barbados at 1450 UTC and will recover back at Barbados at 2200 UTC. The flight track will take the G-IV on a clockwise circumnavigation of the TC and is shown in Fig. 1, along with the 26 dropwindsonde points.
Fig. 1: Flight track (green line) for SALEX mission 050807N. The GPS
dropsonde points (26 total) are indicated by green circles.
Mission Summary :
a) Synoptic Situation
TD #9 emerged from the coast of North Africa as a disorganized AEW on 01
August (Fig. 2). Figure 2 also shows that a very large Saharan Air Layer
(SAL) outbreak was located to the north and west of this system at this
time. As the system moved across the basin over the next several days,
its northwest heading brought it into the SAL and it struggled to
intensify. On 05 August, several of the forecast models were suggesting
that the system might recurve out to sea before it got into range for
SALEX. However, by early morning hours of 06 August, it was clear it
would be in range for SALEX and the G-IV was deployed to Barbados.
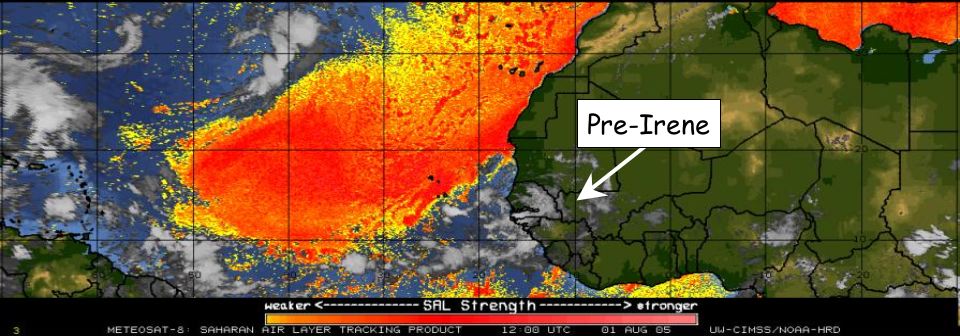
Fig. 2: SAL imagery (01 August 1200 UTC) showing a large SAL outbreak
(yellow to red shading) north and west of the AEW that eventually
developed into Hurricane Irene.
On the morning of the mission, TD #9 (located at ~20.5°N 45.5°W) was upgraded to Tropical Storm Irene (35 kt)- the earliest forming 'I' storm on record. Most of Irene's deeper convection was located well east of its low-level center and it was on the southern fringes of 20-30 kt of northwesterly shear (Fig. 3, left). This strong shear was being enhanced by an upper-level cold low that was located to the north of Irene (~29.0N 41.0W) and was easily discernable using mid to upper-level water vapor winds from UW-CIMSS (Fig. 3, right).
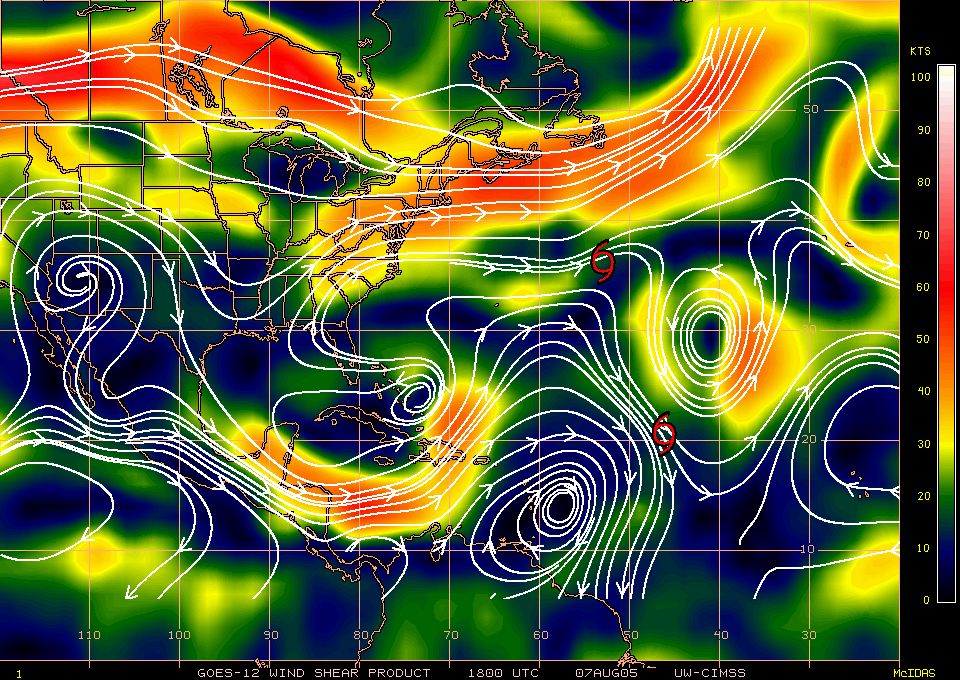
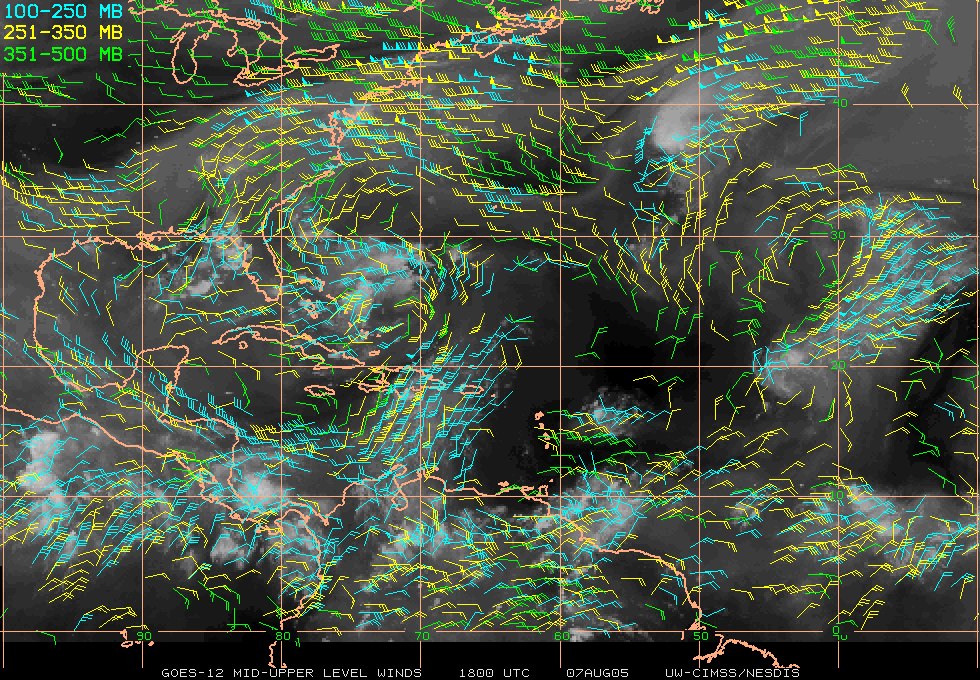
Fig. 3: Plots of (left) vertical wind shear (magnitude and vector) and
(right) middle to upper-level water vapor winds (07 August 1800 UTC).
Irene was located at ~21.0N 47.0W at this time. Images courtesy of UW/CIMSS.
b) Mission Specifics
The flight plan was designed to investigate several areas of SAL air around
Irene, including 'older' Saharan air to its west (Fig. 4, SAL 2) and a
'new' SAL outbreak that was impinging on the inner core region from the
east (Fig. 4, SAL 3). The more recent SAL outbreak (SAL 3) had
substantial dust associated with it, and was evident in GOES visible
imagery (Fig. 5, left). The flight plan called for a clockwise
circumnavigation of the storm at an optimal flight level of 41,000-45,000
ft and required that all dropwindsondes be transmitted in real-time, so
that the humidity data from the sondes could be included in parallel runs
of the NOAA GFS model.
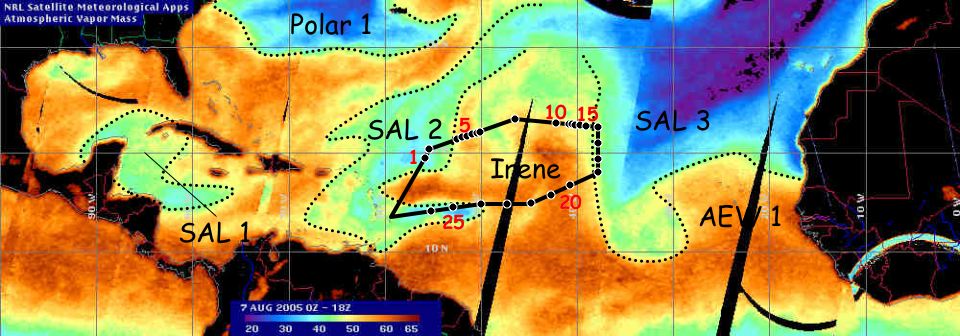
Fig. 4: Mosaic of total precipitable water (TPW) from the constellation
of SSM/I satellites (1800 UTC 07 August 2005). Regions where TPW values
of <45 mm (dotted lines) indicate dry air in the low to mid-levels of the
atmosphere (~600-925 hPa). Three distinct areas of dry SAL air (SAL 1,
2, & 3) and one area of dry polar air (Polar 1) are indicated in the
imagery. The G-IV flight track and dropsonde points are overlaid on the
imagery. Irene was located at ~21.0N 47.0W at this time. Imagery
courtesy of NRL-Monterey.
Takeoff was at 1450 UTC from Barbados and it quickly became apparent that the region west and southwest of Irene contained SAL air (Fig. 4, SAL 2). The low to mid-level moisture for drops 1-2 and 6-8 were ~10-30% RH from ~600-850 hPa and not until drop 9 did these levels of the atmosphere moisten-up significantly. The areas of low humidity corresponded extremely well with low values (<45 mm, green to blue shading) of total precipitable water (TPW) from the constellation of SSM/I satellites (Fig. 4 and Fig. 5, right).
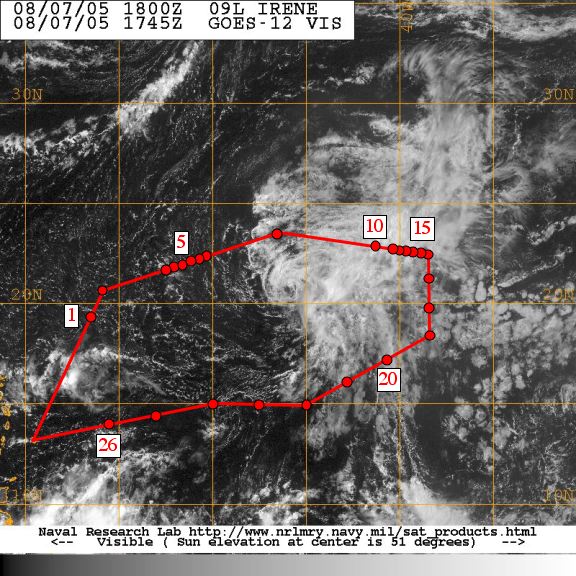
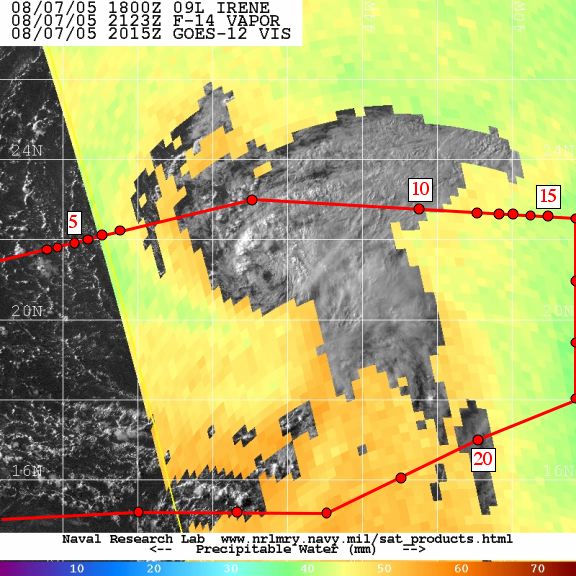
Fig. 5: Visible imagery (left) and total precipitable water (TPW) imagery
(right) showing Tropical Storm Irene. The SAL's dry, dusty air is
evident in the visible image east of Irene (seen as a milky haze) and is
indicated by values of <45 mm (green shading) in the TPW image. The G-IV
flight track and dropsonde points are overlaid for reference. Imagery
courtesy of NRL-Monterey.
A series of drops was then made to capture the moisture gradient along the leading edge of the SAL outbreak that was impinging on Irene from the east (Fig. 4, SAL 3; Fig. 5, right). Drops 10-16 exhibited increasing dryness from northwest to southeast. The easternmost drops in the series (drops 16-19) depicted extremely dry air in the ~450-900 hPa layer and strong winds (25-30 kt) at the 700 hPa level (likely associated with the SAL's mid-level easterly jet).
The final series of drops (20-26) crossed back into the region of the 'old' SAL outbreak (Fig. 4, SAL 2) and indicated that the region was quite dry in the low to middle levels and TPW imagery indicated that this dry SAL air extended as far west as ~68°W.
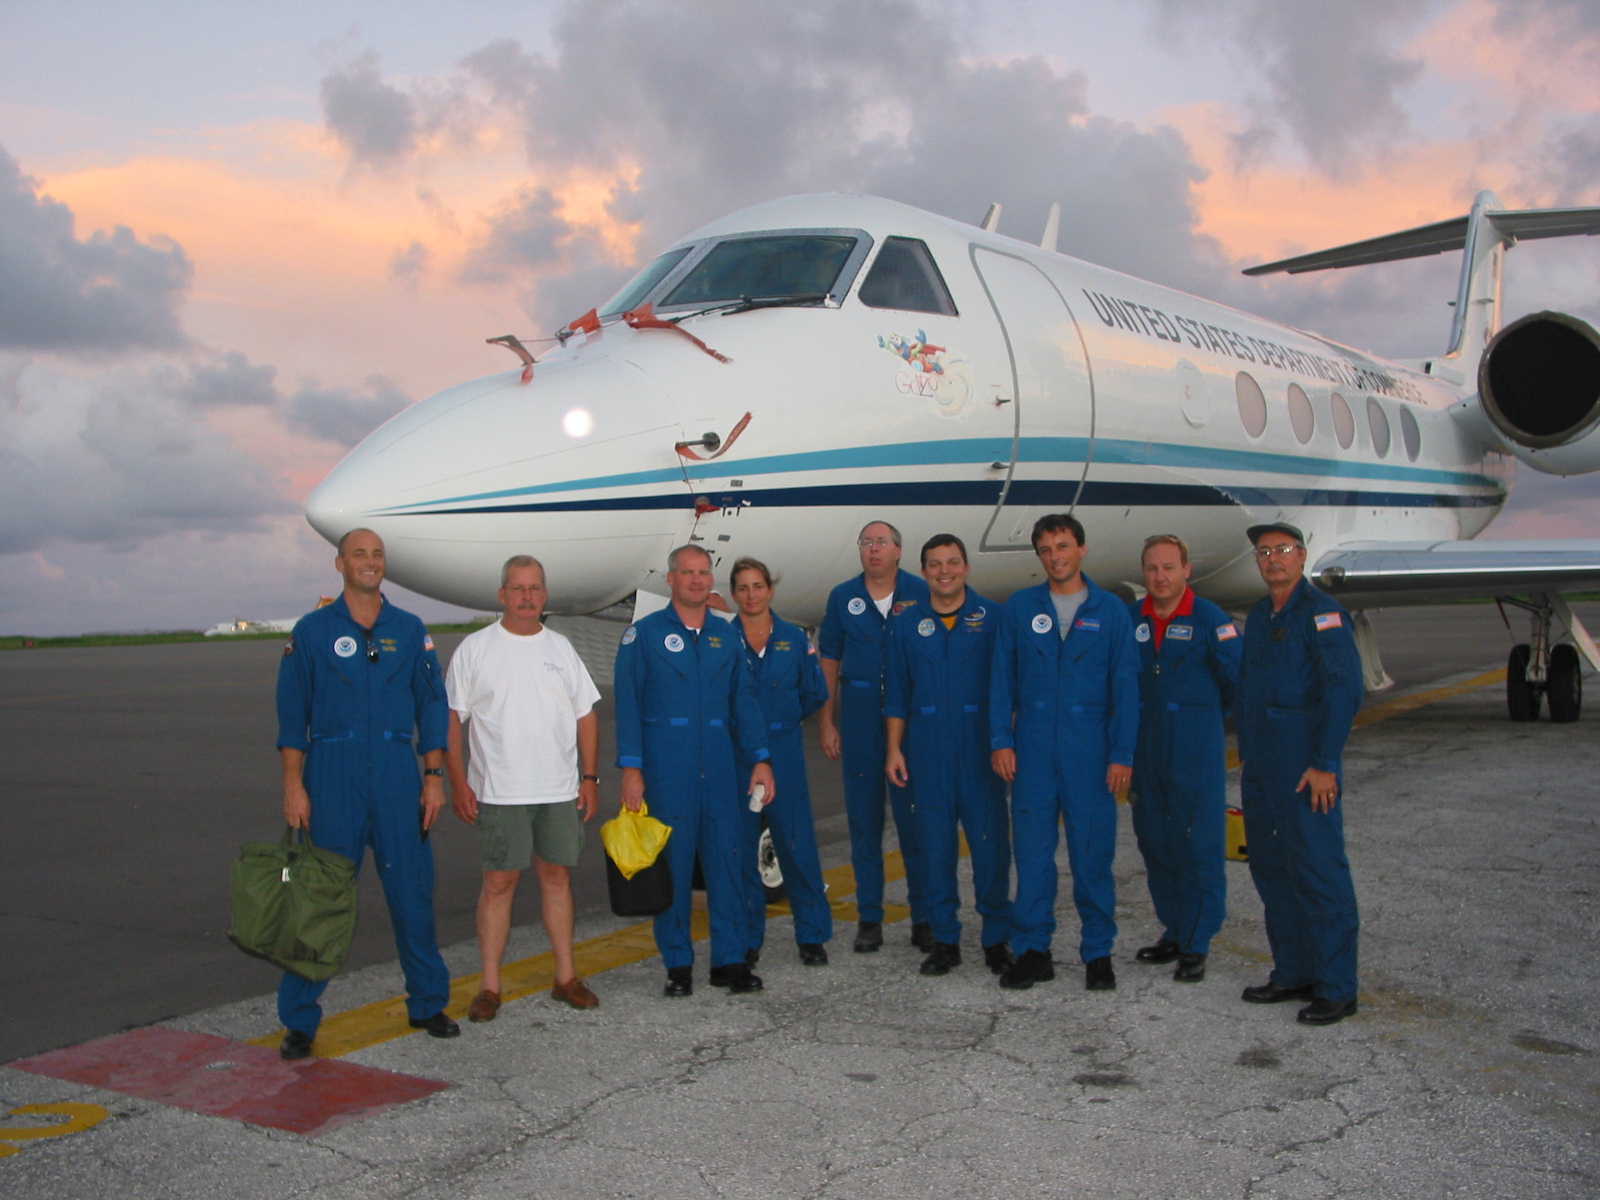
Fig. 6: Photo taken in Barbados after the completion of the first-ever
SALEX mission (20050807N1). From left are: Pilot LT Will Odell, Equipment
Specialist Gordon Kitson, Pilot LCDR Jeff Hagan, Aircraft Commander
Michele Finn, Electronics Technician Dale Carpenter, Electronics Technician
Dave Brogan, Principal Investigator Jason Dunion , Electronics Technician
Ray Tong, and Flight Meteorologist Barry Damiano
(photo taken by Project Manager Jack Parrish)
There were no major problems related to this flight. Even though vintage 2000 GPS dropsondes were used, only 4 sondes failed out of the 30 that were dropped. This flight would definitely have been more manageable with two scientists onboard. As it was, there were probably too many tasks to be effectively handled by one scientist. These included assessing satellite imagery using the G-IV's high speed internet to alter several of the GPS dropsonde points on the fly and working up/transmitting all of the dropsondes in real-time.
Jason Dunion
Principal Investigator
|
Aircraft: N49RF Altitude: FL410-450 Takeoff: 07/1450Z | |||
| Drop # | Lat (degrees) | Lon (degrees) | UTC time |
| 1 | 19.033 | 56.880 | 1542 |
| 2 | 20.981 | 55.958 | 1559 |
| 3 | 21.833 | 52.542 | 1627 |
| 4 | 21.918 | 52.170 | 1630 |
| 5 | 22.003 | 51.791 | 1633 |
| 6 | 22.089 | 51.407 | 1636 |
| 7 | 22.172 | 51.031 | 1639 |
| 8 | 22.254 | 50.654 | 1642 |
| 9 | 22.998 | 46.929 | 1711 |
| 10 | 22.813 | 42.498 | 1744 |
| 11 | 22.722 | 40.990 | 1755 |
| 12 | 22.689 | 40.497 | 1758 |
| 13 | 22.655 | 40.001 | 1802 |
| 14 | 22.619 | 39.501 | 1805 |
| 15 | 22.581 | 39.005 | 1809 |
| 16 | 22.423 | 38.041 | 1816 |
| 17 | 21.006 | 38.000 | 1829 |
| 18 | 19.504 | 38.000 | 1842 |
| 19 | 18.012 | 38.070 | 1854 |
| 20 | 17.000 | 40.997 | 1919 |
| 21 | 16.001 | 43.013 | 1938 |
| 22 | 15.008 | 45.018 | 1956 |
| 23 | 15.013 | 47.512 | 2016 |
| 24 | 14.972 | 50.184 | 2038 |
| 25 | 14.530 | 52.942 | 2100 |
| 26 | 13.998 | 56.004 | 2125 |