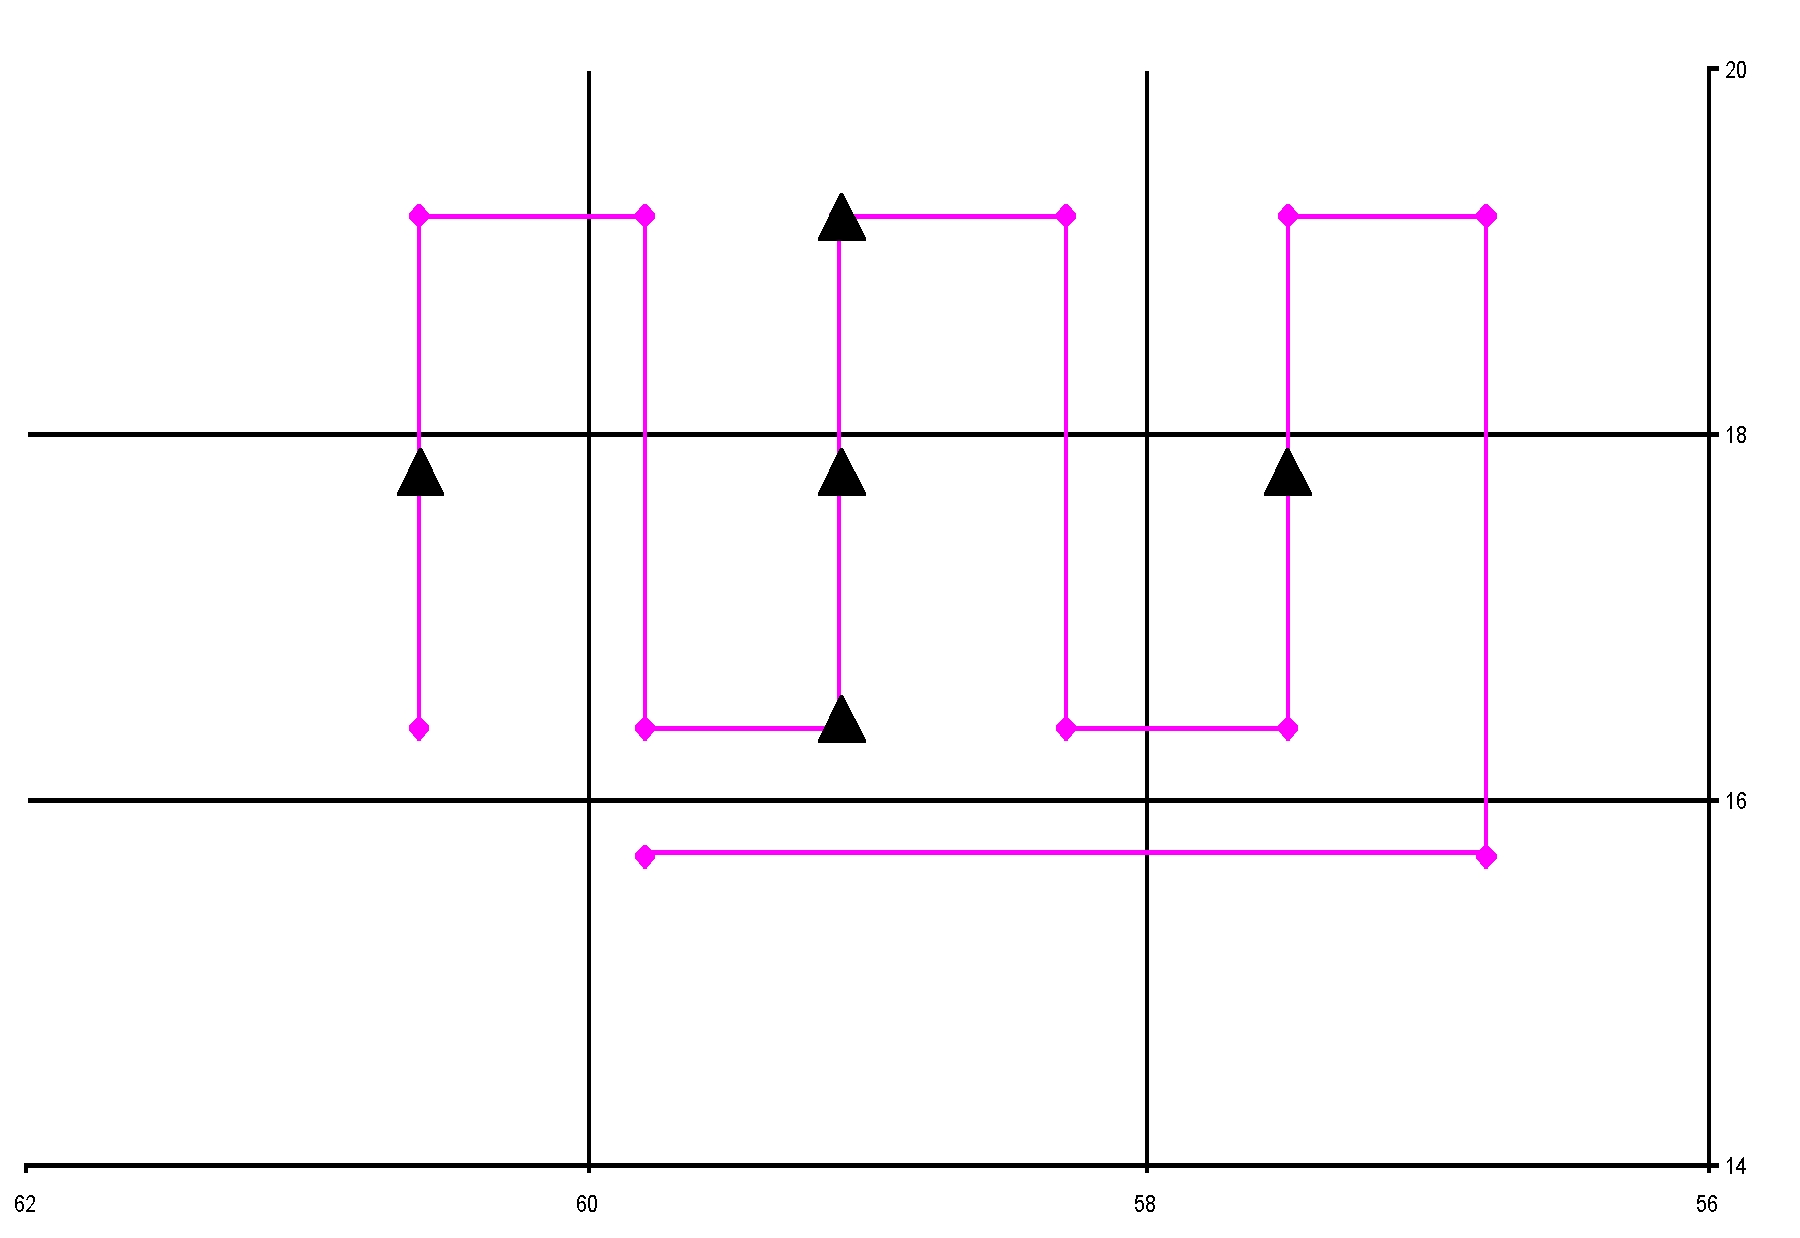
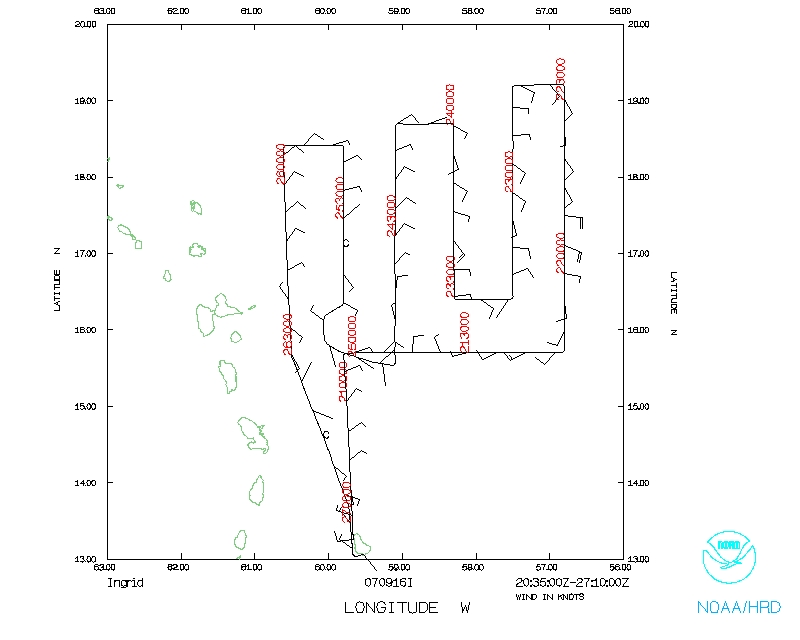
Figure 1. Planned flight pattern (pink line) for 070916I. Black triangles denote locations of GPS drops.
| LPS/Doppler/dropsonde Scientist | Rob Rogers |
| Doppler/dropsonde Scientist | Bob Black |
| Pilots | Barry Choy Mark Nelson |
| Flight Director | Jackie Almeida |
| Navigator | Pete Siegel |
| Flt. Eng. | Dewie Floyd |
| Data Tech | Terry Lynch |
| Elec. Tech | Jeff Smith Damon Sans Souci |
Mission Plan :
This is mission #5 (the third flight of N43RF) in support of the Three-dimensional Doppler Winds experiment. The plan calls for the P-3 to fly a lawnmower pattern (Fig. 1) at 12,000 ft. The north-south legs would be 160 nm in length. We would attempt Doppler analyses on the north-south legs. GPS sondes would be dropped at 80 nm distances from the likely center at the cardinal points.
Mission Summary :
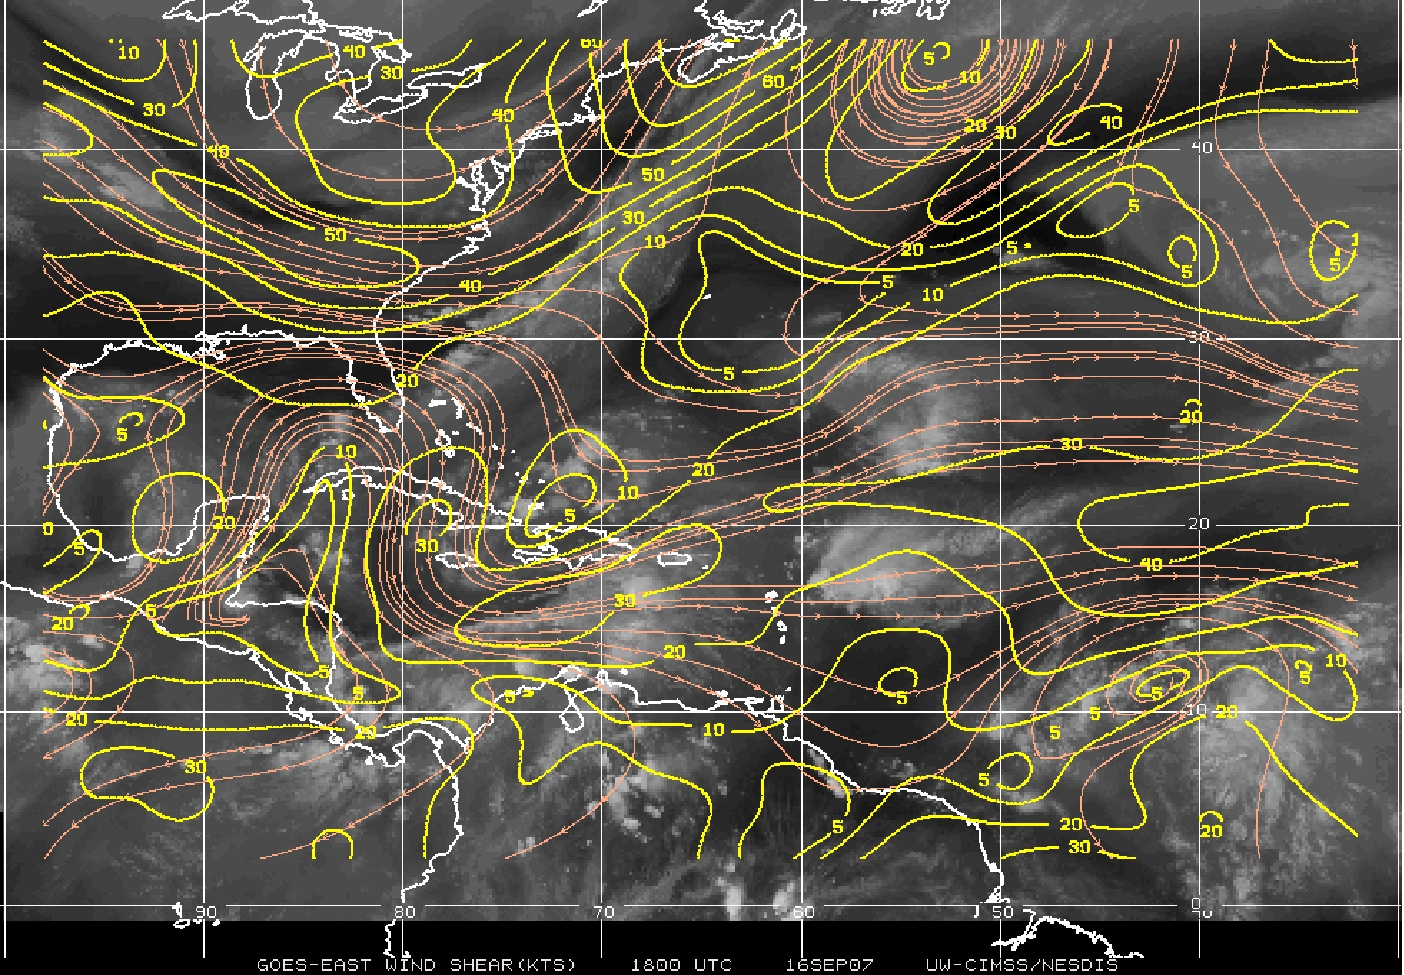
The pattern was flown successfully. Takeoff was at 2029 UTC from Barbados. Because the system was highly sheared, with 850-200 hPa shear values of 20 kt impacting the storm (Fig. 2), there was limited convection that was
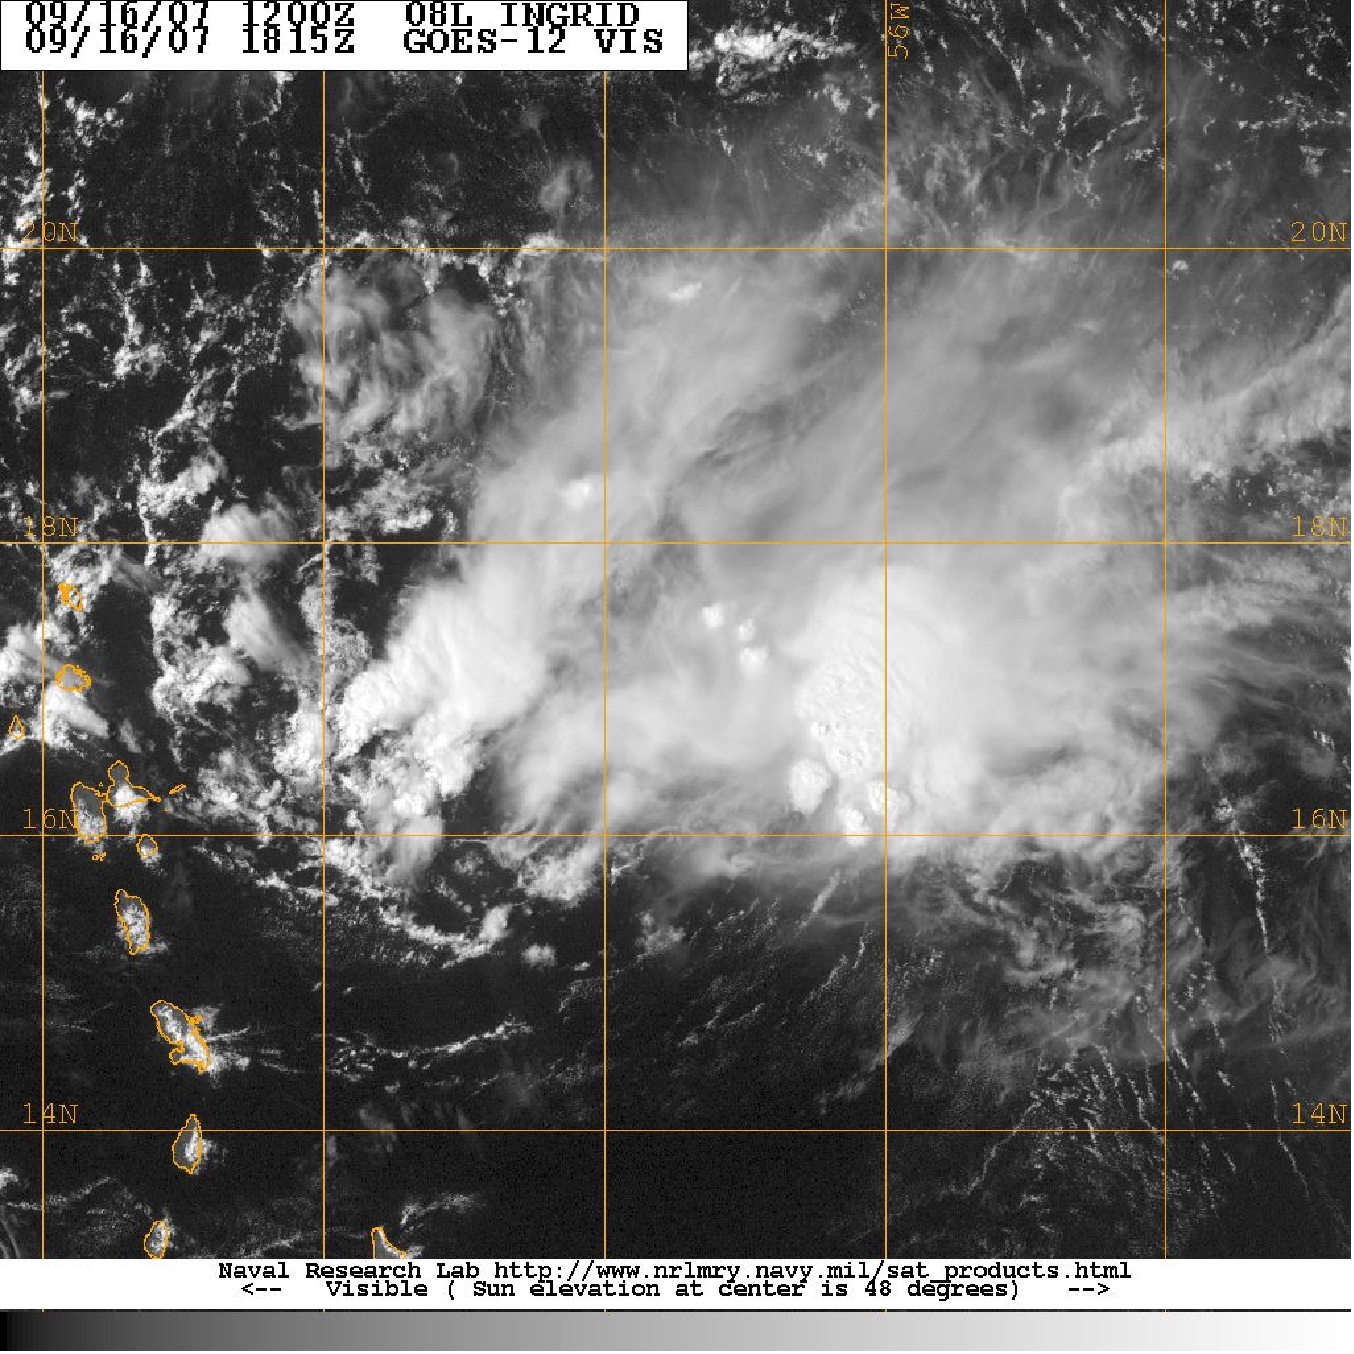
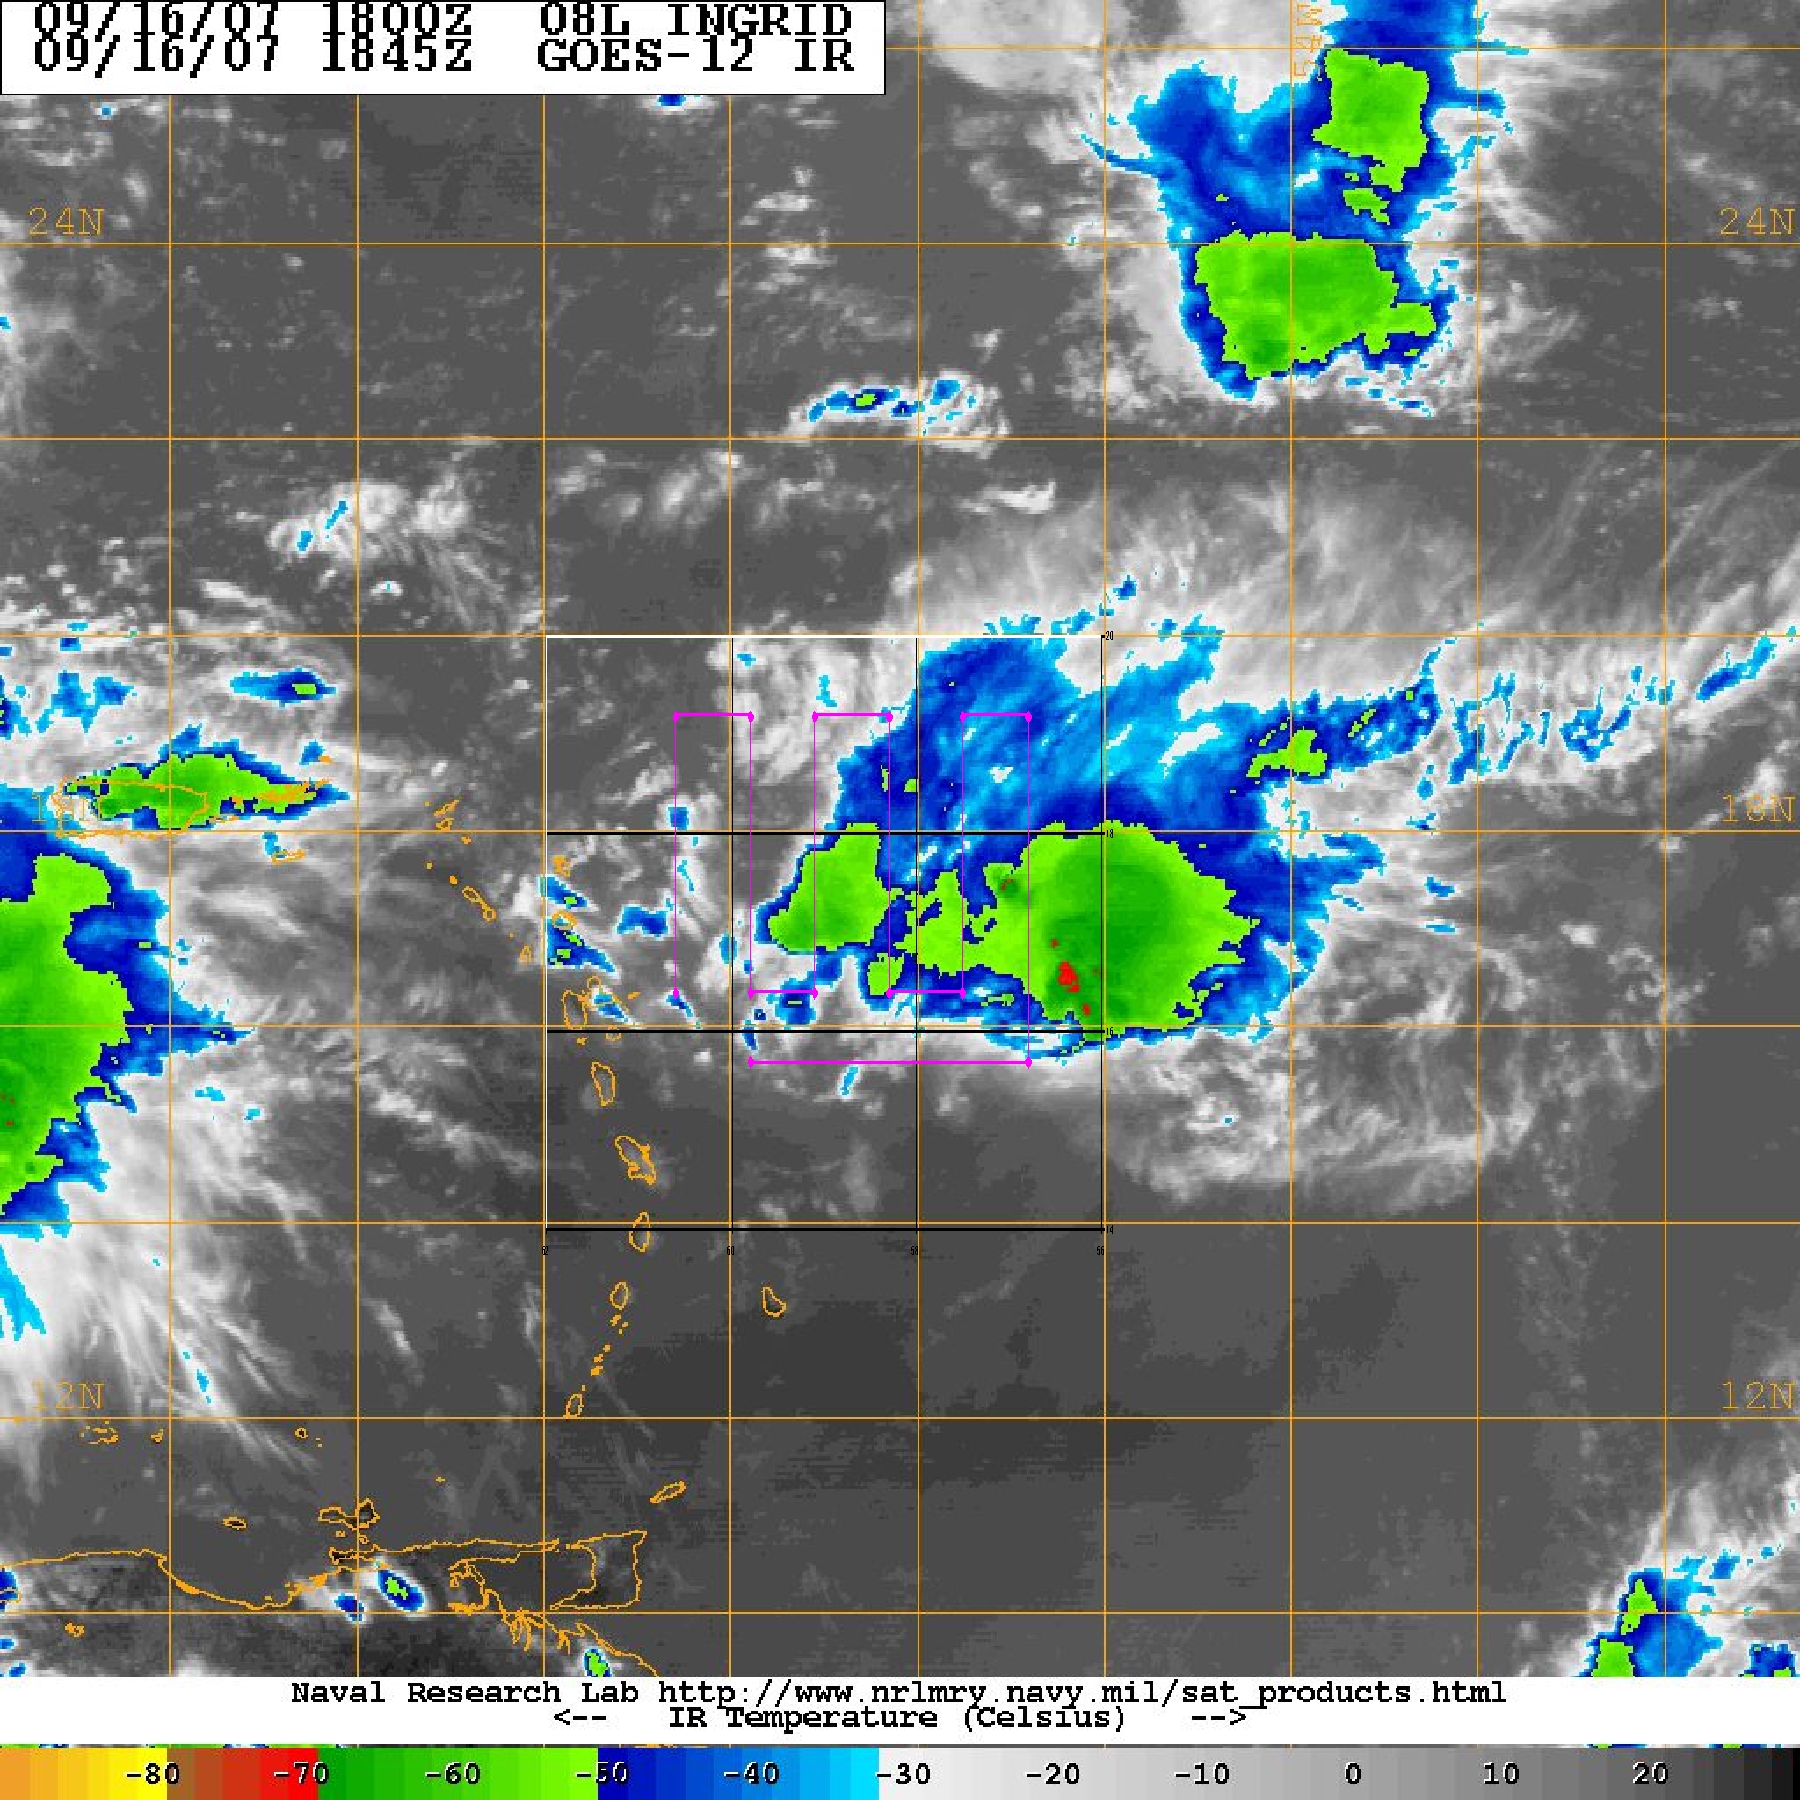
confined well to the east of the center (Fig. 3). Given that the pattern was intended to focus on the expected center location, and what convection existed was well-displaced to the east of the expected center, the pattern was expected to only be able to sample any convection in a limited fashion (Fig. 4).
The center was difficult to find. There was some convection on the south and east side of the system. During the first east-west leg it appeared that the center could only be defined as a shear axis, and this axis was much further south than anticipated (Fig. 5). Because of that, and because of the fact that scatterers were more concentrated there, we modified the pattern by shifting it to the south by half a degree. We did manage to fly around a convective cell, sampling it as we flew around it within about 10-20 nm. It turns out that the convective cell was just an isolated feature within the overall broader, weak circulation.
On some of the south-north legs, in particular the ones on the east side, there were some areas of deep convection (with tops as high as 15 km) evident on the tail radar. From these radar images it was clear that the anvils were being blown to the east, indicating westerly shear impacting these systems. This was consistent with the CIMSS analysis as well (cf. Fig. 2). Peak flight-level winds at 12,000 ft did not exceed 15 kt, while SFMR winds never exceeded 20 kt, except for a few isolated areas within rain cells where the SFMR temporarily rose to 35 kt. Landing was in Barbados at 0310 UTC.
This was a difficult mission to complete the intended objectives, i.e., to collect Doppler radar data for real-time analyses of three-dimensional winds. The complete lack of organization and the general absence of scatterers made completing an analysis very difficult. The winds were very weak, and there was no presence of a circulation at 12,000 ft. This type of case will pose a significant challenge for performing real-time Doppler analyses and ingesting them into a mesoscale data assimilation scheme. Some knowledge could be gained with respect to sampling strategies for these types of systems, i.e., from the standpoint of performing Doppler analyses, is it better to maintain a pattern at the expense of sampling specific convective features, or is it better to temporarily deviate from the pattern in order to more intensively sample a convective feature.
Problems :
There were no major problems with the radar, dropsondes, or SFMR.
Robert Rogers
9/19/07
Mission Data
Flight Data | ||
 Flight track |
 Temperature and Moisture |
 Wind and Atlitude |