Mission Summary
20080911I1 Aircraft 43RF
EMC Tail Doppler Radar Operational Mission
Scientific Crew (43RF)
| Lead Project Scientist | Jason Dunion |
| Workstation Scientist | Mike Black |
| Dropsonde Scientist | Xuejin Zhang
Neal Dorst |
| AXBT Scientist | Ben Jaimes de la Cruz (UMiami) |
Flight Crew (43RF)
| Pilots | Barry Choy
Amelia Ebhardt |
| Flight Director | Marty Mayeaux |
| Navigators | Joe Bishop
Ryan Kidder |
| Flt. Eng. | Dewie Floyd |
| Data Tech | Terry Lynch
Dana Naeher
Jeff Smith
|
| Elec. Tech | Damon Sans Souci |
Mission Plan :
NOAA 43RF will participate in an EMC Tail Doppler Radar mission (with an
option to conduct HRD's TC-Ocean Interaction Experiment) into Hurricane Ike.
The flight called for a rotated figure four pattern with an IP WNW of the
center. The leg lengths were to be ~105 nm flown at 8,000 ft (pressure
altitude) and GPS dropsondes would be launched in the center, in areas with
insufficient scatterers to derive Doppler winds, in selected locations where
AXBTs will be launched and in combination with AXBTs at the IP and second drop
point (in support of Joe Cione's inner core SST cooling research). AXBTs and
AXBT/GPS dropsonde combos will be targeted in areas coincident with a
pre-storm ocean survey mission flown on 08 September as well as with NOAA
drifting buoys in the area. Doppler wind and Super Ob analyses will be
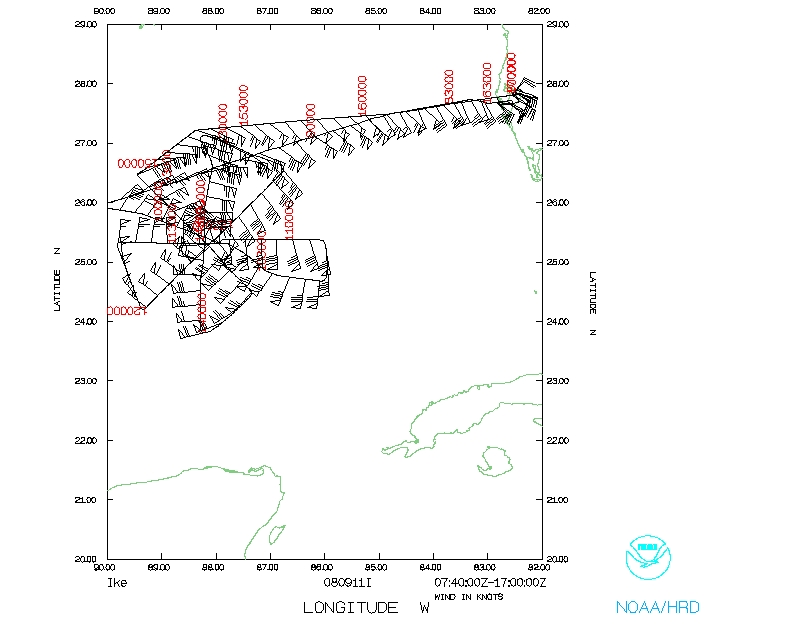
transmitted off the plane in real-time, if possible. The flight track, 12 GPS
dropsonde points and 22 AXBT points are shown in Fig. 1. The flight track
with overlaid tracks and positions of NOAA drifting buoys that were deployed
ahead of the storm are shown in Fig. 2.
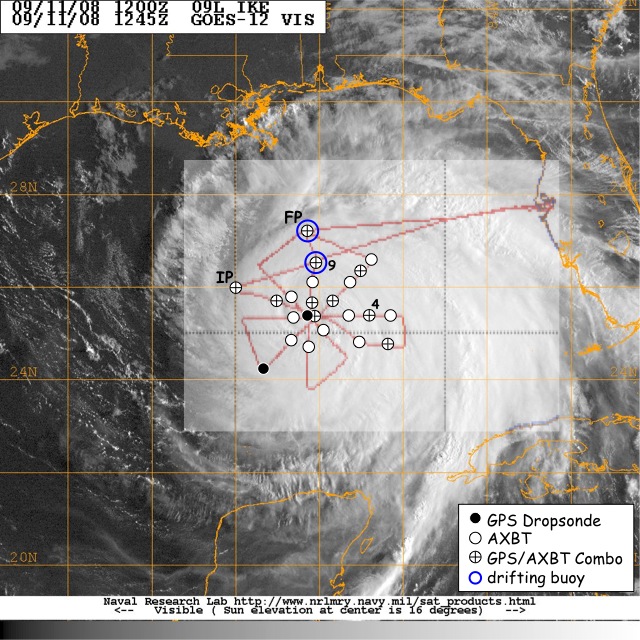
Fig. 1: Flight track (red line) for EMC Tail Doppler Radar mission
20080911I1. GPS dropsondes, AXBTs and AXBT/GPS dropsonde combos that were
launched are indicated by black circles, white circles and circled crosses
respectively. Blue circles indicate positions of NOAA drifting buoys that
were overflown with GPS dropsonde/AXBT combos.
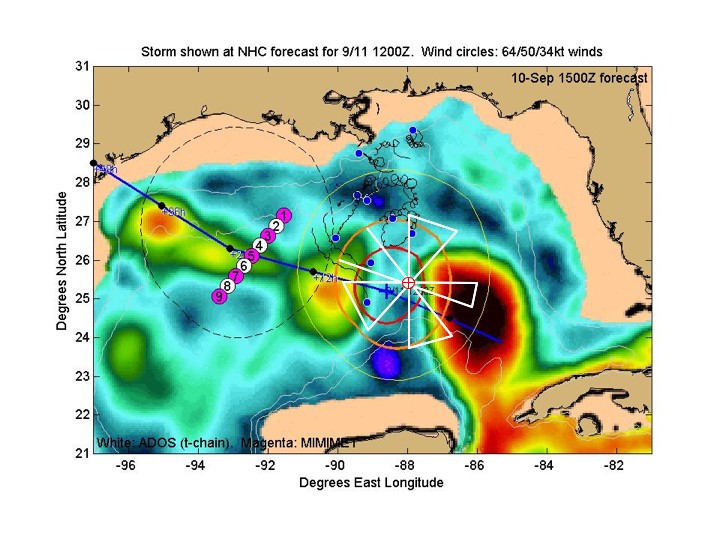
Fig. 2: Flight track (white line) for EMC Tail Doppler Radar
mission 20080911I1. The black curves (blue circles) show the tracks
(positions) of several NOAA drifting buoys that were launched ahead of the
storm. Hurricane Ike's forecast track is shown by the blue line with forecast
points shown by black circles. Altimeter-derived ocean heat content values
are indicated by the colored shading.
Mission Summary :
| Take off
| Landing
| MacDill AFB, FL | 08:10 UTC
| MacDill AFB, FL | 16:55 UTC
| |
- Synoptic Situation
On 11 August, Hurricane Ike was positioned around the western periphery of a
large deep layer ridge and the remains of a weakening ridge to the NW (Fig. 3,
left). Vertical wind shear analyses from UW-CIMSS indicated ~10-15 kt of
shear over Ike (Fig. 3, right). Figures 3 and 4 also indicate that
northwesterly shear was still present over the storm and that upper-level
outflow around the western semicircle was still restricted (though perhaps
somewhat less so).
Fig. 3: (Left) plot of 250-850 hPa deep layer mean steering
[magnitude (direction) of the steering flow is indicated by colored shading
(white streamlines) and the storm center is shown by the red hurricane symbol]
for 11 Sept 1200 UTC. (Right) vertical wind shear [magnitude (direction) of
the wind shear is indicated by yellow contours (orange streamlines)]) for 11
Sept 1200 UTC. Images courtesy of UW/CIMSS.
Fig. 4: Plot of mid to upper-level GOES water vapor winds for 11
Sept 1200 UTC. Image courtesy of UW/CIMSS.
- Mission Specifics
Take-off was from MacDill at 0810 UTC. Hurricane Ike was located at ~25.2°
N 87.6°W, its intensity was 85 kt (946 hPa) and its forward motion was 295 ° at 8 kt. Figure 5 (left) shows an overpass by the SSMIS (91 GHz)
satellite and indicates that Ike's convection was still quite asymmetric.
Ike had a broad crescent shaped outer eyewall that was confined to the SE
quadrant. Also evident in the SSMIS image (and confirmed by 43's LF radar)
was a small inner eyewall located ~20 nm inside the outer eyewall. The size
and location (SE quadrant) of the larger outer eyewall and small inner eyewall
were quite consistent throughout the 8.75 hr mission. A 1330 UTC H*Wind
surface wind analysis confirmed that the asymmetry of the surface wind field
was similar to the asymmetry seen in the SSMIS 91 GHz imagery (Fig. 5). Also
of interest was the atypical flight-level to surface reduction factor for the
winds. At one point during the mission, ~100 nm NNE of the center, the P-3
measured 103 kt flight-level winds, while the SFMR only reported 65 kt at the
surface. This 63% surface wind reduction factor suggests that Ike's winds at
the flight level were highly decoupled from those at the surface.
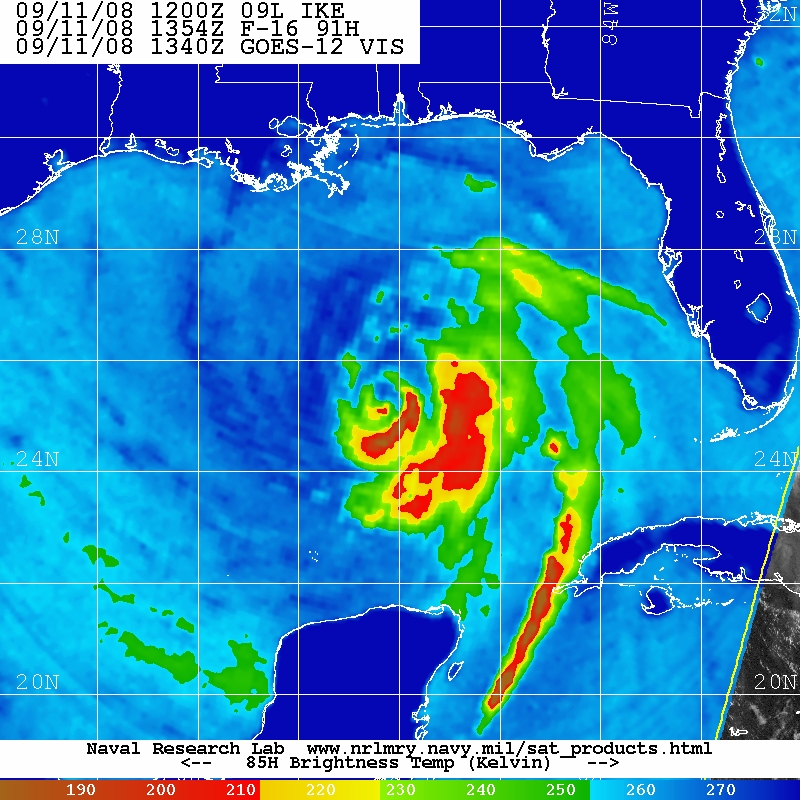
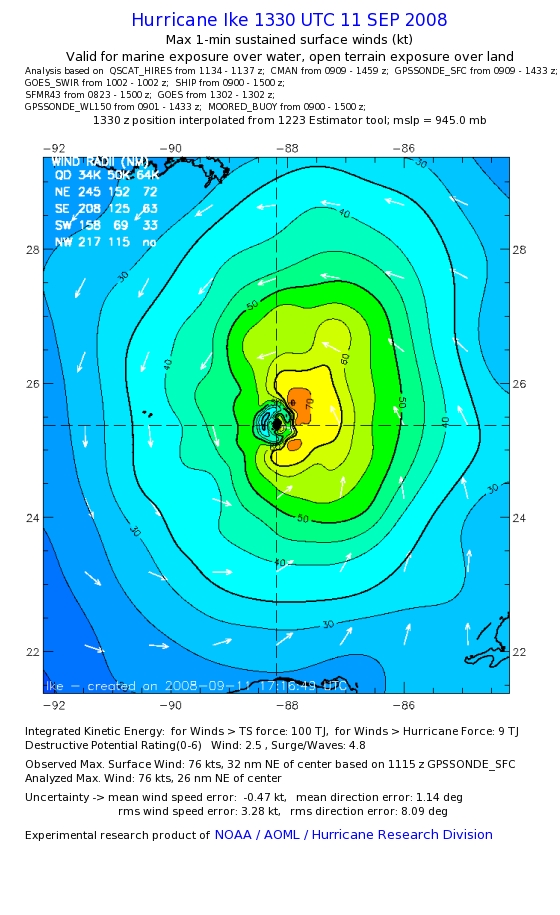
Fig. 5: Plots of (left) SSMIS 91 GHz imagery for 11 Sept 1354 UTC
and (right) a HRD H*Wind surface wind analysis for 11 Sept 1330 UTC. Images
courtesy of NRL/Monterey and NOAA/AOML/HRD.
The flight pattern was executed as planned. There were ten GPS dropsonde/AXBT
combos and two overflights of NOAA drifting buoys (with GPS dropsonde/AXBT
combos) were made at drops #9 and #12. Additionally, GPS dropsonde/AXBT
combos were made at the IP and at drop #2 in support of Joe Cione's inner core
SST cooling research. The lowest GPS dropsonde pressure observed during the
mission was 945.1 hPa at drop #5, during a pass through the center at 1118 UTC.
Five Doppler wind and three Super Ob analyses were transmitted off the P-3 in
real-time during this mission.
Problems :
There were no major problems related to this flight. A few minor issues
included:
- FTPing of the Doppler data off the plane was unreliable during the flight once again
- 3 of the 22 AXBTs failed and one of the CADS failed to launch
Jason Dunion
29 April 2009
Mission Data :
Dropsonde plots
850 mb
925 mb
1000 mb
surface
Flight Data
NetCDF listing
1 second listing
Page last updated April 29, 2009
Return to Mission page.