Mission Specifics
Take-off was from MacDill at 0808 UTC. Hurricane Ike was located at
~23.5°N 84.8°W, its intensity was 70 kt (964 hPa) and its forward
motion was 300 degrees at 7 kt. Figure 5 indicates that Ike's convection
was quite asymmetric, with the deepest convection (-70° to -80°C cloud
tops) located to the east and northeast of the center. A 1330 UTC H*Wind
surface wind analysis confirmed that the asymmetry of the surface wind field
was similar to the asymmetry seen in the infrared satellite imagery (Fig. 5).
Surface winds in the western semicircle of the storm were significantly weaker
than those around the eastern semicircle.
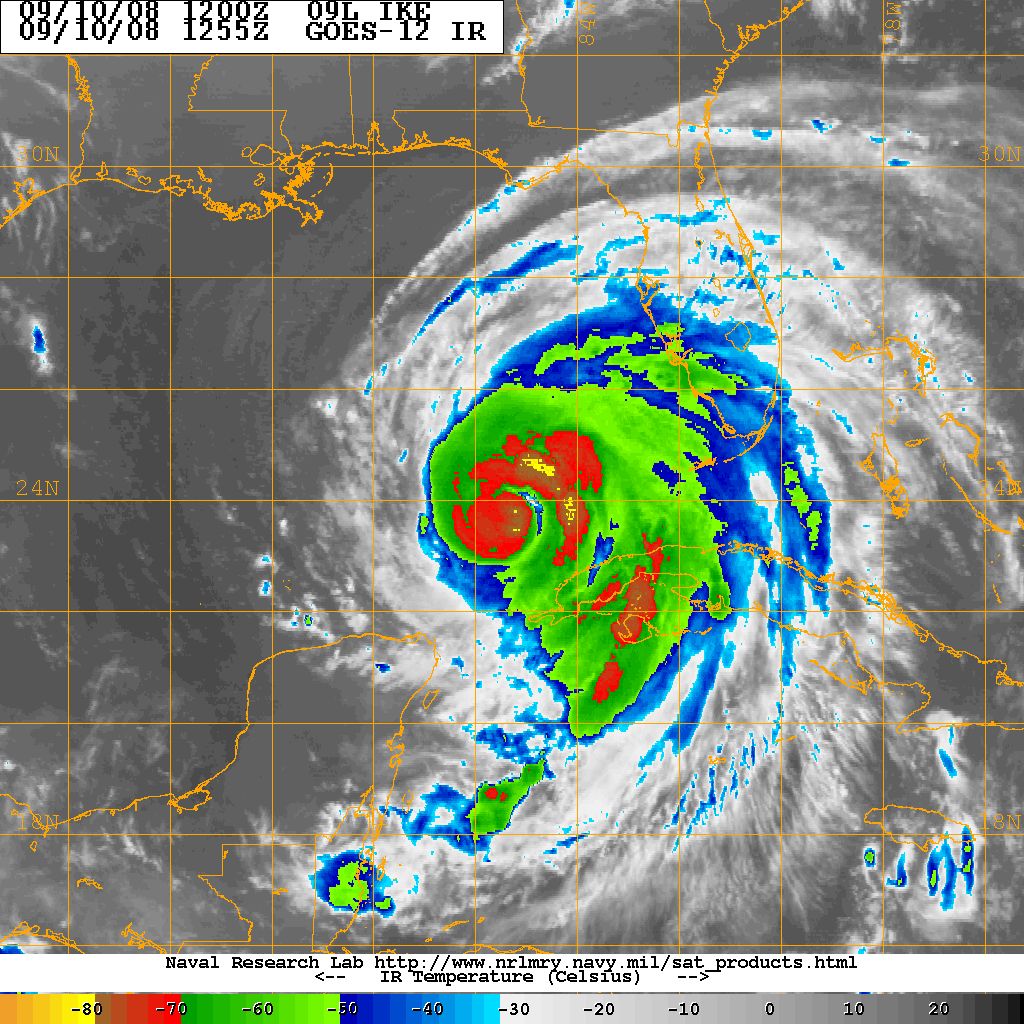
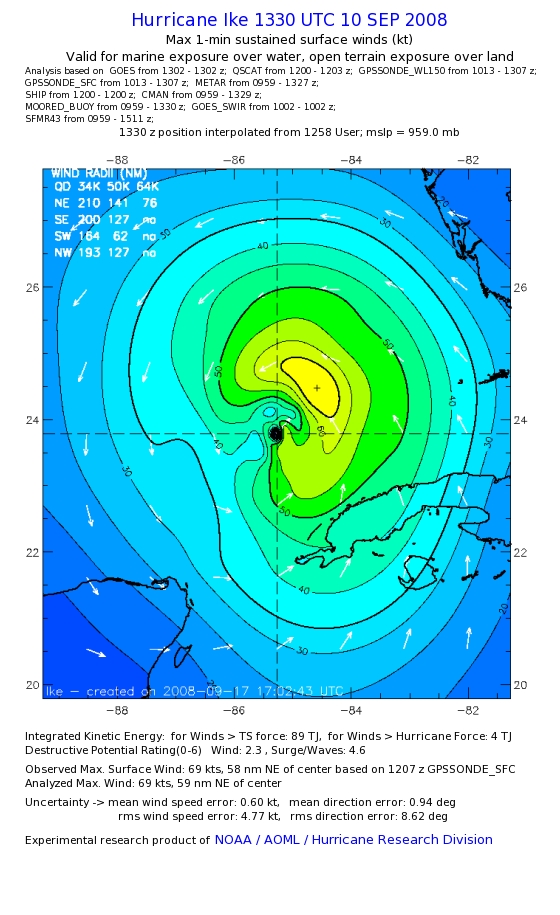
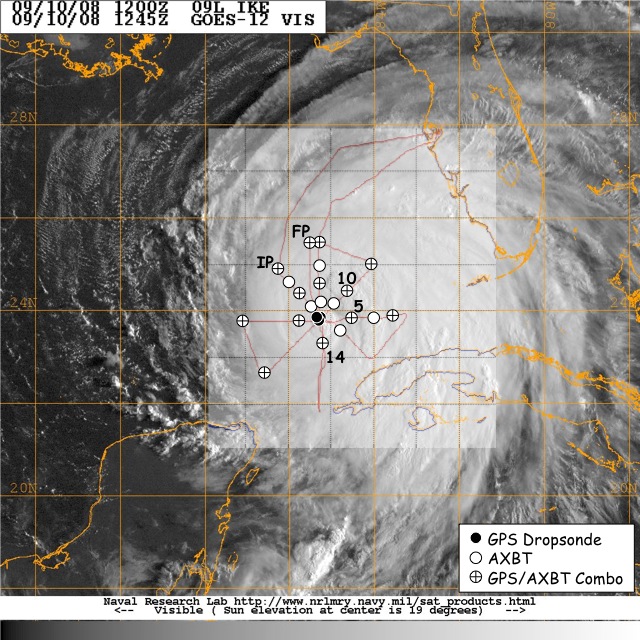
Fig. 5: Plots of (left) GOES-12 IR imagery for 10 Sept 1255 UTC and
(right) HRD H*Wind surface wind analysis for 10 Sept 1330 UTC. Images courtesy
of NRL/Monterey and NOAA/AOML/HRD.
Figure 6 shows images from the SSMIS (91 GHz) and TRMM (Precipitation Radar)
satellites. Both products indicate that Ike had a broad outer eyewall located
approximately 75 nm from the center. This was confirmed by 43's LF radar,
which also showed the presence of a smaller inner pinhole eye. The western
side of the outer eyewall was consistently open throughout the 7.25 hr mission
and near the end of the flight the outer eyewall also appeared to be open to
the north and northeast.
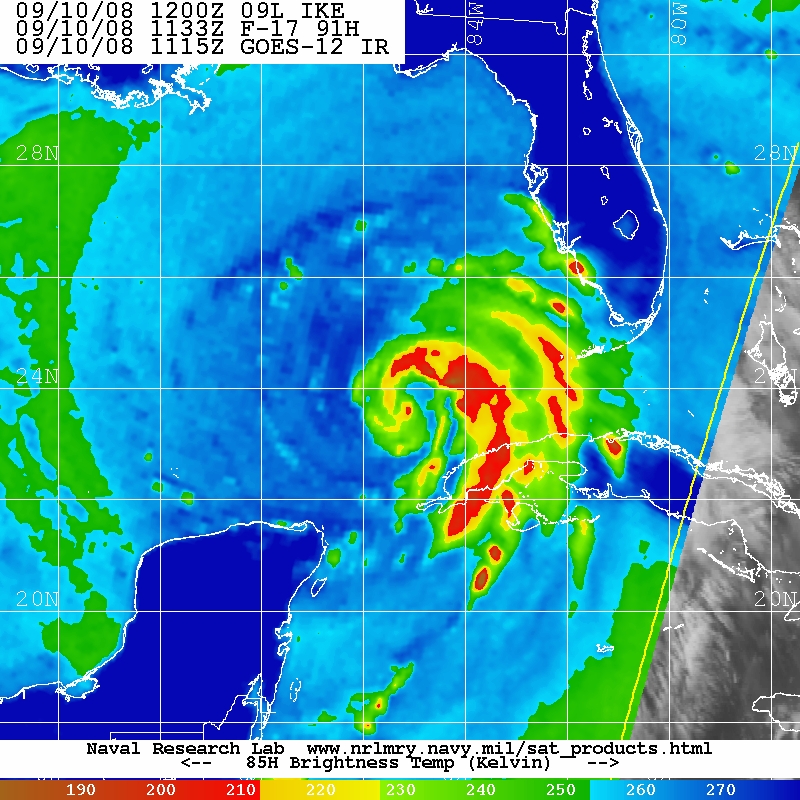
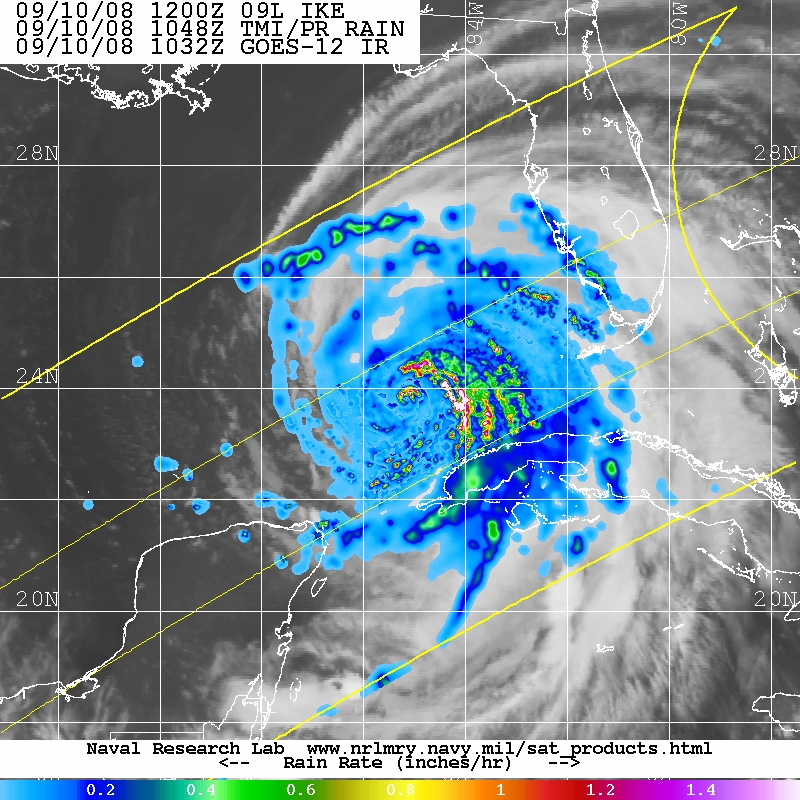
Fig. 6: Plots of (left) SSMIS 91 GHz microwave imagery and (right)
the TRMM Precipitation Radar for 10 August 1133 and 1048 UTC respectively.
Images courtesy of NRL/Monterey.
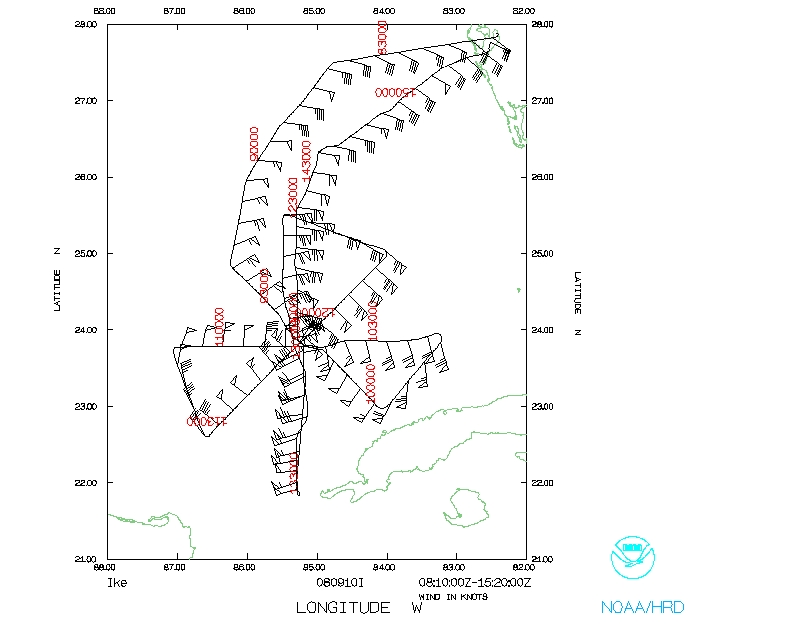
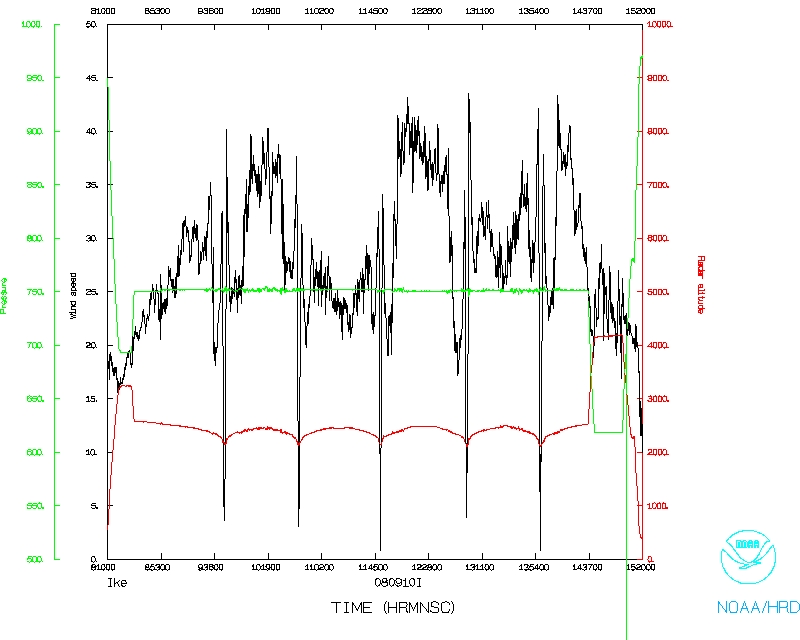
The flight pattern was executed as planned. Thirteen GPS dropsonde/AXBT
combos, 3 GPS-only and 7 AXBT-only drops were made during the mission. The
lowest GPS dropsonde pressure observed during the mission was 956.9 hPa at
drop #9, during a pass through the center at 1149 UTC. One Doppler wind and
one Super Ob analysis were transmitted off the P-3 in real-time during this
mission.