![]()


| Staff | Data Center | Contact Information |
IFEX daily logFriday, September 23, 2005 Hurricane Rita continues to approach landfall in the northwestern Gulf of Mexico as a major hurricane. Satellite imagery (Fig. 190) continues to show a clear eye indicative of a strong storm, though it appears from this image that outflow on the south side is being restricted. Such a restriction is indicative of southerly shear. This is supported by the CIMSS shear analysis (Fig. 191), which shows moderate (15-20 kt) southerly shear impacting the storm. Satellite microwave imagery (Fig. 192) indicates that the outer eyewall seen on the previous day may be eroding and has expanded to around 100 nm in diameter. The inner eyewall shows an asymmetry, with an opening on the southeast side. An analysis of surface winds produced from the overnight hours (Fig. 193) shows that maximum surface winds are around 110 kt on the northeast side of the storm. 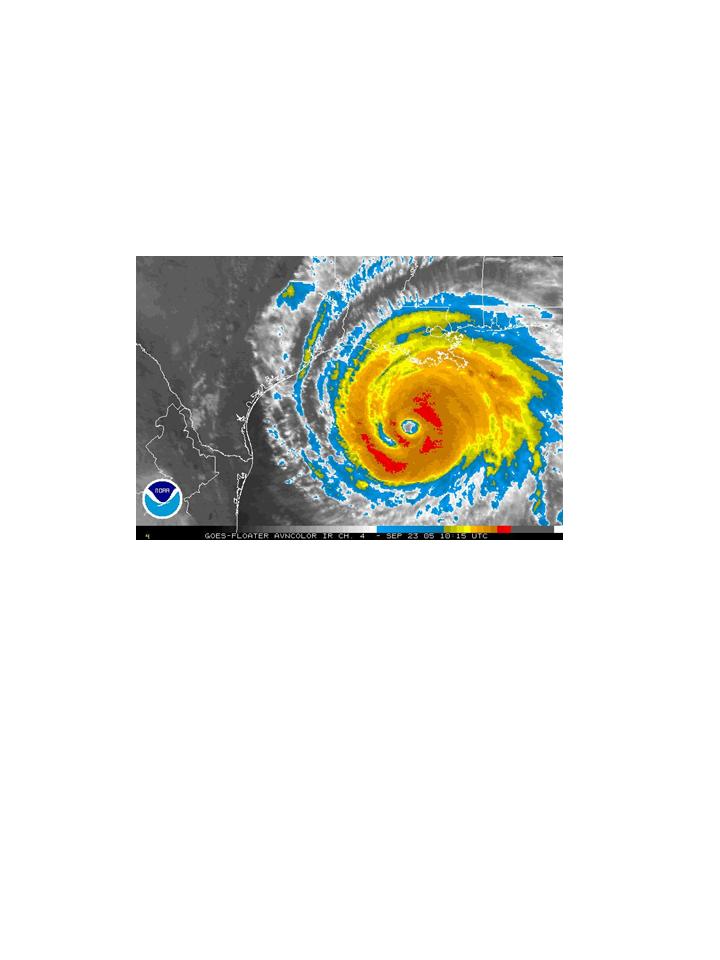 Figure 190. GOES-East infrared image valid 1015 UTC September 23. Today there was another tasked mission for N43RF. N42RF would fly another Ocean Winds experiment, and the NRL P-3 would again fly, using the LF radars from both NOAA P-3's to guide it. N43RF's mission is a combination SFMR/fix mission into Hurricane Rita, with fix responsibilities at 18, 21, and 00 UTC. The leg length would be 105 nm, with an IP on the northeast side. GPS sondes would be dropped for NHC at the surface wind maximum on the northeast and northwest sides, plus drops in the center. In addition to these operational responsibilities, several research objectives would be met as well. RAINEX drops would be released at the flight-level wind maximum in the inner eyewall, in the moat region between the inner and outer eyewall (if an outer eyewall exists), and on the inner edge of the outer eyewall (if it exists). Additionally, HRD GPS/AXBT combination drops would be released in the southwest and southeast quadrants during the first figure-4, corresponding to the drop locations from the previous day's drops and partially covering the buoy grid laid out by the Air Force two days earlier. Finally, HRD sondes would be dropped on the downwind leg along the coast of 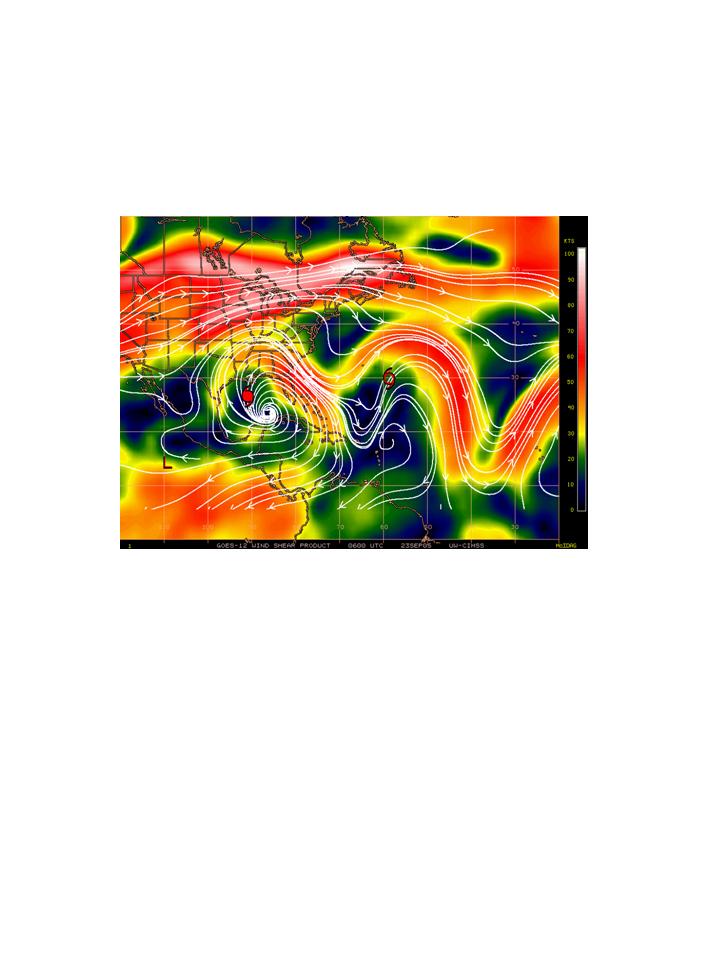 Figure 191. CIMSS-derived 850-200 hPa vertical shear (shaded, kt) valid 06 UTC September 23.
Louisiana to provide the vertical profile of wind speeds upstream of wind profiling towers placed along the coast in anticipation of landfall. The N43RF mission followed the plan. The IP was on the northeast side (Fig. 194), and the aircraft dropped 11 HRD sonde/AXBT combination drops in the southwest and southeast quadrant of this initial figure-4. At the completion of the figure-4 pattern the aircraft was on the northwest side. At this point the aircraft turned downwind to the southwest side and headed inbound for the next figure-4. It did a coastal run on the next downwind leg, dropping six HRD sondes along this downwind leg to support landfall objectives as outlined above. The end of this figure-4 was on the southeast side, at which 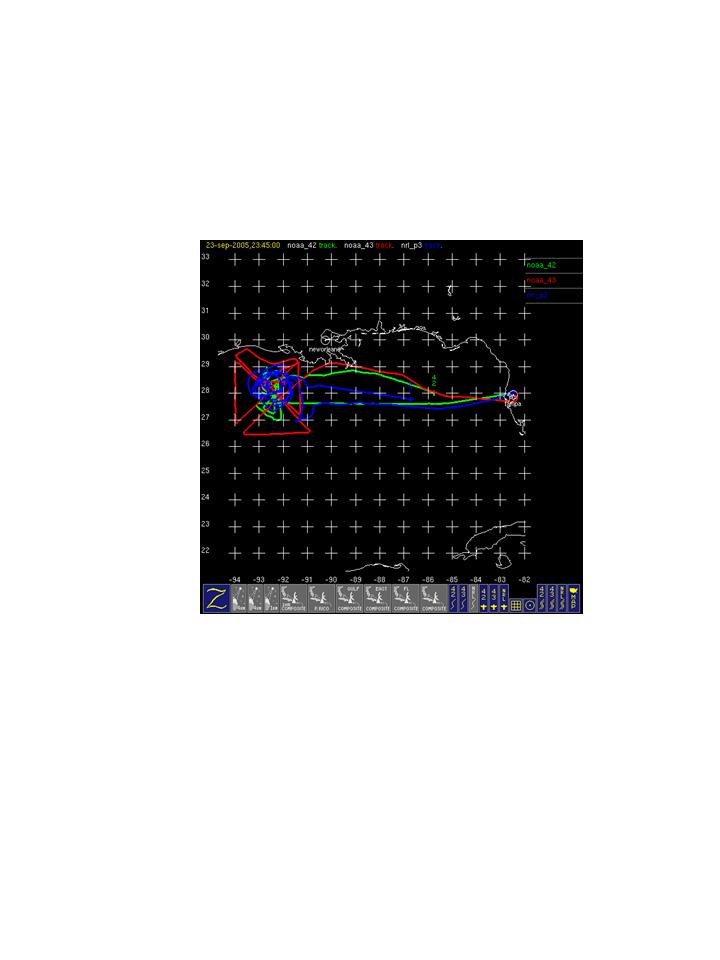 Figure 194. Tracks of N42RF, N43RF, and NRL P-3 on September 23. point the aircraft did a downwind leg to a point east-northeast of the center and came in for a final fix before returning to base. All during the pattern N43RF dropped RAINEX sondes across the inner eyewall, in the moat region, and along the outer eyewall. A total of 49 sondes (24 RAINEX, 10 NHC, and 15 HRD sondes) and 12 AXBT's were dropped. The storm had undergone significant structural changes from the previous two days. The MSLP had risen to about 930 hPa. Peak flight-level (surface) winds were 130 (90) kt on the northeast side of the storm. By contrast, peak flight-level (surface) winds were 100 (85) kt on the southwest side of the storm. Concentric eyewalls still seemed to be present, but marked asymmetries developed as the storm encountered 15-20 kt of southerly shear (cf. Fig. 191). This asymmetry was manifested in several ways: in the reflectivity pattern in the inner core, the rainfall distribution outside the core, the relationship between the radial location of flight-level and surface wind peaks in the different quadrants, and the difference between the flight-level and surface magnitudes in the different quadrants. Toward the end of the flight, it appeared that the outer eyewall dissipated and was replaced by a band that was spiraling into the center on the west side of the storm. The other aircraft flew patterns similar to that flown yesterday (cf. Fig. 194). N42RF continued the Ocean Winds work of the previous day, primarily targeting the northern and southern inner eyewall. The NRL P-3 again was able to circumnavigate the inner eyewall, flying in close proximity to the inner eyewall (Fig. 195). In addition, the NRL P-3 was able to fly into the center of the hurricane, coming in through the opening on the south side of the inner eyewall. All in all, these Rita flights have sampled a remarkable shift in the structure of the hurricane from a very strong, symmetric Category 5 hurricane to a strong, symmetric, Category 4 hurricane with concentric eyewalls to a 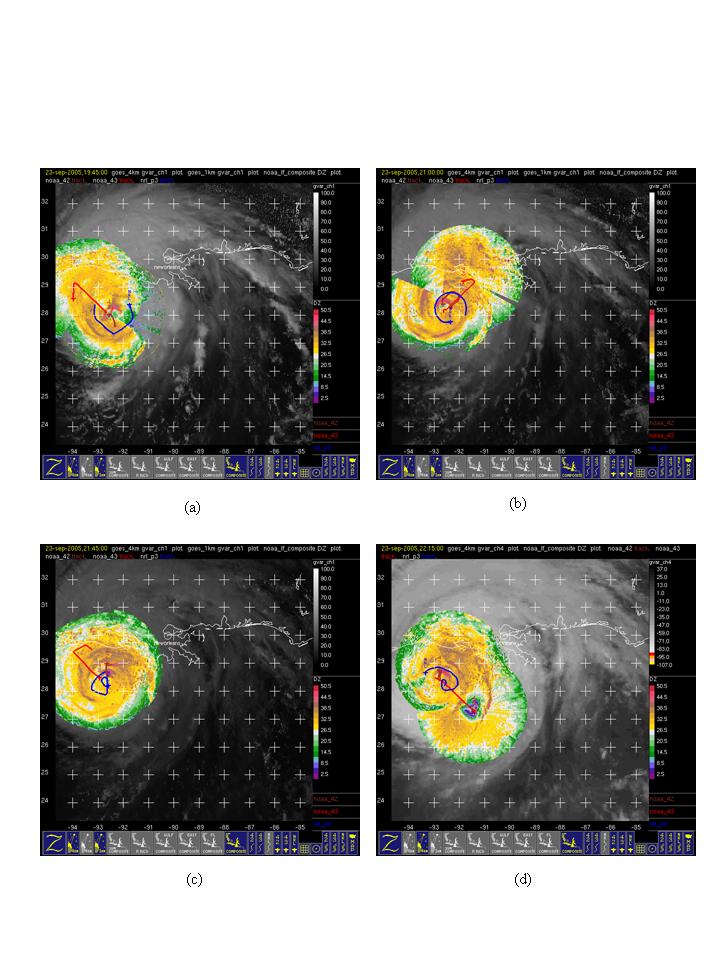 Figure 195. Plot of lower fuselage reflectivity (shaded, dBZ) from N43RF and N42RF and flight tracks of N43RF, N42RF, and the NRL P-3 during previous 30 minutes for (a) 1945 UTC; (b) 2100 UTC; (c) 2145 UTC; and (d) 2215 UTC September 23, 2005. Category 2-3 hurricane that is developing asymmetries, possibly in response to vertical shear and/or dry air on the west side of the storm. Rob Rogers |


![[OAR/DOC/NOAA Logos]](../../../oar_noaa_doc_logos3.jpg)