![]()


| Staff | Data Center | Contact Information |
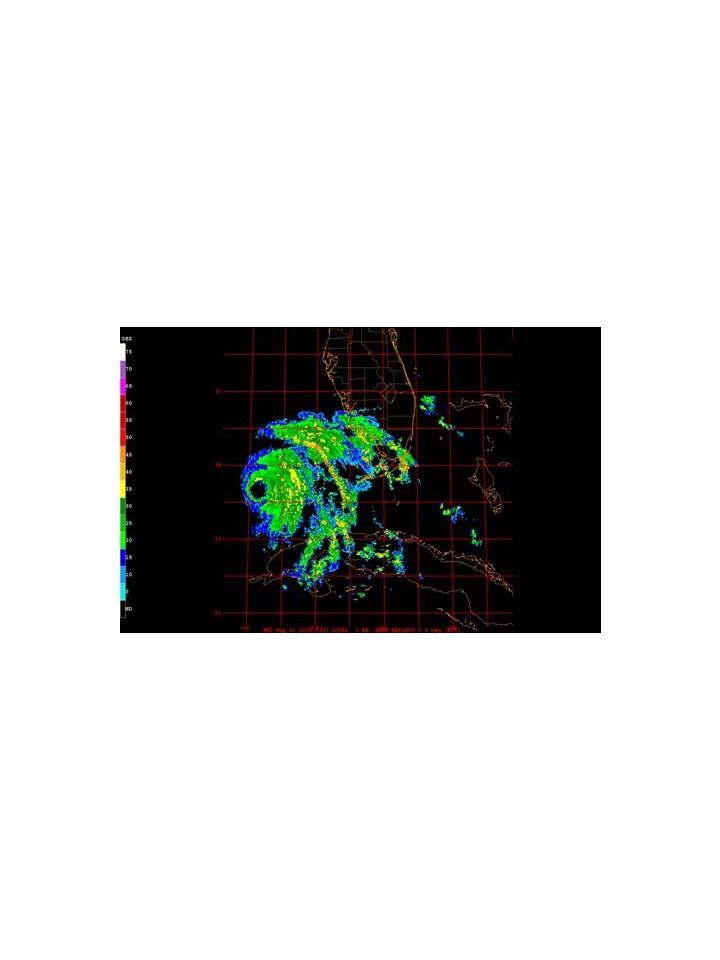
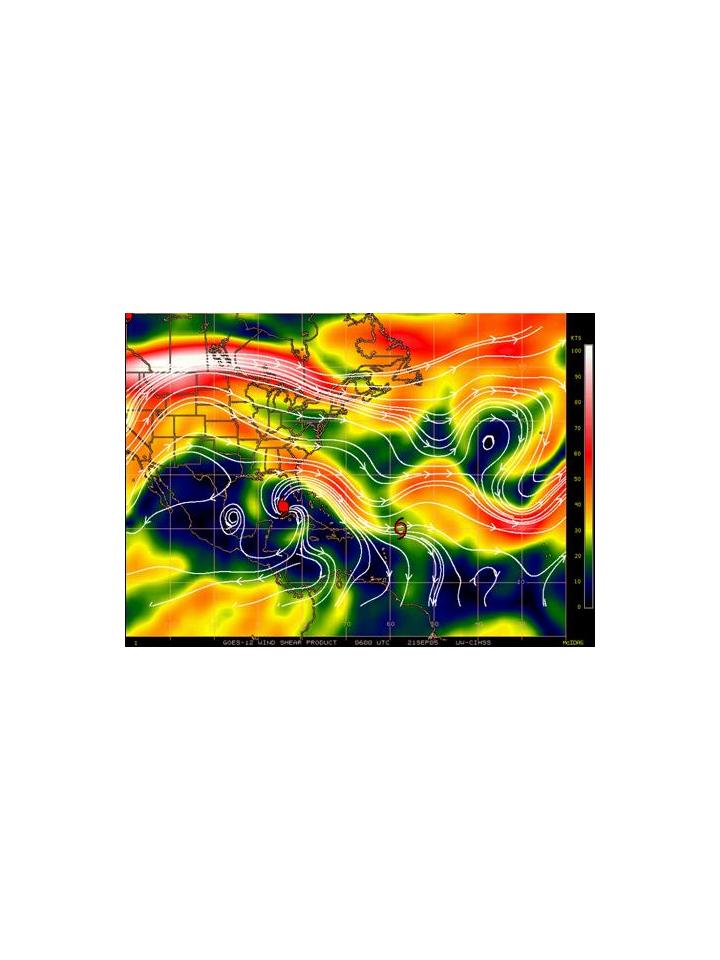
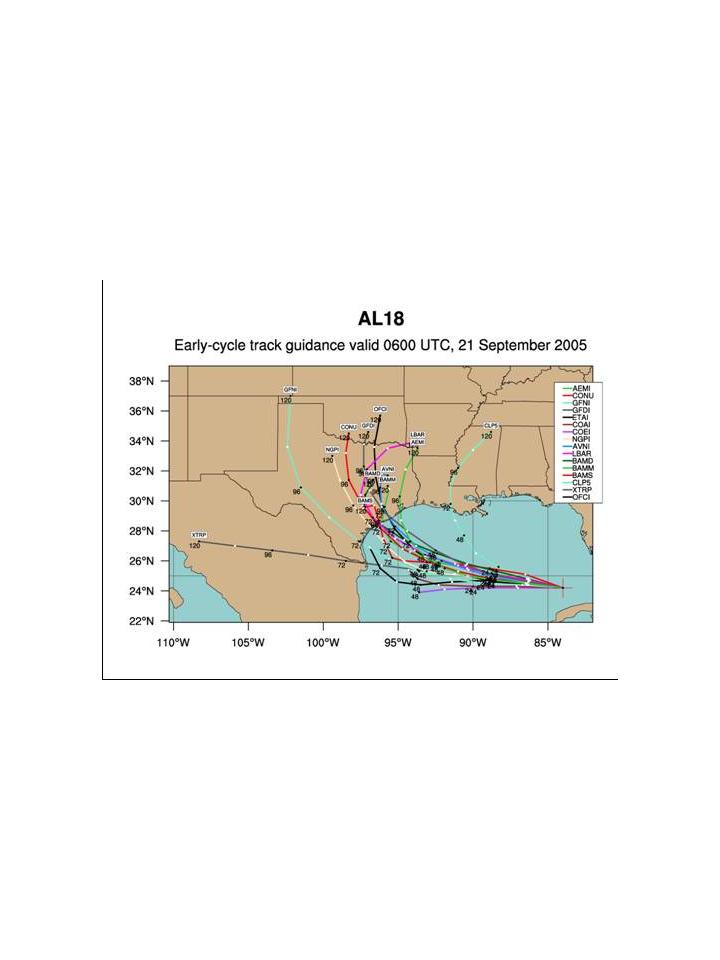
IFEX daily logWednesday, September 21, 2005 On Wednesday morning, Hurricane Rita appeared much stronger from satellite imagery. Infrared imagery (Fig. 178) showed that Rita had a large (30-40 nm diameter) eye with very cold cloud tops. Such a satellite signature is indicative of a major hurricane. Microwave data collected several hours earlier (Fig. 179) showed that there was a principal rainband spiraling around the storm and extending out hundreds of miles. The heaviest rainfall associated with the rainband was located on the north side of the storm. A radar image from Key West that morning (Fig. 180) also showed the band on the east side of the storm, along with several other banded features in the east and northeast sections of the storm. Shear is still weak over the storm (Fig. 181), and track guidance (Fig. 182) predicts that Rita will continue into the Gulf, where waters are still very warm. Thus Rita is expected to remain a significant hurricane in the Gulf, possibly making landfall in the northwestern Gulf in about three 3 days. 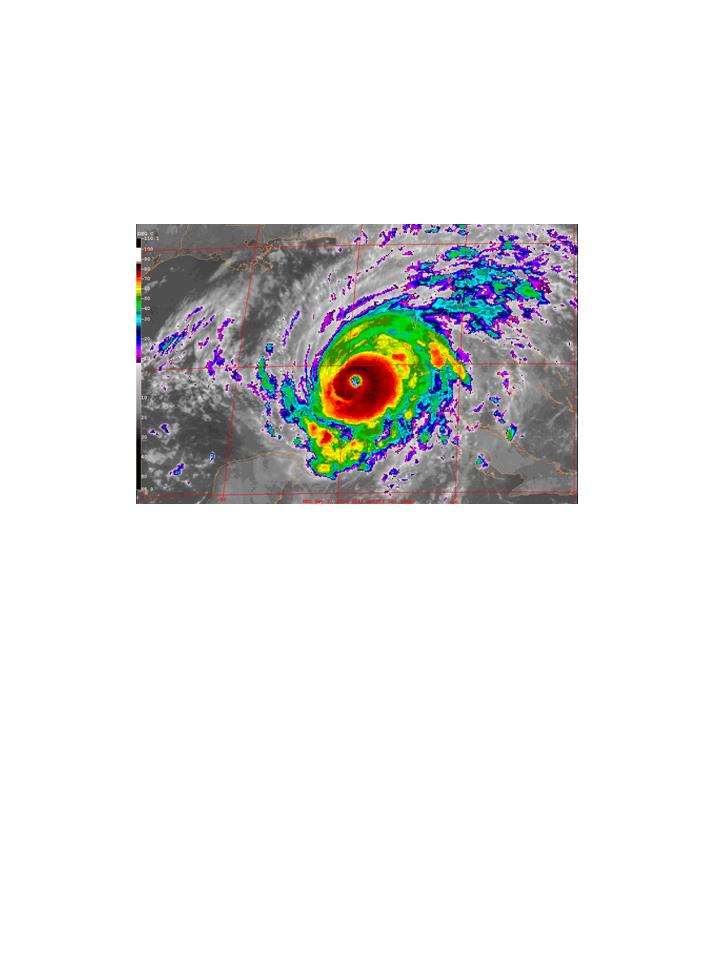 Figure 178. GOES-East infrared image valid 0845 UTC September 21. The plan for today called for a two-plane IFEX/RAINEX mission into Hurricane Rita. N43RF would fly a figure-4 pattern, with an IP 50 nm east of the storm. That pattern would end up on the north side of the storm, after which point N43RF would begin to work with the NRL P-3 on rainbands around the storm. The two aircraft would fly rainbands in all quadrants, if possible, and then N43RF would finish with another figure-4 with the same orientation as the first one. N43RF would fly at 12,000 ft, and the NRL P-3 would fly at 14,000 ft. If icing became a problem, then NRL would descend to 12,000 ft, and N43RF would descend to 8000 ft. RAINEX drops would be made in the middle of the eyewall and on the inner edge of the eyewall, at the center of the storm, and at the midpoint and endpoints of any rainband legs that are flown. HRD drops would be made at all turn points in the figure-4 patterns. Nine AXBT's are available; they will be dropped just outside the eyewall on the first figure-4 and at the midpoint of each rainband leg. 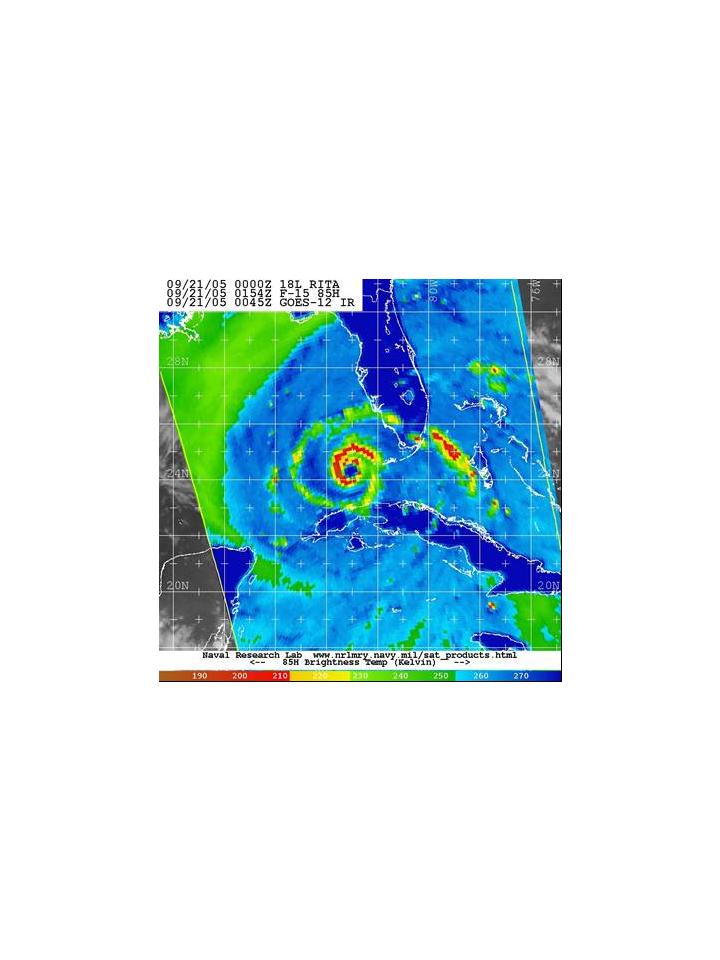 Figure 179. SSM/I 85 GHz image valid 0154 UTC September 21.
The mission did follow the plan well. The flight tracks shown in Figure 183 indicate that N43RF did fly its two figure-4 patterns as well as fly along rainbands in all four quadrants. The NRL P-3 flew primarily around the periphery of the core, which was according to plan as well. The storm was undergoing rapid intensification prior to and during the flight today. The final fix in the previous day's mission had a central pressure of 972 hPa, while the first pass in today's mission (less than 24 h later) had an extrapolated MSLP of 925 hPa � nearly 50 hPa in less than 24 h. During the first penetration there was an indication that there was a double eyewall present, but there was no secondary wind maximum at the time. Rainfall was primarily stratiform in the northeast side. As usual, marked azimuthal asymmetries in the wind field were evident, as peak flight-level winds on the east (west) side were 140 (120) kt, while peak SFMR winds were 125 (110) kt. Peak flight-level winds on the north (south) side were 160 kt, while peak SFMR winds were 130 (120) kt. The eye for the entire mission had a good stadium effect. By the time of the second figure-4 near the end of the mission, the peak flight-level winds on the east (west) side were 160 (150) kt, while peak SFMR winds were 135 (130) kt � a 20-30-kt increase in flight-level winds and 10-20-kt increase in surface winds in a 3-h time period. The MSLP had also dropped from 928 hPa to 909 hPa, as measured from GPS sondes, over this same time period. Sea-surface temperatures measured from the AXBT's generally were 28.5 -29 C ahead of the storm, indicating an ocean environment favorable for sustaining a storm of this strength. 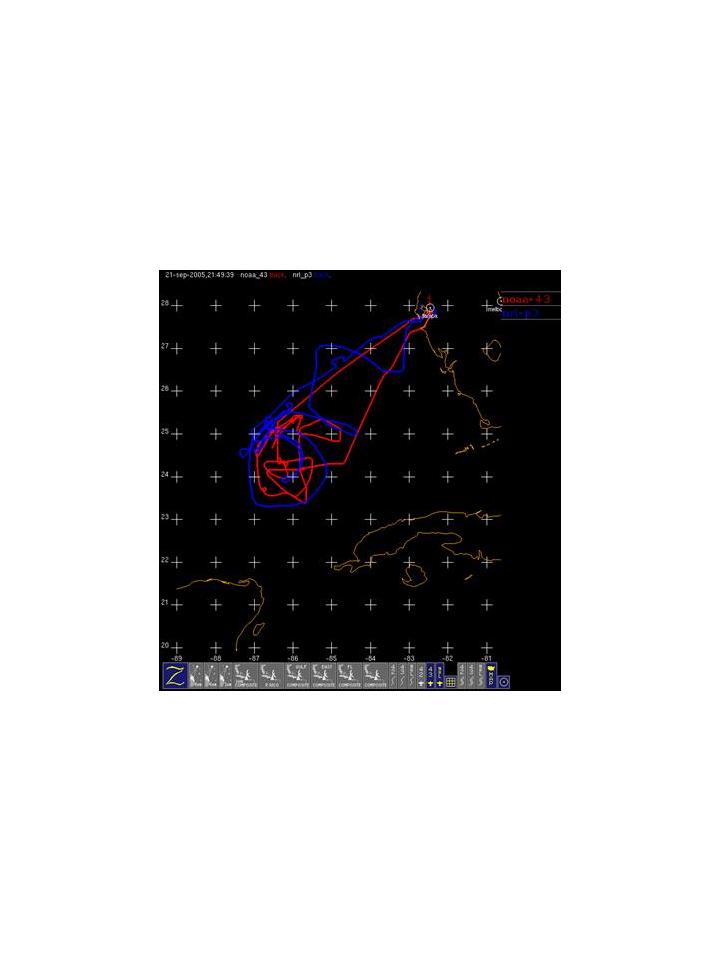 Figure 183. Tracks of N43RF and NRL P-3 for flight on September 21. The coordination between the two aircraft for the rainband work was a bit clumsy at first, largely because there was such widespread stratiform rain in the north side of the storm. Coordination was eventually established, however, and some excellent patterns were flown around the rainbands on the northwest, southwest, and southeast sides (Fig. 184). The passes in the northwest quadrant included both downwind and upwind legs. Portions of these passes were well-enough coordinated to provide quad-Doppler coverage. A total of 35 sondes and 9 AXBT's were dropped in the storm as it completed its cycle of rapid intensification. Shortly after the mission was completed, the minimum central pressure observed by an Air Force aircraft was 897 hPa, marking the fourth- lowest central pressure ever recorded in the Atlantic basin. This mission should provide an excellent dataset for studying the evolution that occurs with rapid intensification. It is also the third mission in three days into this system, which was first sampled as a tropical storm and has now become a Category-5 hurricane in less than three days. 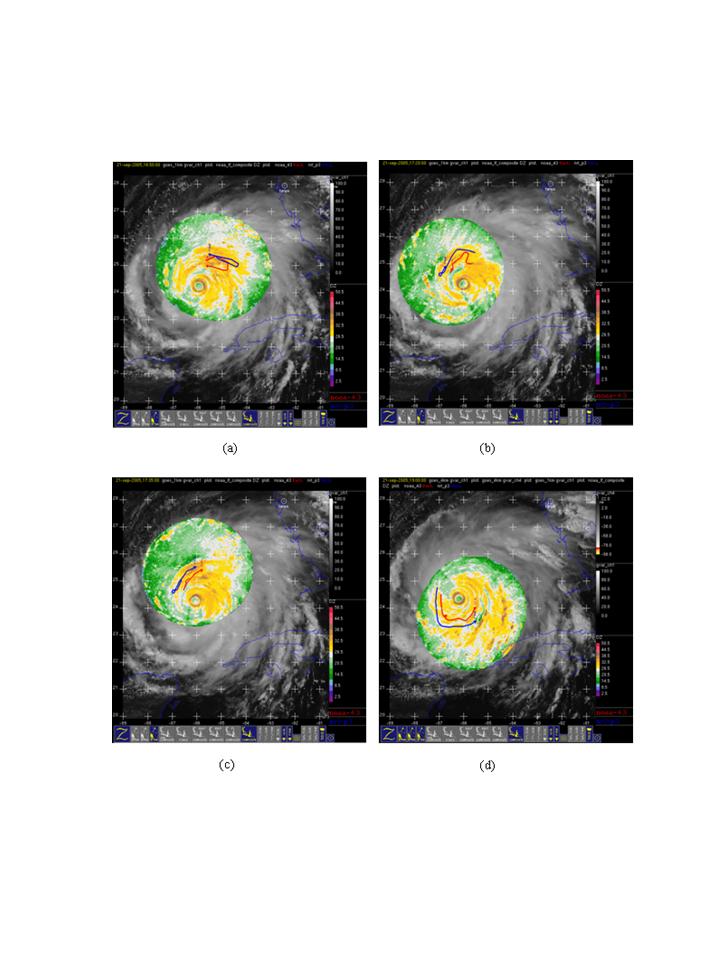 Figure 184. Plot of lower fuselage reflectivity (shaded, dBZ) from N43RF and flight tracks of N43RF and the NRL P-3 during previous 30 minutes for (a) 1650 UTC; (b) 1720 UTC; (c) 1735 UTC; and (d) 1900 UTC September 21, 2005.
Rob Rogers |
![[OAR/DOC/NOAA Logos]](../../../oar_noaa_doc_logos3.jpg)