![]()


| Staff | Data Center | Contact Information |
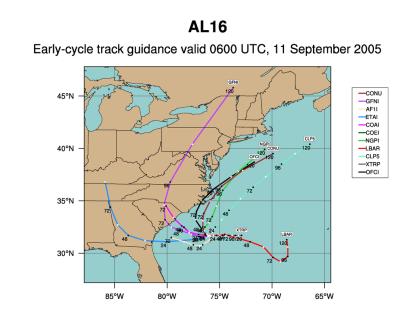
IFEX daily logSunday, September 11, 2005 Ophelia continued to linger off the South Carolina coast today (Fig. 110). The infrared satellite image showed that the deepest convection in the core was on the north side of the circulation. There were two primary areas of cold cloud tops: eyewall convection on the north side and a band wrapping around from the southwest around to the north side. The presence of this banded structure around the north side of the storm is also supported by coastal radar (Fig. 111), which was capable of seeing the storm even though it was still well offshore. The storm was a hurricane again, though water vapor imagery (Fig. 112) showed dry air around the west and the southwest side of the storm. The storm was also experiencing light to moderate westerly shear (Fig. 113), which would favor the maximum eyewall convection and rainband orientation on the north (downshear left) side. The dry air, coupled with cold water upwelled by the storm that had been over the same area for several days, would likely limit any further intensification of the storm. Shear may play a slight inhibiting role, but that is probably not the most significant factor that would limit intensification. Track guidance is still spread widely (Fig. 114), which is common for systems that are very slow moving. It continues to suggest that the storm will move slowly for the next several days.  Figure 110. GOES-East infrared image valid 1045 UTC September 11, 2005.
Today would be the first three-plane research mission. The plan called for an IFEX/RAINEX/Ocean Winds mission into Hurricane Ophelia. N43RF would fly an initial figure-4 pattern with 100-nm leg lengths, starting on the southwest side of the storm. Sondes would be dropped at the turn points, at the outer edge of the eyewall, in the middle of the eyewall, and at the center of the storm. At the completion of the figure- 4, N43RF would set up for coordination with the NRL P-3 on the east side of the storm. There the two aircraft would fly a RAINEX rainband pattern, with N43RF either on the inner or the edge edge of the eyewall. Sondes would be dropped at the end points and the midpoint of each downwind leg. AXBTŐs would be dropped at the turn points, at the eyewall drop, and at the end points of the rainband leg. Both N43RF and the NRL P-3 would try to maintain a close distance to the rainband, which is about 10-15 km away from the edge of the rainband. N43RF would fly at 12,000 ft and descend to 8000 ft if needed. The NRL P-3 would fly at 14,000 ft and descend to 12,000 ft if needed. N42RF would fly an initial figure-4, with leg lengths of 100 nm. After that figure-4 N42RF would fly targeted passes into areas of high wind and rain rates for the Ocean Winds Experiment. The mission was a success. The storm had a steady intensity, but the structure of the storm was constantly evolving. The eyewall was generally open on the south and the southeast side. There were multiple rainbands that were wrapping around the southeast, east, northeast, north, and around the west side. The dominant activity associated with the principal rainband was on the north side. On the north side of the storm between bands some moderate chop was encountered as the plane was flew across a shear zone characterized by low-level inflow and midlevel outflow. Peak flight-level winds of 90 kt were encountered on the north side of the storm toward the end of the mission while the peak SFMR winds was 60-65 kt on the northeast side of the storm. Sea-surface temperatures were quite low in the eyewall and on the northeast, southeast, and southwest sides of the storm. SSTŐs as low as 23 C were measured. The only warm SST was measured 100 nm northwest of the storm. A value of 28 C with a deep mixed layer was measured, possibly denoting the Gulf Stream at this location. After the initial figure four was completed, N43RF set up for coordination with the NRL P-3. N43RF flew a series of upwind and downwind legs along the inner edge of the principal rainband (Fig. 115), maintaining a distance of 10-15 km for much of the legs, while the NRL P-3 flew upwind and downwind legs along the outer edge of the same rainband, while N42RF flew a figure-4 and a series of targeted passes for Ocean Winds. At the end of N43RFŐs figure 4 pattern, the NRL P-3 encountered icing at 14,000 ft, so it descended to 12,000 ft and N43RF descended to 10,000 ft. N42RF was operating at 4000 ft the whole time. The initial coordination was a bit confused at first, but eventually good coordination was established. At that point the upwind and downwind legs were flown on the same principal rainband. Several of these had excellent coordination, providing quad-Doppler coverage. The tracks for all three aircraft are shown in Fig. 116. This should be a great dataset for a system with multiple bands and rapidly-evolving features, even though it remained a category 1 storm.   Figure 115. Plot of lower fuselage reflectivity (shaded, dBZ) from N42RF and N43RF and flight tracks of all three aircraft during previous 30 minutes for (a) 1925 UTC; (b) 2010 UTC; (c) 2055 UTC; and (d) 2155 UTC September 11, 2005
Rob Rogers |
![[OAR/DOC/NOAA Logos]](../../../oar_noaa_doc_logos3.jpg)