![]()


| Staff | Data Center | Contact Information |
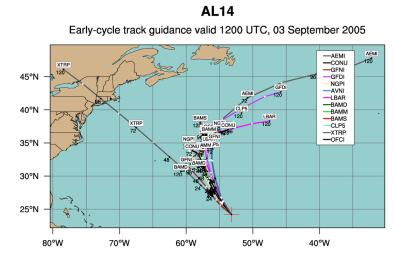
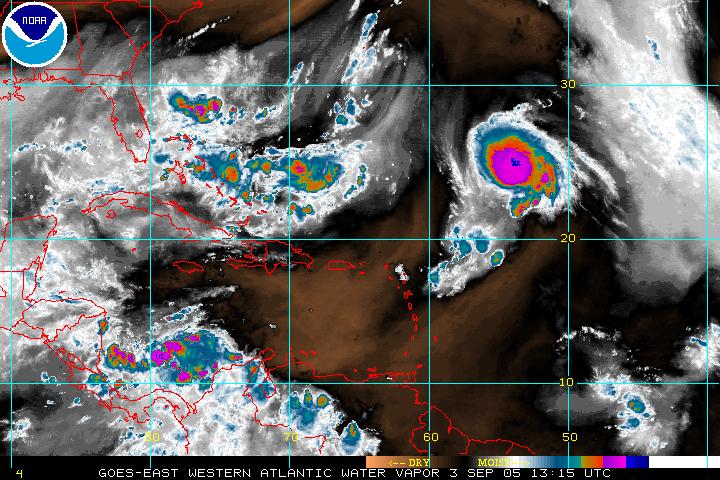
IFEX daily logSaturday, September 3, 2005 The Tropics are still relatively quiet for areas in range of P-3 flights. An infrared satellite image from Saturday morning (Fig. 77) shows a well-organized system that was T.D.#14 and has developed into Tropical Storm Maria. The storm is under a narrow band of relatively low shear (Fig. 78), and thus has the potential to continue to develop. It is forecasted to track toward the north-northwest (Fig. 79), out of range of any possible operations. Elsewhere, a line of convection is evident off the southeast Florida coast extending to a point north of the Greater Antilles. This convection is associated with a broad upper-level trough and surface front that has extended off the U.S. East Coast, as indicated by water vapor imagery (Fig. 80). A flare-up of convection on the southeast edge of this trough has a midlevel circulation associated with it, while the southwest edge of the trough, associated with the southern extent of the surface front, is often an area favorable for tropical cyclogenesis. Global models indicate one or possibly two systems developing in this region over the next several days (Fig. 81). If the western system does develop, it likely would be tasked by NHC for SFMR or fix-responsibility missions. It is also possible that some coordinated RAINEX flights could be flown, if the system developed into a strong tropical storm. Elsewhere, the tropical Atlantic is relatively quiet. 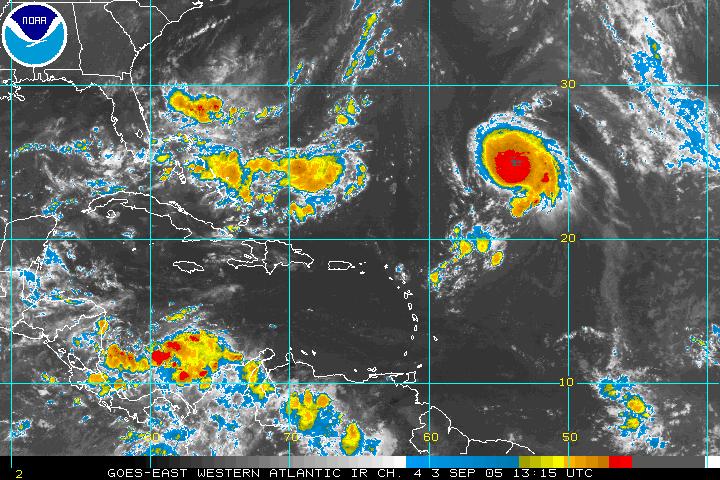 Figure 77. GOES-East Infrared valid 1315 UTC September 3.
Rob Rogers |
![[OAR/DOC/NOAA Logos]](../../../oar_noaa_doc_logos3.jpg)