IFEX daily log
Sunday, August 28, 2005
Today there was another tasked mission into Hurricane Katrina, with fix
responsibilities at 18, 21, and 00 UTC. Katrina intensified dramatically overnight,
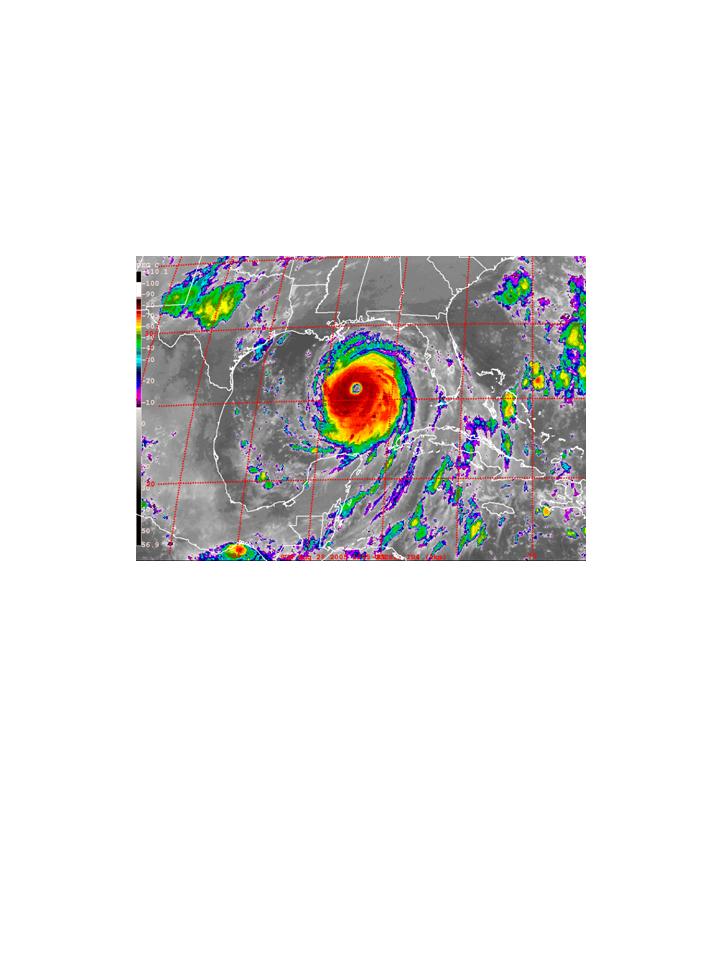
becoming a category 4 hurricane by the morning. Infrared imagery showed a large, clear
eye (Fig. 45). The hurricane circulation covered nearly half of the Gulf of Mexico.
Water vapor imagery at the same time (Fig. 46) showed generally moist air in the vicinity
 of the hurricane, with a small ribbon of dry air on the northwest side of the storm. It was
not anticipated that this dry air would have a significant impact on the storm. Track
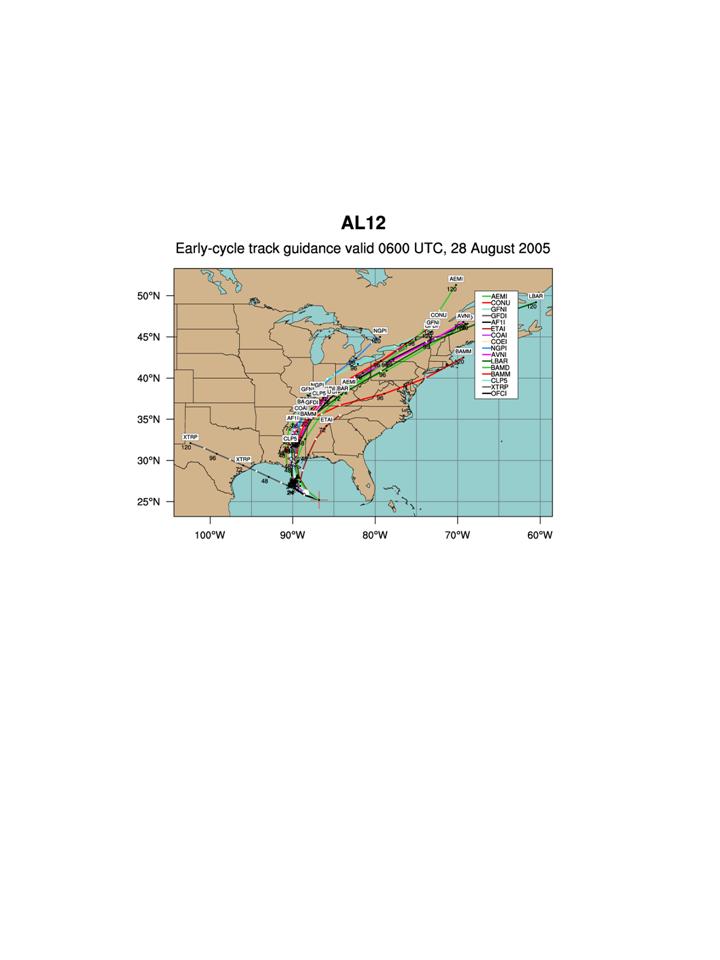
guidance (Fig. 47) predicted that the storm would track north-northwest, then north,
coming ashore somewhere in southeast Louisiana or western Mississippi. The ocean heat
content showed a warm-core eddy lying south of Louisiana along the projected path of
of the hurricane, with a small ribbon of dry air on the northwest side of the storm. It was
not anticipated that this dry air would have a significant impact on the storm. Track
guidance (Fig. 47) predicted that the storm would track north-northwest, then north,
coming ashore somewhere in southeast Louisiana or western Mississippi. The ocean heat
content showed a warm-core eddy lying south of Louisiana along the projected path of
 the hurricane (Fig. 48). Such an ocean thermal environment is favorable for sustaining
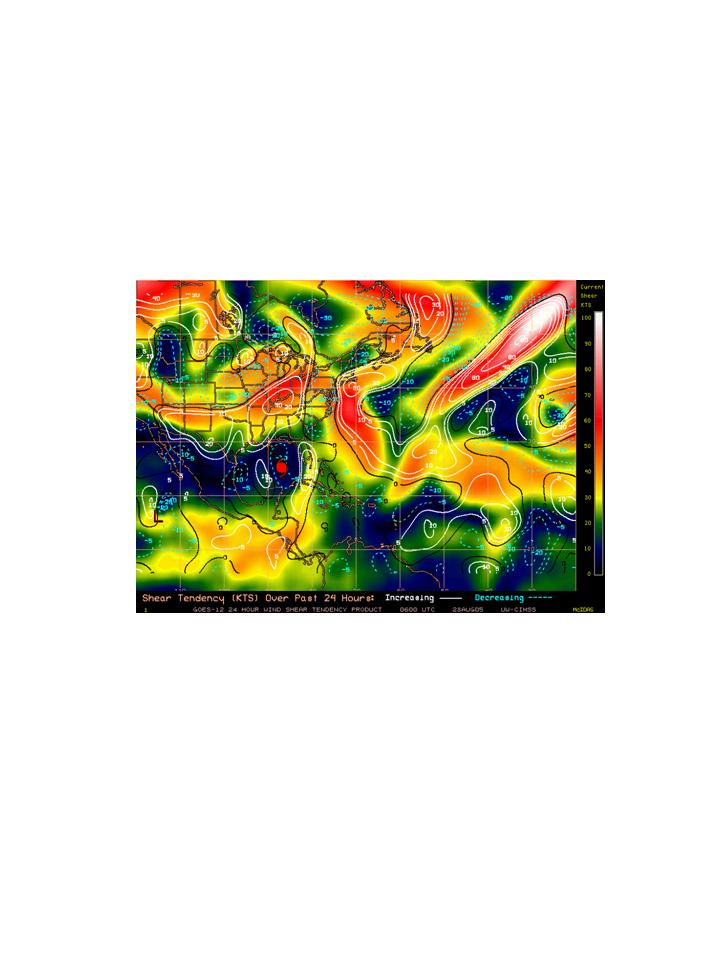
intense hurricanes, and with vertical shear less than 10 kt (Fig. 49) and warm sea-surface
temperatures, it is possible that Katrina could become a category 5 hurricane. Such a
possibility has the potential of being a catastrophic hurricane if landfall occurs at or near
the hurricane (Fig. 48). Such an ocean thermal environment is favorable for sustaining
intense hurricanes, and with vertical shear less than 10 kt (Fig. 49) and warm sea-surface
temperatures, it is possible that Katrina could become a category 5 hurricane. Such a
possibility has the potential of being a catastrophic hurricane if landfall occurs at or near
 New Orleans.
The mission was an NHC-tasked combination SFMR/fix mission. The pattern
 would consist of 105-nm legs, possibly extending them on the northeast side of the storm.
Sondes would be dropped for NHC at all turn points, the inner edge of the eyewall, and at
all fix positions. The initial point would be on the northeast side of the storm, and a
rotating figure-4 pattern would be flown similar to what was flown the previous day (cf.
Fig. 33). In addition to this pattern, a RAINEX coordination pattern would be flown on
the downwind leg on the northeast side of the storm. Several options were considered for
the coordination, including having one P-3 fly one segment of a rainband and the other
flying the remainder of the segment, and having the NRL P-3 fly in trail from N43RF,
would consist of 105-nm legs, possibly extending them on the northeast side of the storm.
Sondes would be dropped for NHC at all turn points, the inner edge of the eyewall, and at
all fix positions. The initial point would be on the northeast side of the storm, and a
rotating figure-4 pattern would be flown similar to what was flown the previous day (cf.
Fig. 33). In addition to this pattern, a RAINEX coordination pattern would be flown on
the downwind leg on the northeast side of the storm. Several options were considered for
the coordination, including having one P-3 fly one segment of a rainband and the other
flying the remainder of the segment, and having the NRL P-3 fly in trail from N43RF,
 both on the same side of the rainband. The rainband structure of the storm was similar to
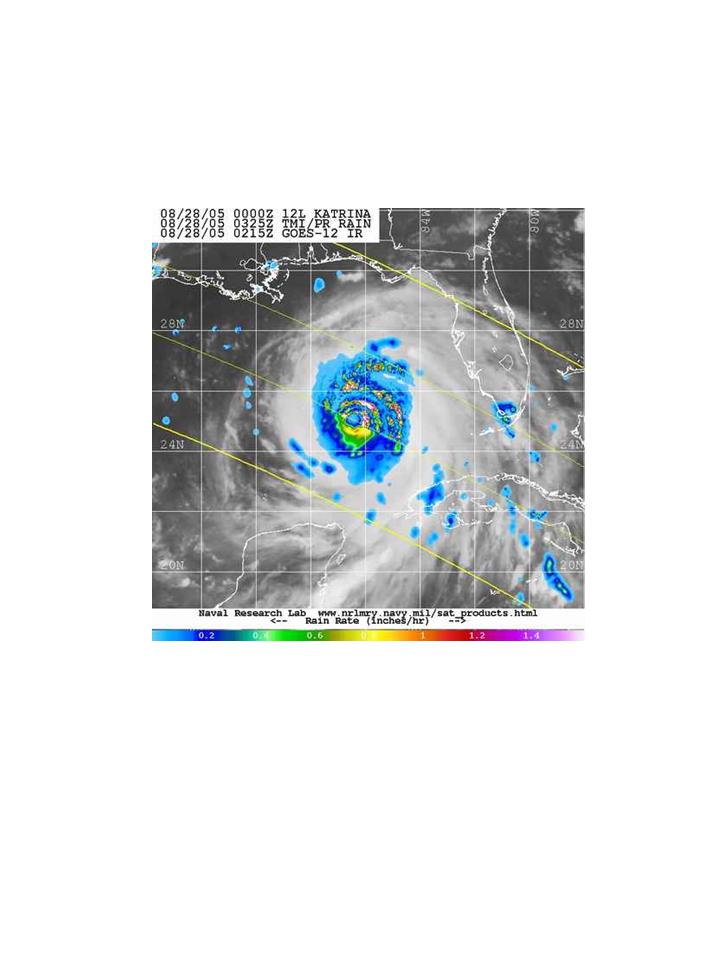
the previous day. An image from the TRMM Precipitation radar (PR) imager before the
flight (Fig. 50) shows several banded features on the northeast side of the storm, with
about a 50-km separation.
both on the same side of the rainband. The rainband structure of the storm was similar to
the previous day. An image from the TRMM Precipitation radar (PR) imager before the
flight (Fig. 50) shows several banded features on the northeast side of the storm, with
about a 50-km separation.
The wind field was very large, with hurricane-force winds extending out 130 km
from the center on the northeast side of the storm. The flight-level winds increased
rapidly on the inbound leg on the northeast side, reaching a maximum of 160 kt on this
side. For the first fix at 1755 UTC, the minimum sea-level pressure was 902 hPa, making
Katrina the fourth-strongest hurricane ever in the Atlantic basin. The eye was symmetric
with a beautiful stadium effect, an eye diameter of about 50 km, swirls in the low-level
clouds indicative of mesovortices in the eye. The eyewall was steeply-sloped too,
slanting back 10 km over a 10-km depth. On the southeast side of the storm, there were
bands about 80 and 160 km from the eye, with stratiform rain in between. The outer of
the two rainbands had convective elements embedded within it, which would probably
make it too risky for the NRL P-3. On the next inbound leg from the southeast there was
a bulge on the LF radar on the east side of the eyewall. Peak flight-level winds on this
side were 140 kt, while peak surface winds were 120 kt. By the time N43RF reached the
eye again, the bulge that was on the east side of the eyewall on the LF radar was now on
the northeast side of the eyewall, and the eyewall showed signs of being polygonal. The
GPS drop at this time measured a pressure of 901.5 hPa. On the next pass from west to
east, the peak flight-level winds were 125 kt on the west side and 150 kt on the east side,
while the peak surface winds were 115 kt on the west side and 120 kt on the east side.
Extending further out on the east side, moderate turbulence was encountered. A 12 m/s
updraft was hit in a band about 150 km from the center on the east side.
At the end of this outbound leg the coordination with the NRL P-3 was begun. N43RF
was to set up outside the band at about 150 km. As N43RF was approaching the
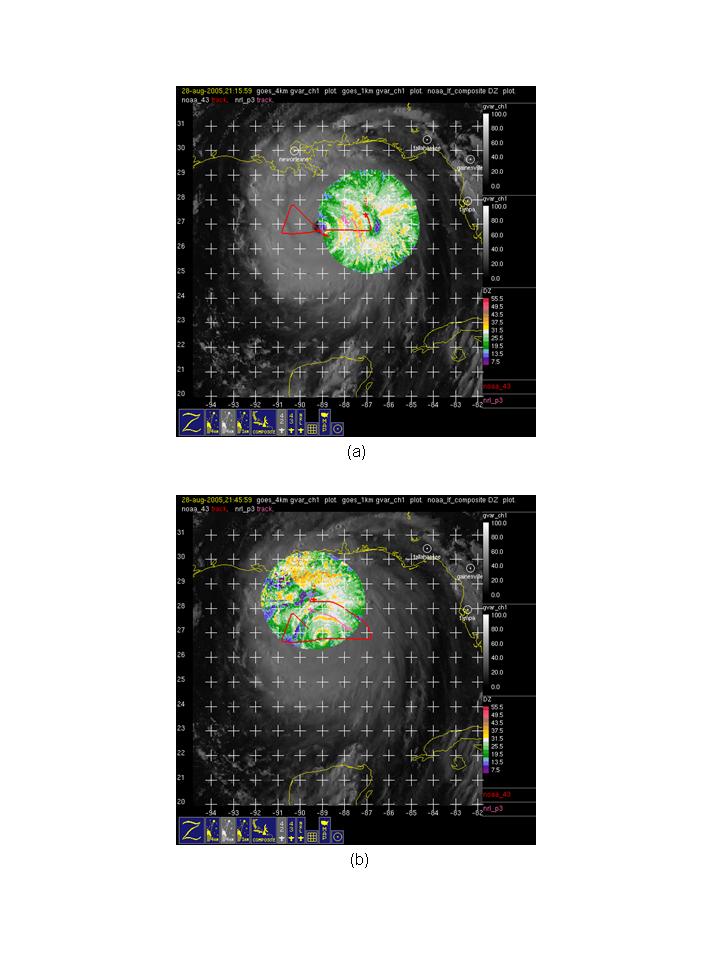 coordination point, it was learned that the NRL P-3 was set up inward of N43RF
(Fig.
51). The NRL P-3 had been flying outside of a band starting on the southeast side of the
storm while N43RF was on the west side of the storm. By following the outside of the
band as it spiraled in toward the center, the NRL P-3 ended up at a smaller radial distance
that N43RF as it finished its west-to-east outbound leg. When N43RF turned downwind,
it followed the rainband along the outer edge, maintaining a distance of between 10 and
20 km. The NRL P-3 was on the inside of the band, providing tail Doppler
measurements for that band as well as a band inward of the NRLŐs flight track. Once the
downwind leg was completed, N43RF needed to loiter north of the storm to provide LF
coverage so the NRL P-3 could navigate its way out of the storm.
After that was completed N43RF resumed its figure-4 pattern, with an inbound
leg from north to south. On this final pass the peak flight-level winds were 140 kt on the
north side and 130 kt on the south side. Peak winds measured by the SFMR were 130 kt
on the north side and 115 kt on the south side. After the final fix was made in the eye,
N43RF circled in the eye for two revolutions, flying straight and level as much as
possible while still maintaining a distance of about 10 km from the inner edge of the
eyewall to provide tail Doppler coverage of the eyewall. The final drop at the center
measured a sea-level pressure of 904 hPa. Upon completion and transmission of the fix
information, N43RF headed outbound toward the northeast to return to MacDill. Once
again the peak flight-level winds in this octant were 160 kt and the peak SFMR winds
were 120 kt. As the aircraft left the storm there was still active convection, as N43RF hit
a 9 m/s updraft 200 km from the storm center.
coordination point, it was learned that the NRL P-3 was set up inward of N43RF
(Fig.
51). The NRL P-3 had been flying outside of a band starting on the southeast side of the
storm while N43RF was on the west side of the storm. By following the outside of the
band as it spiraled in toward the center, the NRL P-3 ended up at a smaller radial distance
that N43RF as it finished its west-to-east outbound leg. When N43RF turned downwind,
it followed the rainband along the outer edge, maintaining a distance of between 10 and
20 km. The NRL P-3 was on the inside of the band, providing tail Doppler
measurements for that band as well as a band inward of the NRLŐs flight track. Once the
downwind leg was completed, N43RF needed to loiter north of the storm to provide LF
coverage so the NRL P-3 could navigate its way out of the storm.
After that was completed N43RF resumed its figure-4 pattern, with an inbound
leg from north to south. On this final pass the peak flight-level winds were 140 kt on the
north side and 130 kt on the south side. Peak winds measured by the SFMR were 130 kt
on the north side and 115 kt on the south side. After the final fix was made in the eye,
N43RF circled in the eye for two revolutions, flying straight and level as much as
possible while still maintaining a distance of about 10 km from the inner edge of the
eyewall to provide tail Doppler coverage of the eyewall. The final drop at the center
measured a sea-level pressure of 904 hPa. Upon completion and transmission of the fix
information, N43RF headed outbound toward the northeast to return to MacDill. Once
again the peak flight-level winds in this octant were 160 kt and the peak SFMR winds
were 120 kt. As the aircraft left the storm there was still active convection, as N43RF hit
a 9 m/s updraft 200 km from the storm center.
Rob Rogers
HRD Field Program director
Return to IFEX calendar page


![[OAR/DOC/NOAA Logos]](../../../oar_noaa_doc_logos3.jpg)