IFEX daily log
Saturday, August 27, 2005
Today was an NHC-tasked mission for a combination of SFMR/fix
responsibilities for 15, 18, and 21 UTC into Hurricane Katrina with N43RF. Katrina had
moved across the southern tip of Florida the day before and was now out over open water
 in the southeastern Gulf of Mexico. The storm had a central pressure of 942 hPa at the
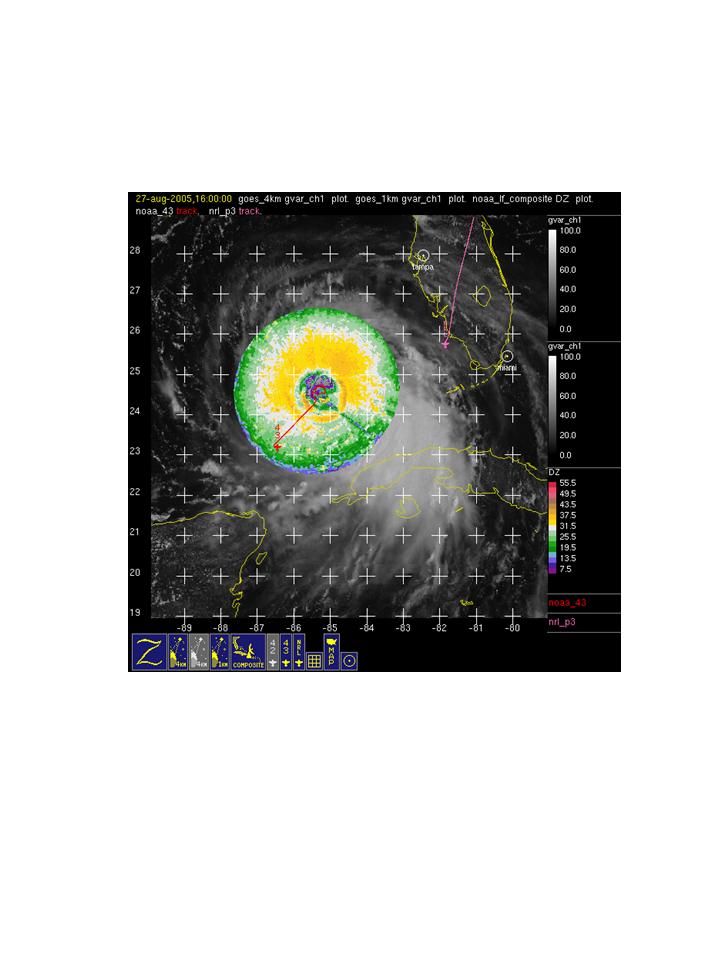
time of takeoff for N43RF at 1330 UTC. Infrared and microwave imagery (Fig. 39)
showed an eyewall with maximum convection on the south side and a principal rainband
spiraling out of the center from the northeast to the southeast side of the storm. Shear
over the system (Fig. 40) was generally light, though there was some shear from the north
in the southeastern Gulf of Mexico. The storm had a central pressure of 942 hPa at the
time of takeoff for N43RF at 1330 UTC. Infrared and microwave imagery (Fig. 39)
showed an eyewall with maximum convection on the south side and a principal rainband
spiraling out of the center from the northeast to the southeast side of the storm. Shear
over the system (Fig. 40) was generally light, though there was some shear from the north
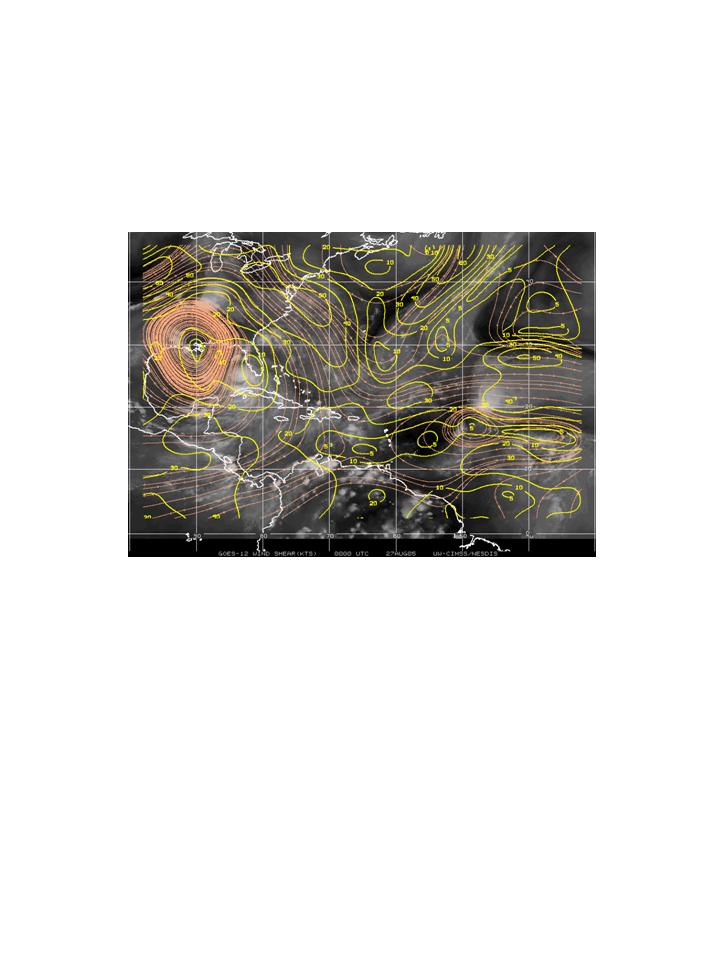 associated with the strong ridge that had persisted over Florida and was now retrograding
to the west. It was this shear pattern that was thought to be largely responsible for the
concentration of rainbands on the east side of the storm.
associated with the strong ridge that had persisted over Florida and was now retrograding
to the west. It was this shear pattern that was thought to be largely responsible for the
concentration of rainbands on the east side of the storm.
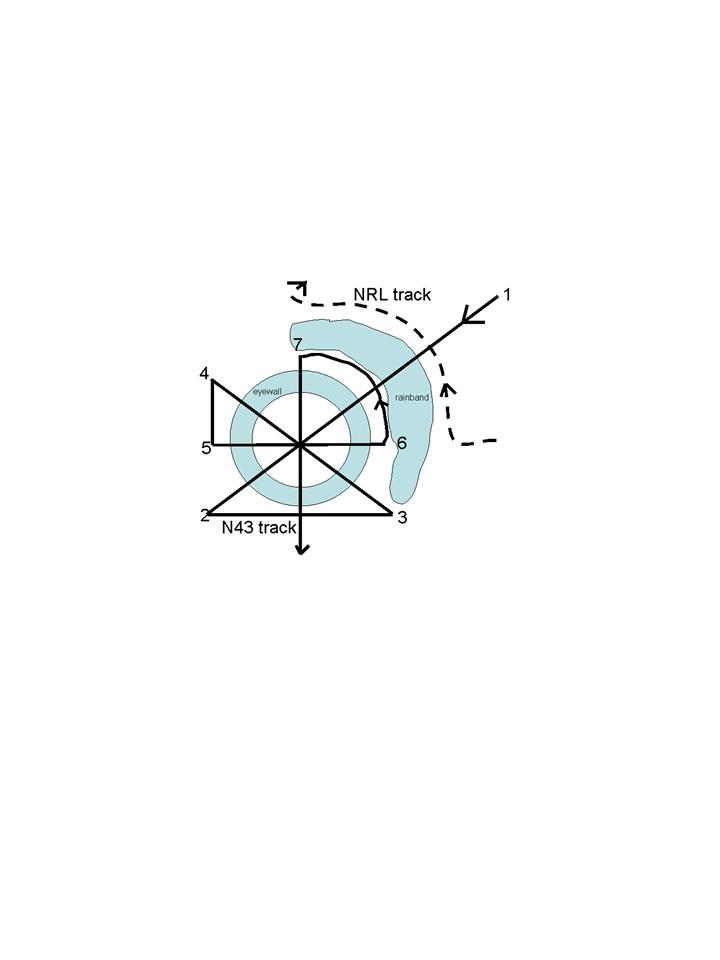
The plan called for N43RF to conduct a rotating figure-4 survey pattern, with the
initial point set up 80 nm northeast of the center of the storm (cf. Fig. 33). After the third
 penetration, on the outbound leg toward the east, N43RF would link up with the NRL P-3
to coordinate on the rainband in the northeast quadrant of the storm. Both aircraft would
fly on the outside of this band, with NRL trailing N43RF by about 5-10 nm.
penetration, on the outbound leg toward the east, N43RF would link up with the NRL P-3
to coordinate on the rainband in the northeast quadrant of the storm. Both aircraft would
fly on the outside of this band, with NRL trailing N43RF by about 5-10 nm.
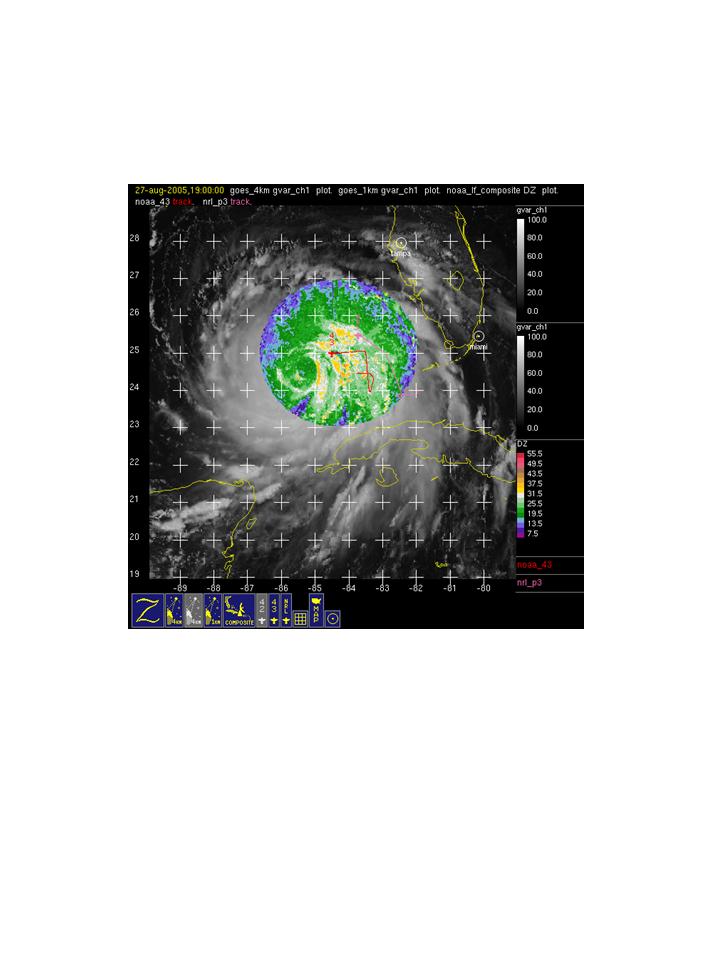
 Shortly after takeoff WSR-88D imagery from the Key West radar (Fig. 41) showed
widespread areas of mixed convective and stratiform rainbands on the east side of the
storm. Lower fuselage radar imagery from N43RF (Fig. 42) showed a concentric eyewall
pattern for Katrina. The inner eye had a diameter of about 10 nm while the outer eye had
a diameter of about 50 nm. This pattern was also seen in infrared satellite imagery (Fig.
Shortly after takeoff WSR-88D imagery from the Key West radar (Fig. 41) showed
widespread areas of mixed convective and stratiform rainbands on the east side of the
storm. Lower fuselage radar imagery from N43RF (Fig. 42) showed a concentric eyewall
pattern for Katrina. The inner eye had a diameter of about 10 nm while the outer eye had
a diameter of about 50 nm. This pattern was also seen in infrared satellite imagery (Fig.
 43), which showed the double-eyewall structure, with the inner eyewall evident as a very
small area of cold cloud tops on the southeast side of the eye.
Within the eye on the first pass, it was clear that the inner eyewall was beginning
to disintegrate and the outer eyewall was becoming the primary eyewall. Peak flight-
level winds on the northeast side of the storm were about 85 kt, while the peak surface
winds were about 80 kt. The outer eyewall on the northwest side was open, based on
lower-fuselage radar. On the southwest side of the outer eyewall peak flight-level winds
were 80 kt and peak surface winds were 70 kt. The central pressure from a fix at 1513
UTC was 949 hPa, measured from a GPS dropwindsonde.
As the aircraft turned downwind to the southeast side of the storm, LF imagery
showed multiple lines of isolated convective cells, separated by about 15 nm. Moderate
turbulence was associated with these bands, as the aircraft at one point hit a 10 m/s
updraft. On the ensuing inbound leg on the southeast side of the storm, the maximum
flight-level winds were 100 kt while the maximum SFMR winds were 95 kt, both
associated with the outer eyewall. Once N43RF reached the east side of the storm, a
period of coordination was planned between N43RF and the NRL P-3 (cf. Fig. 33). The
two aircraft were going to fly a coordinated leg along one of the rainbands seen in the
northeast section of the storm. While on this leg, N43RF would drop sondes with an
average spacing of about 20-30 km. The coordination between the two aircraft was
moderately successful. The tracks of the two aircraft were separated by about 50-75 km
43), which showed the double-eyewall structure, with the inner eyewall evident as a very
small area of cold cloud tops on the southeast side of the eye.
Within the eye on the first pass, it was clear that the inner eyewall was beginning
to disintegrate and the outer eyewall was becoming the primary eyewall. Peak flight-
level winds on the northeast side of the storm were about 85 kt, while the peak surface
winds were about 80 kt. The outer eyewall on the northwest side was open, based on
lower-fuselage radar. On the southwest side of the outer eyewall peak flight-level winds
were 80 kt and peak surface winds were 70 kt. The central pressure from a fix at 1513
UTC was 949 hPa, measured from a GPS dropwindsonde.
As the aircraft turned downwind to the southeast side of the storm, LF imagery
showed multiple lines of isolated convective cells, separated by about 15 nm. Moderate
turbulence was associated with these bands, as the aircraft at one point hit a 10 m/s
updraft. On the ensuing inbound leg on the southeast side of the storm, the maximum
flight-level winds were 100 kt while the maximum SFMR winds were 95 kt, both
associated with the outer eyewall. Once N43RF reached the east side of the storm, a
period of coordination was planned between N43RF and the NRL P-3 (cf. Fig. 33). The
two aircraft were going to fly a coordinated leg along one of the rainbands seen in the
northeast section of the storm. While on this leg, N43RF would drop sondes with an
average spacing of about 20-30 km. The coordination between the two aircraft was
moderately successful. The tracks of the two aircraft were separated by about 50-75 km
 (Fig. 44) around an outer rainband that was spiraling around to the north side of the
storm. The NRL P-3 was on average about 10-20 km behind N43RF, but this is not a
problem. The tail radar measurements of the rainband as well as the dropsonde
measurements should prove to be useful data.
On the final inbound leg on the northwest side of the storm, the eyewall was still
open on this side of the storm. The minimum sea-level pressure from this pass from a
GPS drop was about 945 hPa, indicating that the storm was beginning to intensify slowly.
All in all it was a successful mission. The SFMR worked well, with minimal noise, the
Doppler radar analysis products were produced and transmitted in near-real time,
dropsondes worked fine, and cloud physics data were collected.
(Fig. 44) around an outer rainband that was spiraling around to the north side of the
storm. The NRL P-3 was on average about 10-20 km behind N43RF, but this is not a
problem. The tail radar measurements of the rainband as well as the dropsonde
measurements should prove to be useful data.
On the final inbound leg on the northwest side of the storm, the eyewall was still
open on this side of the storm. The minimum sea-level pressure from this pass from a
GPS drop was about 945 hPa, indicating that the storm was beginning to intensify slowly.
All in all it was a successful mission. The SFMR worked well, with minimal noise, the
Doppler radar analysis products were produced and transmitted in near-real time,
dropsondes worked fine, and cloud physics data were collected.
Rob Rogers
HRD Field Program director
Return to IFEX calendar page


![[OAR/DOC/NOAA Logos]](../../../oar_noaa_doc_logos3.jpg)