
| Lead Scientist | Jason Dunion |
| Dropsonde Scientist | Pete Black |
| Aircraft Commander | Michele Finn |
| Pilots | John Longenecker Will Odell |
| Project Manager | Jack Parrish |
| Flight Meteorologist | Barry Damiano |
| Equipment Specialist | Gordon Kitson |
| Electronics Technician | John Hill Bobby Peek Mark Rogers |
Mission Plan :
NOAA 49RF will participate in a 2-plane (1 P-3, G-IV) Saharan Air Layer Experiment (SALEX) around Hurricane Helene as part of IFEX. The G-IV will leave Barbados at 1445 UTC and will recover back at Barbados at 2140 UTC. The flight track will take the G-IV on a clockwise circumnavigation of the TC and 23 GPS dropwindsondes will be deployed (Fig. 1).
Mission Summary :
Synoptic Situation,br> Pre-Hurricane Helene emerged from the coast of North Africa as a vigorous AEW on 12 September (Fig. 2).
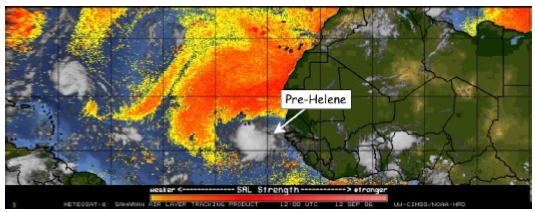
Figure 2 also shows that a very large Saharan Air Layer (SAL) outbreak was located to the north and west of this system at this time. The NASA DC-8 flew a single mission into Tropical Depression 8 (pre-Hurricane Helene) on 12 August from Sal, Cape Verde. This mission was part of the NAMMA field program and the main objectives included cyclogenesis, Saharan Air Layer/dust, and microphysics studies. The disturbance subsequently tracked to the west-northwest around the southeast periphery of a deep layer ridge over the next several days (Fig. 3, left),
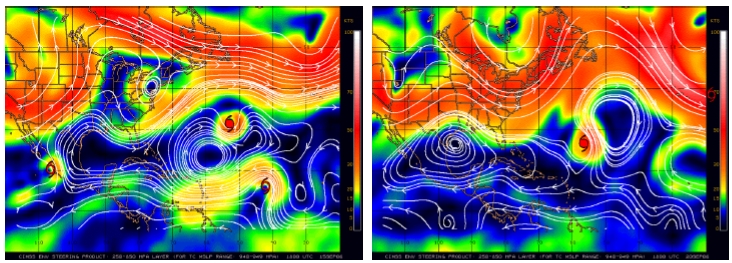
which brought it into the suppressive influence of SAL and within range of NOAA G-IV and P-3 SALEX missions. The G-IV flew a set of back-to-back one-plane SALEX missions from Barbados on 15 and 16 September while Helene was still out of range of the P-3. The P-3 (NOAA-42) was deployed to Barbados on 16 September when it became clear that the storm would be in range to conduct P-3 SALEX missions from Barbados. A first-ever G-IV/P-3 coordinated hurricane research mission (SALEX) was completed on 18 September. Although Helene continued moving northwest through the now bifurcated subtropical ridge to its north (Fig. 3, right), it had tracked far enough to the west to remain within range of a follow on coordinated set of P-3/G-IV SALEX missions from Barbados. At 1800 UTC during the day of the 20060920n mission, Hurricane Helene was a 90 kt Category 2 hurricane and located at ~26.3 N 56.7 W. Vertical wind shear analyses from UW-CIMSS suggested that the shear over Helene was increasing north of the storm and was now ~10-20 kt (Fig. 4, left). This shear was likely being enhanced by the remnants of an upper-level cold low to its west that was located at ~27 N 67 W [Fig. 4].

b) Mission Specifics
The flight plan was designed to initially sample west and north of the storm at
an optimal flight level of 41,000-45,000 ft. Subsequent legs around the east
and south sides of the storm investigated a large SAL outbreak east of Helene
(Fig. 5, SAL 2; drops 8-19) and a dry SAL intrusion that was wrapping in around
the southwest and southeast quadrants of the storm [Figs. 5 (SAL 1) & 6 (left),
drops 20-23].
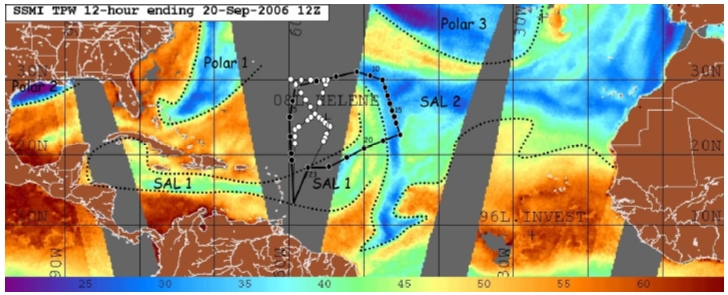
A SSE-NNW GPS dropsonde sequence was also coordinated with overpasses (within 90-150 min) by NASA's CloudSat ands Calipso satellites (Fig. 6, right; drops 11-18). This coordination provided an opportunity to compare satellite retrievals of precipitation (CloudSat) and Saharan dust (Calipso) with GPS dropsonde data across an extended segment of the SAL 2 outbreak (Figs. 5 & 6). Although a delay in the G-IV takeoff time resulted in a fairly large time gap between the GPS dropsonde sequence and the satellite overpasses, the relatively static environment of the SAL (Fig. 5, SAL 2) should still make for fairly robust comparisons between the platforms. All GPS dropsondes were transmitted in real-time, so that data from the sondes could be assimilated into the NOAA GFS model.
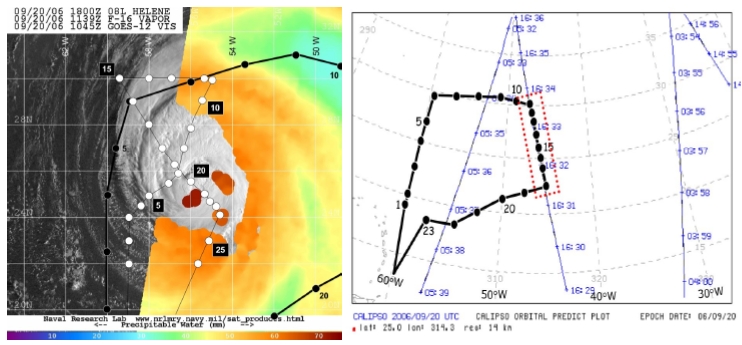
Takeoff was at 1445 UTC from Barbados. Zoomed SSMIS TPW imagery from the F-16 DMSP satellite from 1139 UTC suggested that dry SAL air [Fig. 6 (left), <45 mm TPW; green to blue shading] was surrounding Helene in what appeared to be band-like patterns around the storm (Fig. 6, left). This was also noted in TPW imagery from the prior day. Four extended legs comprised this G-IV SALEX flight pattern around Hurricane Helene:
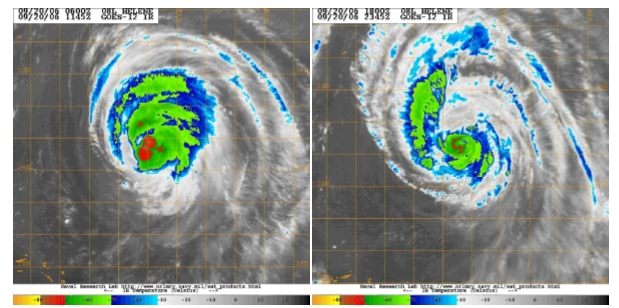
Figure 7 shows GOES-12 infrared imagery of Hurricane Helene in the morning and evening of day of the mission. The convection associated with the storm became relatively shallow and asymmetric throughout the day and was likely being affected by the combination of strong midlevel winds and dry SAL air that were noted during the mission.
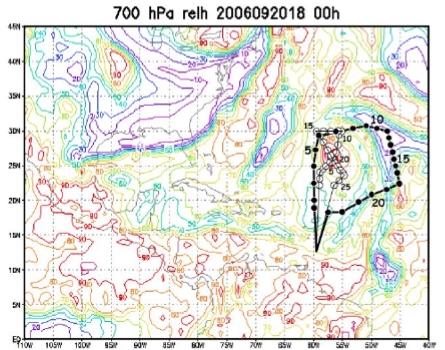
Figure 8 shows the 20060920n flight track overlaid on the 20 September 1800 UTC GFS model analysis of 700 hPa RH. The GFS model analysis appeared to accurately depict the spatial extent of the SAL that was surrounding Helene (Fig. 5, SAL 1 & 2; Fig. 8, 700 hPa RH of <50%). However, it appears that the model was significantly overestimating the 700 hPa moisture around the storm, particularly in Helene's western, northern, and southern semicircles.
Problems :
There were no major problems related to this flight. Although 'codeless' GPS dropsondes mainly from 2000-2004 were used, only two dropsondes failed out of the 23 that were dropped.
Mission Data :
Page last updated Nov. 9, 2006
Return to Mission page.