
| LPS | Rob Rogers |
| Radar Scientist | Paul Leighton |
| Workstation Scientist | Mike Black |
| IWRAP Scientist | Paul Chang (NESDIS) |
| IWRAP Scientist | NESDIS Scientist |
| SFMR Scientist | UMass Engineer |
| Pilots | Tom Strong Joe Girimonte |
| Flight Engineers | Joe Kippel |
| Navigator | Joe Bishop |
| Flight Director | Marty Mayeaux |
| Engineers | Sean McMillan Bill Olney Chuck Rasco |
Mission Plan :
This was a two-plane (1 P-3, G-IV) SALEX mission into Hurricane Helene, which was a Category 2 hurricane at takeoff. The plan for the P-3 called for setting up the IP about 200 nm southwest of the storm. Fly a southwest-northeast leg to the center, then an outbound leg to the north, then downwind to a point northwest of the center. Then fly an inbound leg southeast to the center and outbound to a point southeast of the center, completing the pattern. The P-3 aircraft would fly at 16,000 ft or higher, dropping sondes at all turn points, midpoints of legs, and two center passes. A drop may also be made in the eyewall, and in any areas of dry air along the legs. Four AXBT's would also be dropped on the north and west side of the storm.
Mission Summary :
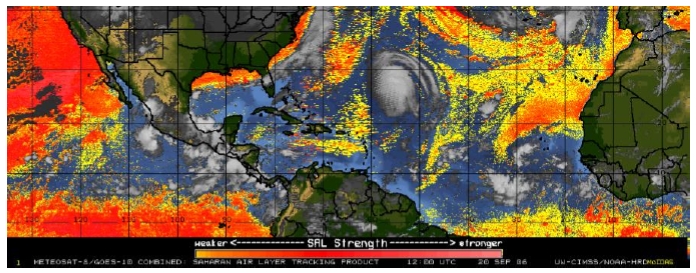
Takeoff from Barbados was at 1405 UTC. Helene continued to maintain hurricane status. Visible imagery at the time of takeoff (Fig. 1) showed deep convection around the center but no apparent eye. Bands of convection were also spiraling around from the southwest to the north and northeast side of the storm. Most of the convection appeared to be located on this side, with little indication of convection on the southeast side. The upper-level outflow appeared to be restricted on the southwest side and elongated on the northeast side. All of these features from the satellite image suggested that Helene was encountering some light to moderate vertical shear, which was also supported by the CIMSS vertical shear analysis shown in Fig. 2.
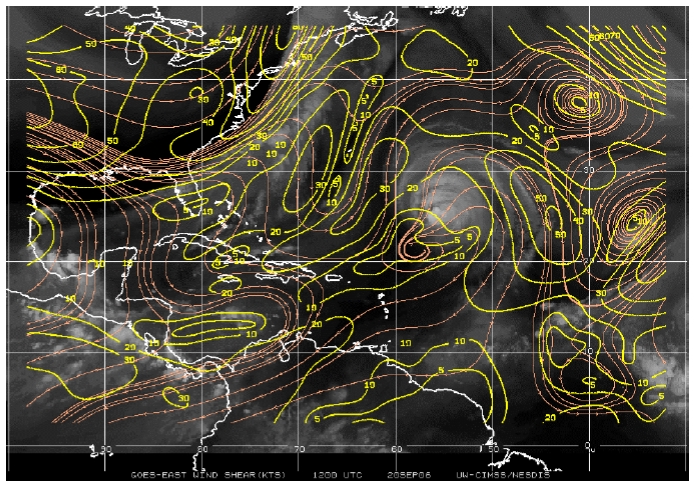
This figure indicates that Helene, which at the time was moving slowly toward the west-northwest, was in a region of approximately 10 kt of southwesterly shear. The shear was in association with an upper-level cyclonic circulation whose axis was located at 67 W, about 1000 km to the west of Helene. Also apparent from the visible image in Fig. 1 is an area of little or no low-level cloudiness west and south of the circulation of Helene. This suggests the presence of dry and/or stable air in this region. This is supported by the presence of lowlevel stable air indicative of the Saharan Air Layer (SAL) on the west and southwest side of the circulation of Helene (Fig. 3).
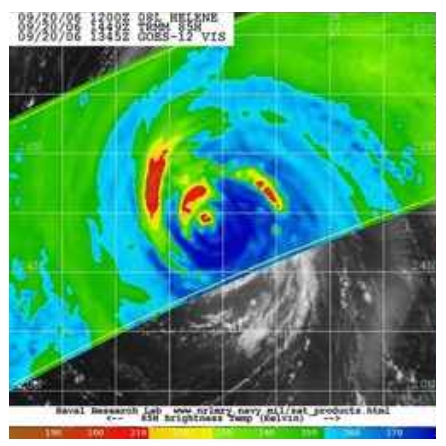
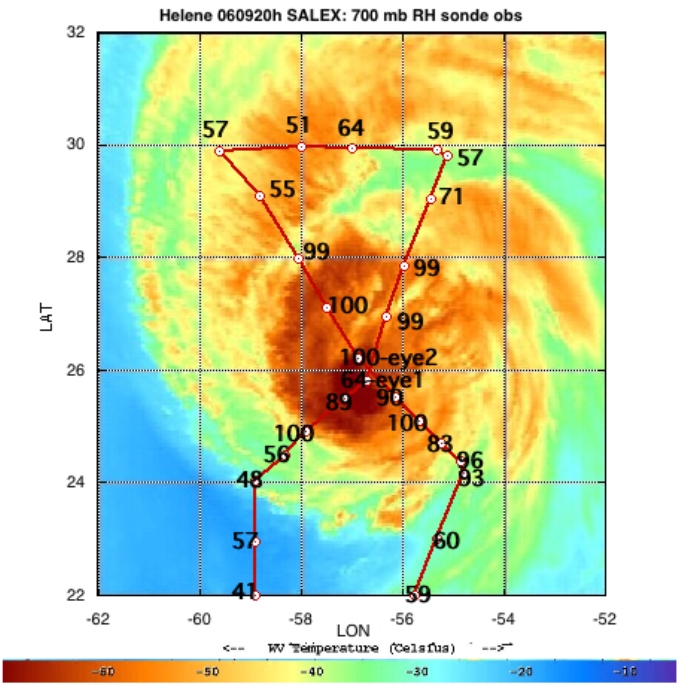
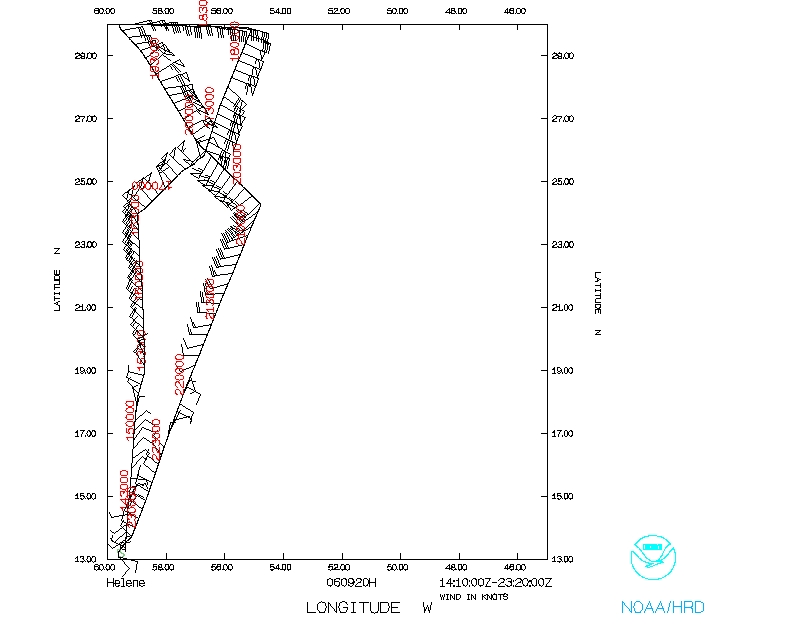
Upon arriving at the IP on the southwest side of the storm, it was apparent that convection was limited around the storm. This was supported by TRMM 85 GHz microwave imagery (Fig. 4), which showed that significant ice scattering was only located in bands on the northwest side of the storm and in a narrow band on the northeast side. The flight track and drop locations, including relative humidity at 700 hPa from the drops, is shown in Fig. 5 overlain with water vapor brightness temperature at 1645 UTC 20 September. A series of drops on the way to the IP showed dry air with relative humidity as low as 41% southwest of the storm circulation. This dryness is consistent
with the satellite-derived water vapor brightness temperature field and supports the presence of SAL air as indicated in Fig. 3. The pattern was modified from the original plan to allow for an outbound leg to the northeast rather than the north (Fig. 5). Once the 30 degree N latitude was reached, the aircraft turned to the west and performed the rest of the planned pattern. In general, within 200 km of the storm center, the air at 700 hPa was moist, with relative humidity greater than 85-90%. On the north side of the storm outside of 200 km, though, the air became dry again. On the northeast side during the outbound leg, relative humidity at 700 hPa dropped to below 60%. This was consistent with the ribbon of dry mid-to upper-level air (indicated by high-water vapor brightness temperature) seen entering the system from the northeast and spiraling inward to the northwest side of the storm. On the northwest side of the storm, the 700 hPa relative humidity remained below 60% even within regions of lower water vapor brightness temperature (i.e., more moist in the mid- to upper-levels). As the core was approached from the northwest, though, the 700 hPa relative humidity increased again to near 100%. It was on this side of the storm that the most significant turbulence was encountered, even though that turbulence was comparatively modest by other storms' standards. The strongest updraft/downdraft couplet encountered during the entire flight was about 6-8 m s-1 up and 4-6 m s-1 down. After reaching the final point, additional drops were released during the ferry back to Barbados to sample possible dry air on the southeast side of the storm. The relative humidity at 700 hPa again dropped below 60% more than 200 km from the center of the storm.
The structure of the wind field in the storm suggested a system that was experiencing vertical shear. For a significant distance (about 5 minutes or 35 km) during the inbound SW leg, the SFMR winds were higher than the flight-level winds. At this point the SFMR winds were 72 kt, while the flight-level winds were 56 kt. On this leg it appeared that there was a double eyewall, though there was no clear radial gradient in flight-level winds in this quadrant. The peak flight-level winds in the inner eyewall on the southwest side were 56 kt, while the SFMR winds were 50 kt. The central pressure from a GPS drop was 960 hPa. On the northeast side the flight-level winds were much stronger than the SFMR winds. This indicates a shear between the flight-level and the surface. On the northwest side the peak flight-level winds of 84 kt were encountered 91 nm (about 150 km) from the center. The SFMR winds were about 80% of the flight-level winds here. A smaller ratio was seen on the southeast side of the storm, where the peak flight-level winds were 68 kt and the SFMR was 45 kt about 100 km from the center. The maximum of surface winds relative to flight-level winds on the southwest side and the inverse on the northeast and southeast side of the storm suggests that northwesterly environmental flow was present at the surface and/or southeasterly environmental flow was present at flight level. Further analysis is needed to verify this hypothesis. The storm was considerably weaker today than two days ago. The peak flightlevel and surface winds within the eyewall were 80 and 65 kt, respectively. Despite these observations, NHC kept the storm at 90 kt, based on the pressure-wind relations hip derived from the first center drop pressure of 960 hPa. There were no wind measurements that supported keeping Helene at a strong Category 2, though. Sea-surface temperatures from three AXBT's were between 27 and 28 deg C.
Problems :
There were no major problems in the mission. Almost all of the sondes worked fine (26 out of 27), and three of the four planned AXBT's worked. The SFMR's seemed to perform fine, as did the tail radar. The lower fuselage radar was not functional during the flight, however.
Robert Rogers
10/1/06
Mission Data:
Data Plots | ||
 Flight track |
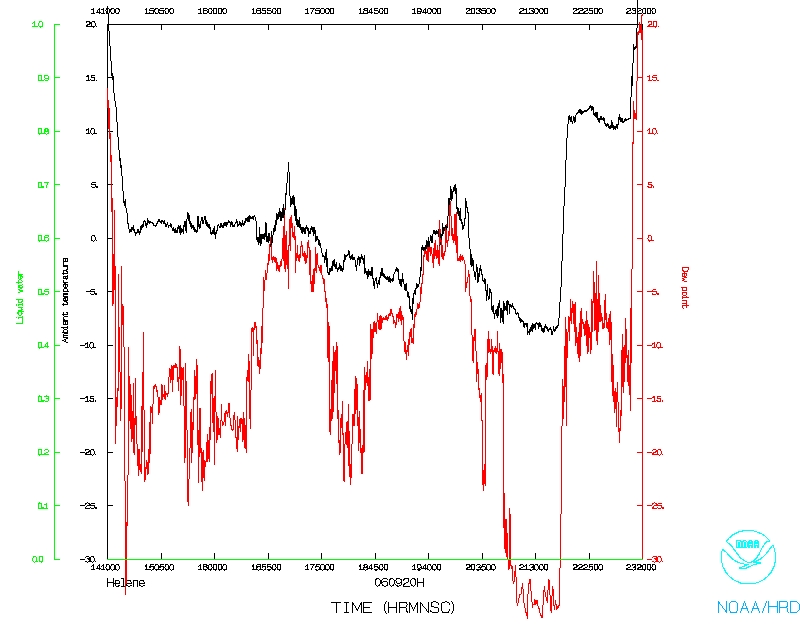 Temperature and Moisture |
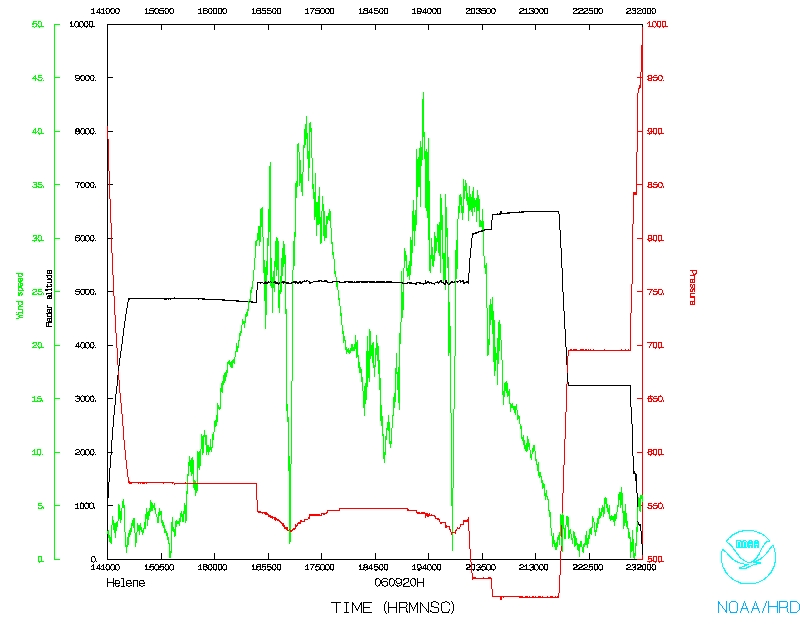 Wind and Atlitude |
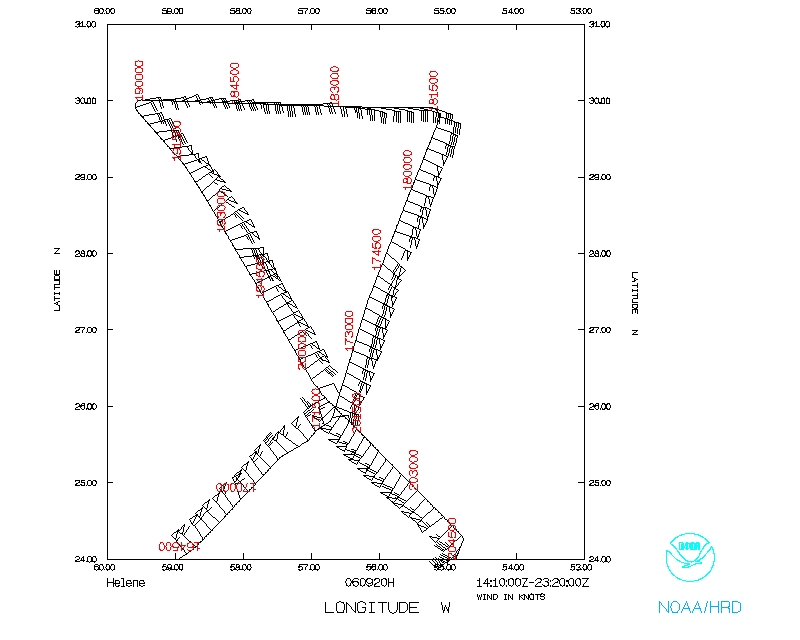 Flight track detail |
||