| LPS | Jason Dunion |
| Workstation Scientist | Paul Leighton |
| Radar Scientist | Rob Rogers |
| IWRAP Scientist | Paul Chang |
| IWRAP Scientist | NESDIS Scientist |
| SFMR Scientist | UMass Engineer |
| Pilots | Tom Strong
Joe Girimonte |
| Flight Meteorologist | Marty Mayeaux |
| Flight Engineer | Joe Kippel |
| Navigators | Tim Gallagher
Joe Bishop |
| Electronics Technicians |
Sean McMillan Bill Olney Chuck Rasco |
Mission Plan :
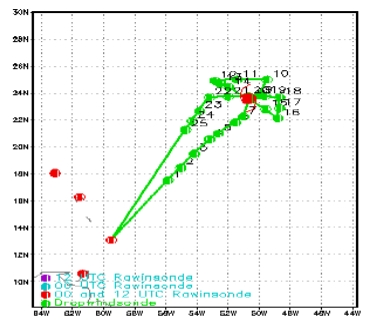
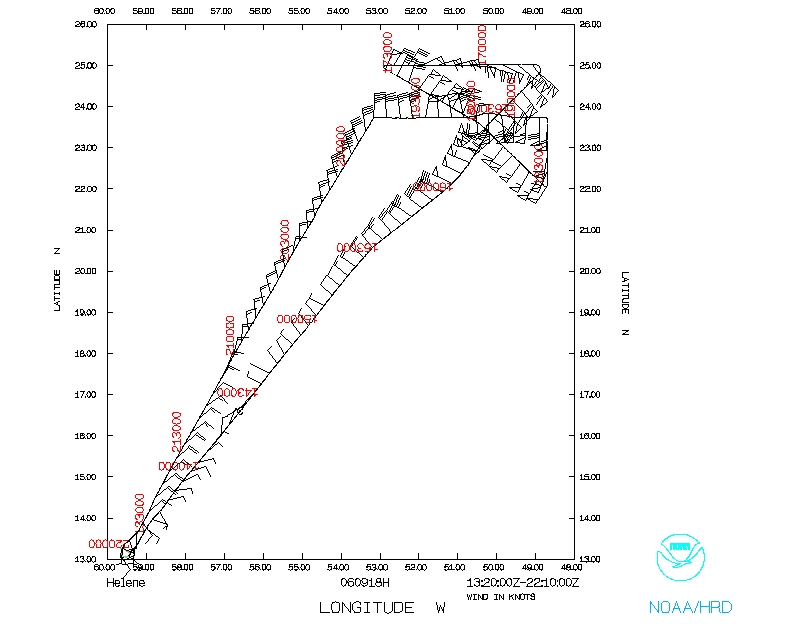
NOAA 42RF will participate in a two-plane (1 P-3, G-IV) Saharan Air Layer Experiment (SALEX) into Hurricane Helene as part of IFEX. The P-3 will leave Barbados at 1320 UTC and will recover back at Barbados at 2215 UTC. The flight plan will include an IP ~220 nm southwest of the storm; a southwest-northeast inbound leg to the center; an outbound leg (~130 nm) to the northeast; an east-west downwind leg (~250 nm) to a point northwest of the center; an inbound leg (~190 nm) southeast to the center; an outbound leg (~130 nm) to a point southeast of the center; a south-north leg to a point east of the center; an east-west inbound leg to the center; and an east-west outbound leg (~140 nm) to a point west of the center, completing the pattern.
The P-3 will fly at 16,000-20,000 ft, dropping GPS dropwindsondes at all turnpoints, midpoints of legs, and the first and third center passes. GPS dropwindsondes may also be launched in the eyewall as well as in areas of moisture gradients associated with the Saharan Air Layer (SAL). A total of six AXBTs will also be dropped at drop points 8 (center), 10-12, 20 (center), and 22. The flight track and 25 GPS dropwindsonde points are shown in Fig. 1.
Mission Summary :
a) Synoptic Situation
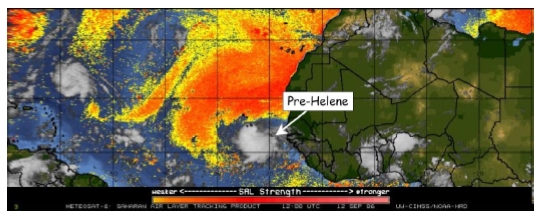
Pre-Hurricane Helene emerged from the coast of North Africa as a vigorous AEW
on 12 September (Fig. 2). Figure 2 also shows that a very large Saharan Air
Layer (SAL) outbreak was located to the north and west of this system at this
time. The NASA DC-8 flew a single mission into Tropical Depression 8
(pre-Hurricane Helene) on 12 August from Sal, Cape Verde. This mission was
part of the NAMMA field program and the main objectives included cyclogenesis,
Saharan Air Layer/dust, and microphysics studies. The disturbance subsequently
tracked to the west-northwest around the southeast periphery of a deep layer
ridge (Fig. 3, left) over the next several days, which brought it into the
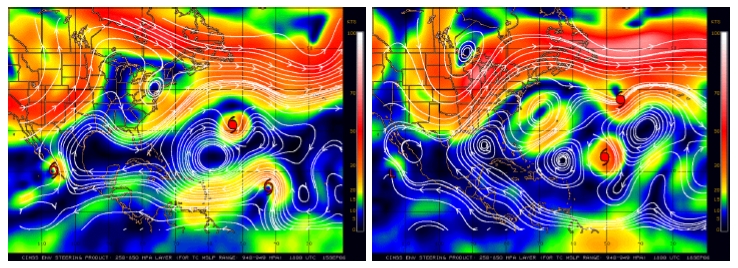
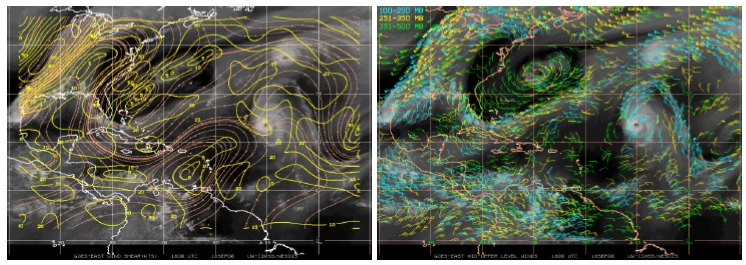
suppressive influence of SAL and within range of NOAA G-IV and eventually P-3 SALEX missions. The G-IV flew a set of back-to-back one-plane SALEX missions from Barbados on 15 and 16 September while Helene was still out of range of the P-3. Although Helene continued moving northwest through a weakness in the subtropical ridge to its north (Fig. 3, right), it had tracked far enough to the west to be within range of P-3 SALEX missions from Barbados. At 1800 UTC during the day of the 20060918h mission, Hurricane Helene was a 110 kt Category 3 hurricane and located at ~23.6 N 50.7 W. Hurricane Gordon was located on the northeast edge of the bifurcated ridge that Helene was tracking through and was ~1600 km north-northeast of Helene (Fig. 3, right). Vertical wind shear analyses from UW-CIMSS suggested that the shear over Helene had increased slightly to ~10-15 kt (Fig. 4, left) and was likely being enhanced by the deep layer ridge to its west [Figs. 3 (right) and 4 (right)].
b) Mission Specifics
The flight plan was designed to investigate a large SAL outbreak that was
positioned west and north of Hurricane Helene (Fig. 5, SAL 1) and the moist
tropical environment immediately surrounding Helene [Figs. 5 & 6 (TPW >45 mm;
yellow to red shading)]. The flight plan called for sampling of the inner core
region of the storm, as well as an inner band of dry SAL air located ~350 km
west of the storm center (Fig. 6). The mission was conducted at an optimal
flight level of 17,000-20,000 ft, so that GPS dropwindsonde vertical profiles
through the SAL could be maximized. All GPS dropwindsondes were transmitted in
real-time, so that data from the sondes could be assimilated into the NOAA GFS
model. Takeoff was at 1320 UTC from Barbados. During the mission, zoomed AMSR-E
TPW imagery from NASA's Aqua satellite from 1641 UTC was downloaded from NRL's
tropical cyclones web site and suggested that dry SAL air (Fig. 6, <45 mm TPW;
green to blue shading) was surrounding Helene in what appeared to be band-like
patterns around the storm (Fig. 6). The P-3 sampled one of the inner dry SAL
bands, while the G-IV concurrently sampled the outer bands of dry air.
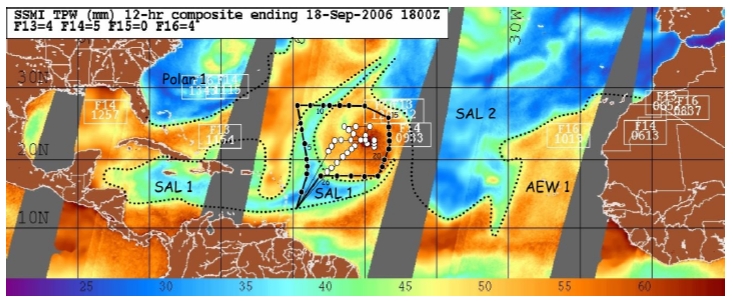
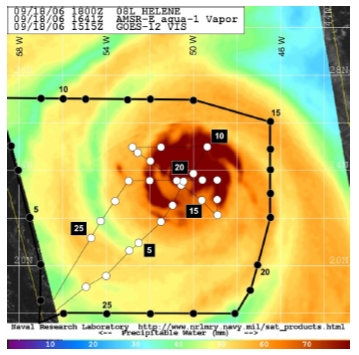
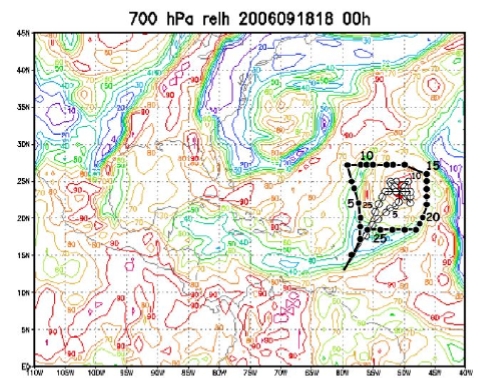
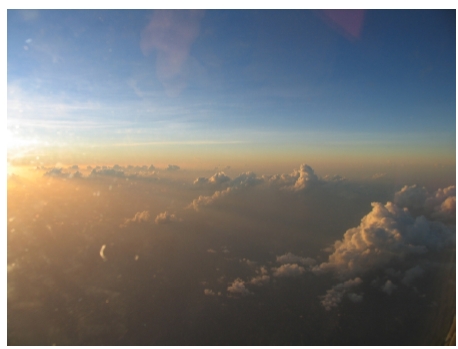
Figure 7 shows the 20060918h flight track overlaid on the 18 September 1800 UTC GFS model analysis of 700 hPa RH. The GFS model analysis appeared to accurately depict the spatial extent of the SAL that was surrounding Helene (Fig. 5, SAL 1 & 2; Fig. 7, 700 hPa RH of <50%), although a more in depth study using the P-3 and G-IV GPS dropsondes is needed to assess the accuracy of the magnitude of the GFS-analyzed mid-level moisture. Figure 8 shows a photo of the SAL's suspended dust taken during the end of the mission. The 20060918h and 20060918n SALEX missions represented the first-ever coordinated hurricane research missions between a P-3 and the G-IV aircraft.
Problems :
There were no major problems related to this flight. Minor problems included: 5 of the 30 'Codeless' GPS dropwindsondes (mainly from 2000-2004) failed during the mission;
Mission Data:
Data Plots | ||
 Flight track |
 Temperature and Moisture |
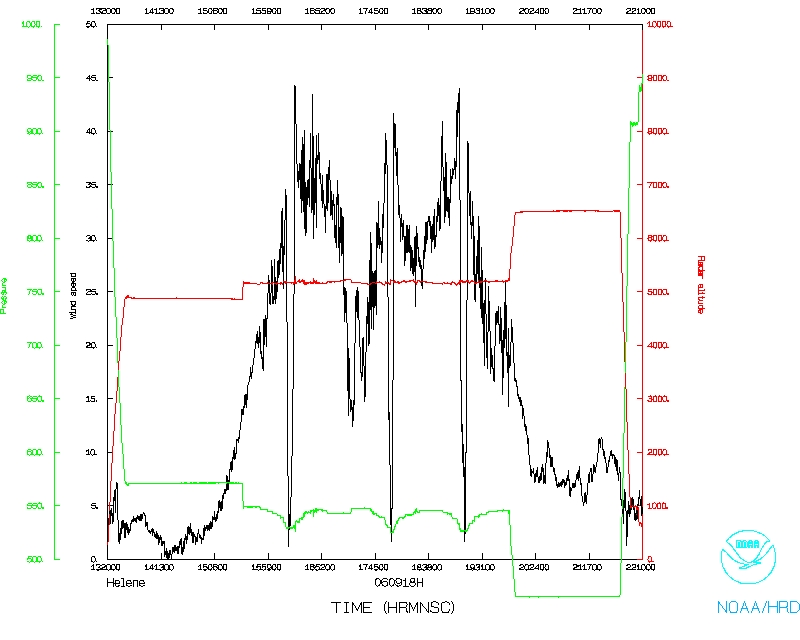 Wind and Atlitude |
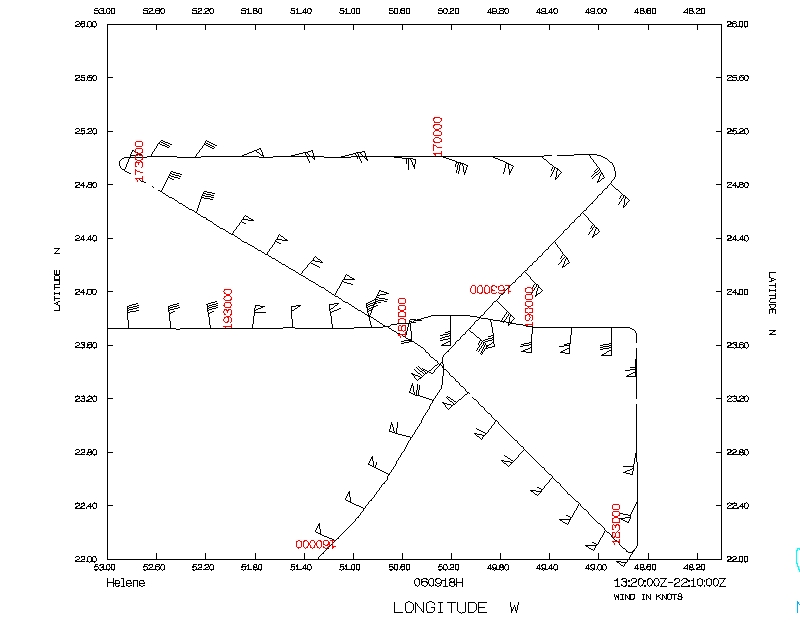 Flight track detail |
||