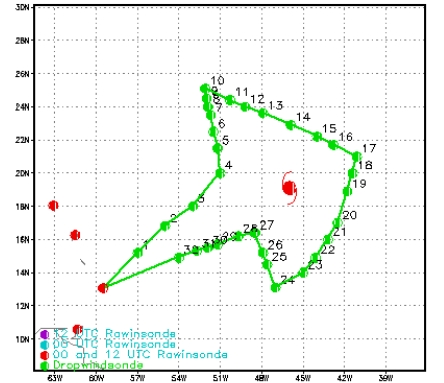
Fig. 1: Flight track (green line) for SALEX mission 060916n. The GPS dropsonde points (32 total) are indicated by green circles.
| Lead Scientist | Jason Dunion |
| Dropsonde Scientist | Peter Black |
| Visiting Scientist | Chidong Zhang (U Miami) |
| Aircraft Commander | Michele Finn |
| Pilots | John Longenecker Will Odell |
| Project Manager | Jack Parrish |
| Flight Meteorologist | Barry Damiano |
| Equipment Specialist | Gordon Kitson |
| Electronics Technician | John Hill
Bobby Peek Mark Rogers |
Mission Plan :
NOAA 49RF will fly a Saharan Air Layer Experiment (SALEX) around Hurricane Helene as part of IFEX. The G-IV will leave Barbados at 1430 UTC and will recover back at Barbados at 2130 UTC. This mission will be coordinated with the overpass of NASA's CloudSat and Calipso satellites. The flight track will take the G-IV on a clockwise circumnavigation of the TC and is shown in Fig. 1, along with the 32 GPS dropwindsonde points.
Mission Summary :
a) Synoptic Situation
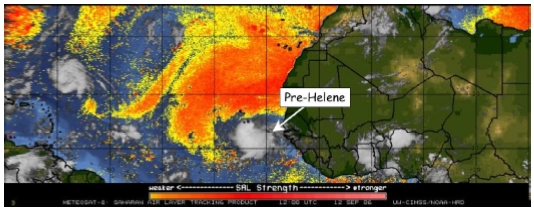
Pre-Hurricane Helene emerged from the coast of North Africa as a vigorous
African Easterly Wave (AEW) on 12 September (Fig. 2). Figure 2 also shows that
a very large Saharan Air Layer (SAL) outbreak was located to the north and
west of this system at this time. The NASA DC-8 flew a single mission into
Tropical Depression 8 (pre-Hurricane Helene) on 12 August from Sal, Cape Verde.
This mission was part of the NAMMA field program and the main objectives
included cyclogenesis, Saharan Air Layer/dust, and microphysics studies.
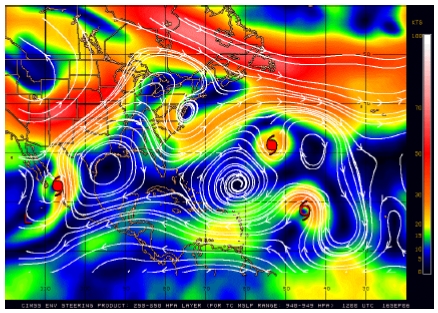
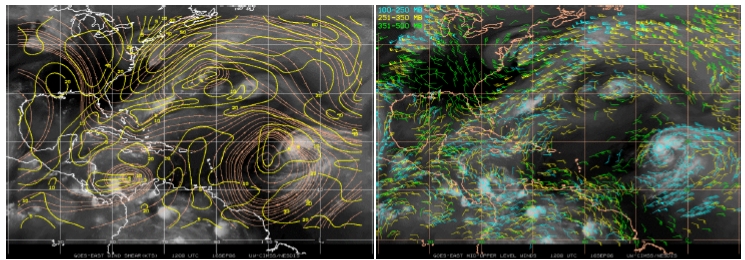
The disturbance tracked to the west-northwest around the southeast periphery of a deep layer ridge [Fig. 3 (left)] over the next several days, which brought it into the suppressive influence of SAL and within range of the NOAA G-IV. The G-IV was deployed to Barbados on 14 September for a set of back-to-back SALEX missions on 15 and 16 September. At 1800 UTC during the day of the mission, Hurricane Helene was a 65 kt Category 1 hurricane and located at ~19.1 N 46.0 W . A large WSW-ENE oriented deep layer ridge located to its northwest was beginning to erode, allowing Helene to continue a motion to the northwest (Fig. 3). Hurricane Gordon was located on the northern edge of this weakening ridge ~1600 km northwest of Helene (Fig. 3). Vertical wind shear analyses from UW-CIMSS suggested that although the shear over Helene was only ~5-10 kt (Fig. 4, left), the storm may have been under the influence of strong (20-30 kt) upper level flow associated with the deep layer ridge. Mid to upper-level water vapor winds from the GOES-12 satellite indicated that these winds may have been restricting the outflow in the northwest quadrant of the storm (Fig. 4, right).
b) Mission Specifics
The flight plan was designed to investigate a large SAL outbreak that was
positioned west and north of Hurricane Helene (Fig. 5, SAL 1) and the moist
tropical environment immediately surrounding the storm [Figs. 5 & 6 (TPW >45
mm; yellow to red shading)]. The flight plan called for initial sampling west
and north of the storm at an optimal flight level of 41,000-45,000 ft.
Subsequent legs around the east and south sides of the storm investigated a dry
SAL intrusion that was wrapping in around the southwest quadrant of the storm
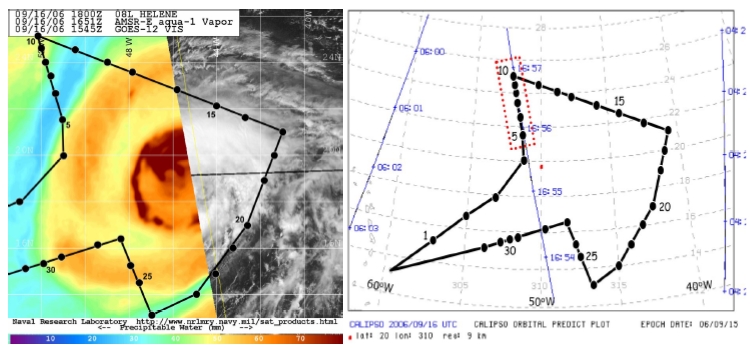
(Figs. 5 & 6 (left), drops 15- 32). A SSE-NNW GPS dropwindsonde sequence was also coordinated with overpasses (within 20-50 min) by NASA's CloudSat ands Calipso satellites (Fig. 6, right; drops 5-10). This coordination provided an opportunity to compare satellite retrievals of precipitation (CloudSat) and Saharan dust (Calipso) with GPS dropsonde data across a segment of the SAL 1 outbreak (Figs. 5 & 6, left). All GPS dropwindsondes were transmitted in real-time, so that data from the sondes could be assimilated into the NOAA GFS model.
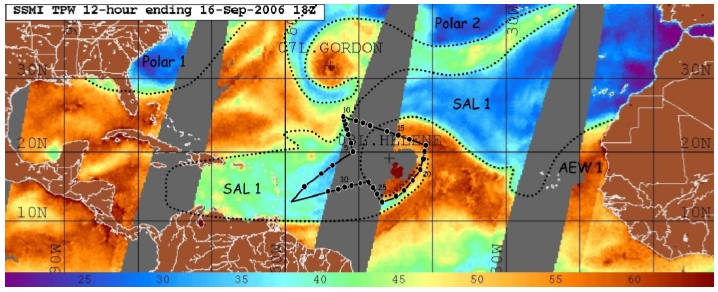
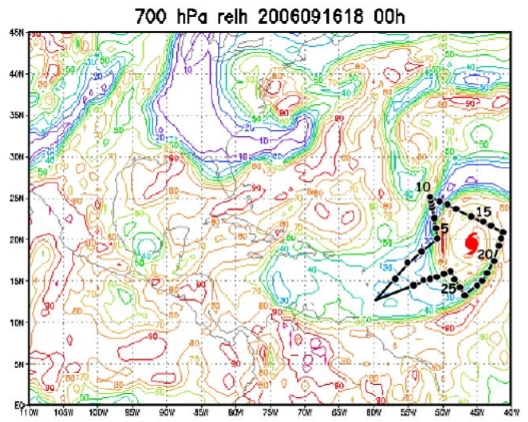
Takeoff was at 1430 UTC from Barbados. A large SAL outbreak spanned from the Caribbean Sea to North Africa and had already advanced as far west as the central Caribbean Sea (Fig. 5, SAL 1). Zoomed AMSR-E TPW imagery from the Aqua satellite from 1651 UTC suggested that dry SAL air (<45 mm TPW; green to blue shading) was likely being advected toward the inner core region of Helene (Fig. 6, left). Drops 5 and 6 showed that SAL air west of Helene contained 4-6% RH at 700 hPa, while drops 20-25 sampled dry SAL air wrapping into the southwest and southeast quadrants of the storm that was comprised of 16-35% RH at 700 hPa. Additionally, several GPS dropwindsondes launched during the mission sampled the SAL's mid-level easterly jet and characteristic temperature inversion. GPS dropwindsondes at drop points 20-22 recorded wind maximums of 30-45 kt from 600-850 hPa, while drop points 33 and 34 indicated 1-3oC t emperature inversions at the SAL's base (~800-850 hPa) [Figs. 5 and 6 (left)]. Figure 7 shows the 060916n flight track overlaid on the 16 September 1800 UTC GFS model analysis of 700 hPa relative humidity. Although the GFS model analysis appeared to accurately depict the spatial extent of the SAL that was surrounding Helene (Fig. 5, SAL 1; Fig. 7, 700 hPa RH of <50%), preliminary data from GPS dropwindsondes launched during the mission suggests that the model was significantly overestimating the mid-level moisture in regions of the SAL. Figure 7 shows that the GFS analyzed the SAL's 700 hPa RH along the flight track to be as low as 10-20% (drops 6-8 and 11). However, there were areas around the storm where the mid-level moisture appeared to be significantly over estimated. For example, although the GFS correctly analyzed the presence of a dry SAL intrusion in Helene's southwest and southeast quadrants (Fig. 7, drops 20-25), it was analyzing 700 hPa RH values of 30-50% where the GPS dropwindsondes were recording values of 5-20% RH.
Problems :
There were no major problems related to this flight. Although 'codeless' GPS dropsondes mainly from 2000-2004 were used, only two dropsondes failed out of the 32 that were dropped.
Jason Dunion
Nov. 9, 2006
|
Aircraft: N49RF Altitude: FL410-450 Proposed takeoff: 16/1500Z | |||
| DROP # | LAT (d m) | LON (d m) | TIME (h:mm) |