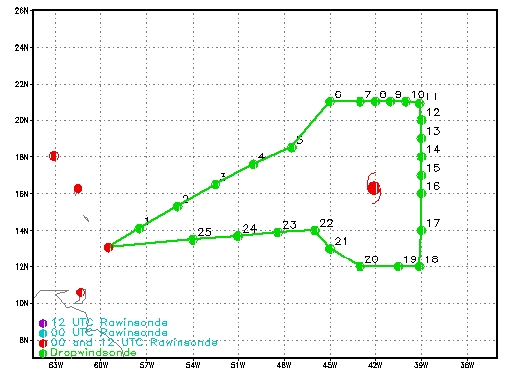
Fig. 1: Flight track (green line) for SALEX mission 20060915n. The GPS dropsonde points (25 total) are indicated by green circles.
| Lead Project Scientist | Jason Dunion |
| Dropsonde Scientist | Pete Black |
| Observer | Chidong Zhang (UMiami) |
| Aircraft Commander | Michelle Finn |
| Pilots | John Longenecker
Will Odell |
| Project Manager | Jack Parrish |
| Flight Meteorologist | Barry Damiano |
| Equipment Specialist | Gordon Kitson |
| Electronics Technician | John Hill Bobby Peek Mark Rogers |
Mission Plan :
NOAA 49RF will fly a Saharan Air Layer Experiment (SALEX) around Tropical Storm Helene as part of IFEX,with Jason Dunion, Pete Black, and Chidong Zhang (UMiami) . The G-IV will leave Barbados at 1500 UTC and will recover back at Barbados at 2145 UTC. The flight track will take the G-IV on a clockwise circumnavigation of the TC and is shown in Fig. 1, along with the 25 GPS dropwindsonde points.
Mission Summary :
a) Synoptic Situation
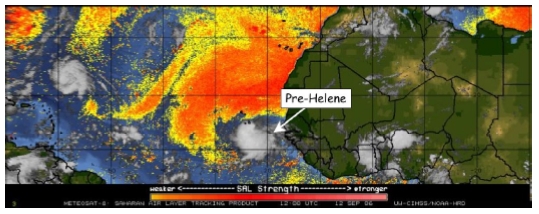
Pre-Hurricane Helene emerged from the coast of North Africa as a vigorous
AEW on 12 September (Fig. 2).
Figure 2 also shows that a very large Saharan Air Layer (SAL) outbreak
was located to the north and west of this system at this time. The NASA DC-8
flew a single mission into Tropical Depression 8 (pre-Hurricane Helene) on 12
August from Sal, Cape Verde. This mission was part of the NAMMA field program
and the main objectives included cyclogenesis, Saharan Air Layer/dust, and
microphysics studies. The disturbance tracked to the west-northwest around the
southeast periphery of a deep layer ridge [Fig. 3 (left)] over the next several
days, which brought it into the suppressive influence of SAL and within range
of the NOAA G-IV.
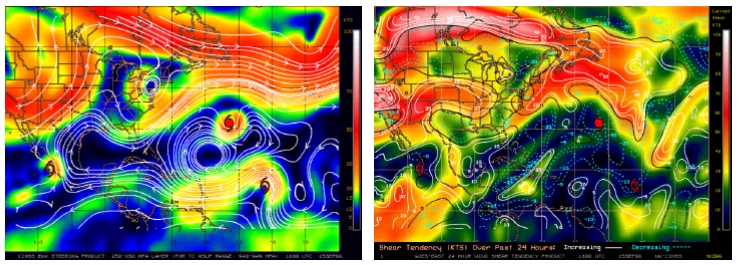
The G-IV was deployed to Barbados on 14 September for a set of back-to-back SALEX missions on 15 and 16 September. At 1800 UTC during the day of the mission, Tropical Storm Helene was located at ~16.3 N 42.1 W. A large deep layer ridge was located to its northwest [Fig. 3 (left)] and Hurricane Gordon was located on the northern edge of this ridge (~2000 km NW of Helene, Fig. 3). Tropical Storm Helene was located in a region of warm SSTs and low shear (<10 kt). Shear tendency analyses from UW/CIMSS showed that vertical wind shear in the region around Helene had been decreasing by ~5-10 kt. The dry air and strong winds associated with the SAL appear to have been the only negative environmental factors impacting the storm at this time.
b) Mission Specifics
The flight plan was designed to investigate a large SAL outbreak that was
positioned west and north of Tropical Storm Helene (Fig. 4, SAL 1) and the
moist tropical environment immediately surrounding the storm [Figs. 4 & 5
(TPW >45 mm; yellow to red shading)]. The flight plan called for initial
sampling west and north of the storm at an optimal flight level of
41,000-45,000 ft. Subsequent north-south (Figs. 4 & 5, drops 11-18) and
east-west (Figs. 4 & 5, drops 18-20) legs were made to sample a dry SAL
intrusion that was wrapping in around the southwest quadrant of the storm.
All GPS dropwindsondes were transmitted in real-time, so that data from the
sondes could be assimilated into the NOAA GFS model. Takeoff was at 1500 UTC
from Barbados. A large SAL outbreak was stretched from the eastern Caribbean
to North Africa and already overspread the West Indies region the day before
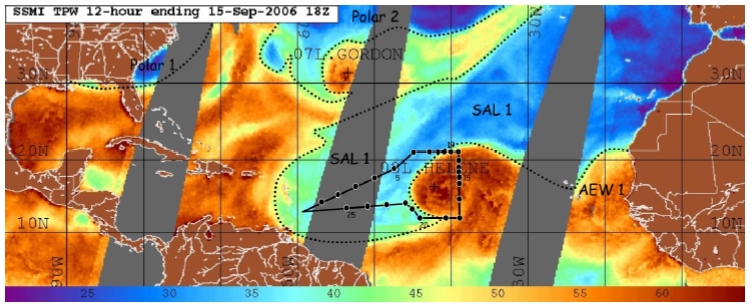
the 20060915n mission (Fig. 4, SAL 1). Additionally, zoomed SSMIS TPW imagery
from 1104 UTC suggested that dry SAL air (<45 mm TPW; green to blue shading)
was likely being advected toward the inner core region of Helene (Fig. 5).
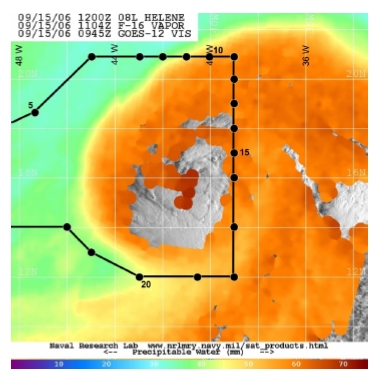
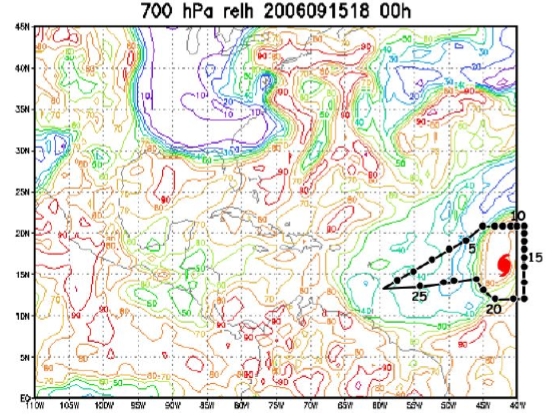
Figure 6 shows the 20060915n flight track overlaid on the 15 September 1800 UTC GFS model analysis of 700 hPa relative humidity. Although the GFS model analysis appeared to accurately depict the spatial extent of the SAL that was surrounding Helene (Fig. 4, SAL 1; Fig. 6, 700 hPa RH of <50%), preliminary data from GPS dropwindsondes launched during the mission suggests that the model was significantly overestimating the mid-level moisture in regions of the SAL. Figure 6 shows that the GFS analyzed the SAL's 700 hPa RH along the flight track to be no lower than ~30%. In fact, the GFS analyzed most of the SAL west of Helene to contain ~40% RH at 700 hPa. However, GPS dropwindsondes showed several regions in the SAL where mid level moisture was ~5-20% RH.
Problems :
There were no major problems related to this flight. Although 'codeless' GPS dropsondes mainly from 2000-2004 were used, only one dropsonde failed out of the 26 that were dropped.
Mission Data: