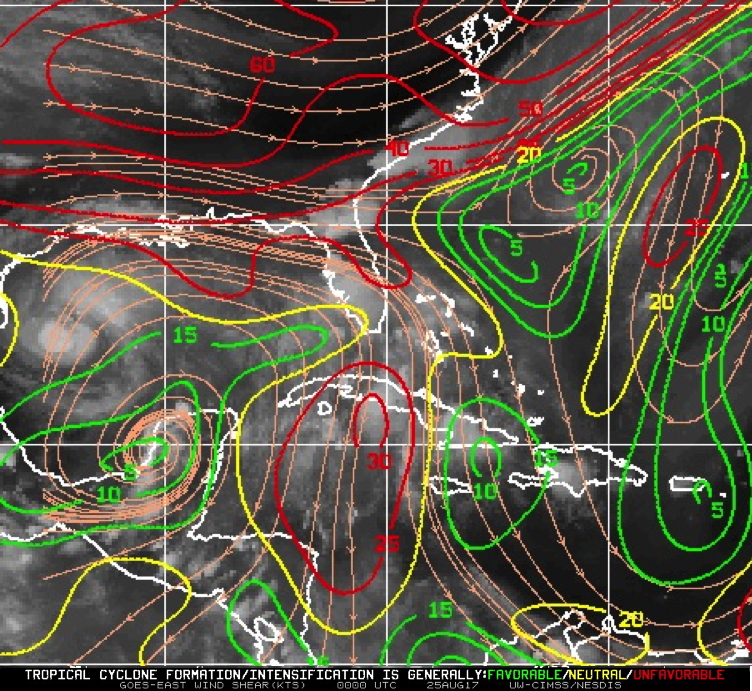
 Figure 1. CIMSS-derived 850-200 hPa shear (contour, kt) and GOES water vapor image valid 00 UTC August 25. Image courtesy https://www.nrlmry.navy.mil/tc-bin/. |
| Aircraft Commander | Scott Price |
| Co-pilot | Robert Mitchell |
| Co-pilot | John Rossi |
| Flight Engineer | |
| Flight Engineer | |
| Navigator | Sam Urato |
| Flight Director | Jack Parrish |
| Flight Director | Brian Belson |
| System Engineer | Mike Mascaro |
| Data Technician | Bobby Peek |
| Dropsonde Operator | Todd Richards |
| Lead Project Scientist | Robert Rogers | HRD |
| Radar Scientist | Jun Zhang | HRD |
| Dropsonde Scientist | Kathryn Sellwood | HRD |
| Boundary layer Scientist | Heather Holbach | HRD |
| Radar | John Gamache | HRD |
Mission Plan :
|
Figure 1. CIMSS-derived 850-200 hPa shear (contour, kt) and GOES water vapor image valid 00 UTC August 25. Image courtesy https://www.nrlmry.navy.mil/tc-bin/. |
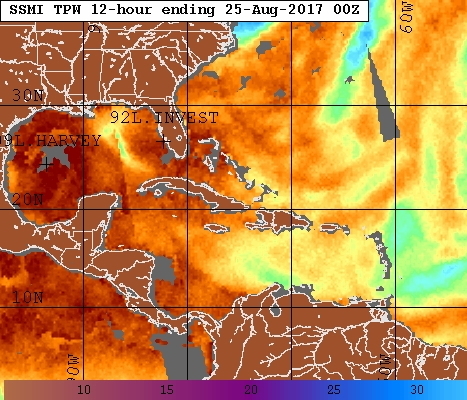
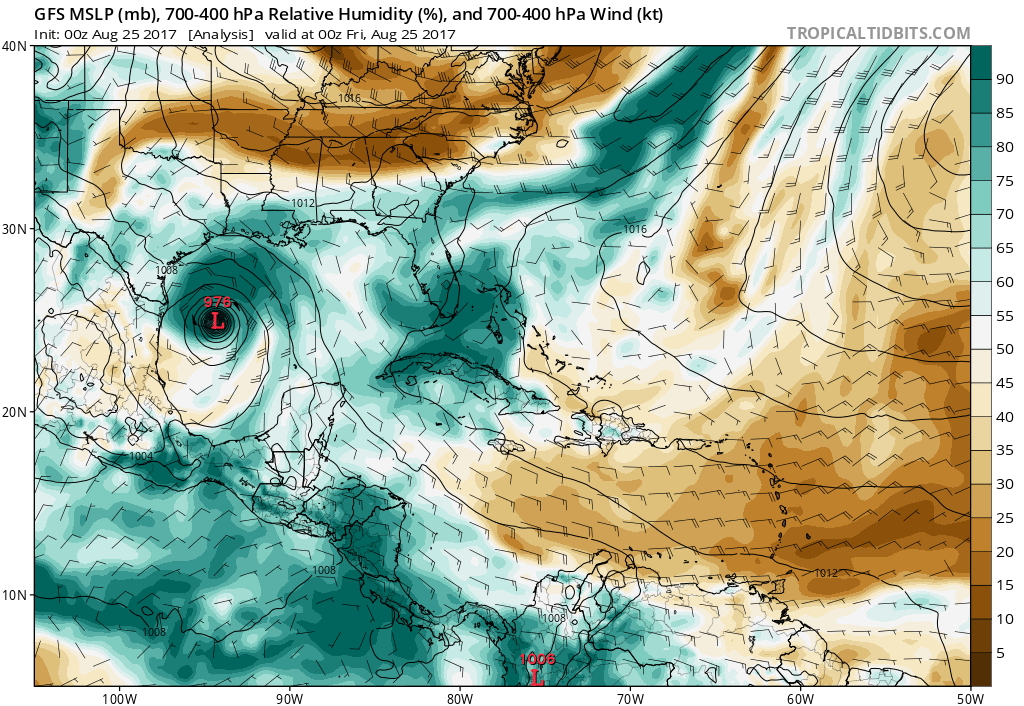
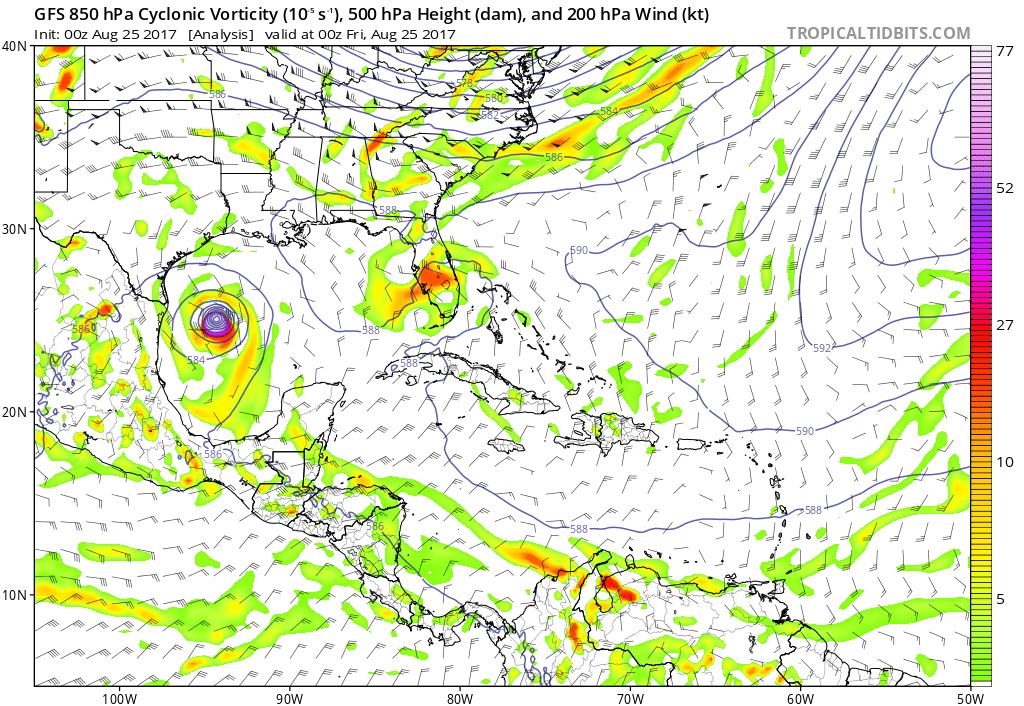
NOAA42 will perform a TDR mission in Hurricane Harvey, located in the western Gulf of Mexico after having rapidly intensified to a 75-kt hurricane prior to takeoff. The storm is still experiencing southwesterly shear, but it has increased some to ~15-20 kt (Fig. 1). Harvey is in an area of warm waters and mostly a moist environment, though there is still some indication of relatively dry midlevel air south of the hurricane (Fig. 2). The upper-level low that was impacting Harvey 24 h prior has weakened and retrograded inland over Mexico (Fig. 3). Water vapor imagery confirms some dry air, though it is less pronounced than 24 h prior. The sharp gradient in the water vapor image on the southwest side of the storm indicates the southwesterly shear affecting the storm.
 (a) |
 (b) |
|
Figure 2. (a) SSM/I total precipitable water (shaded, mm) valid 00 UTC August 25. Image courtesy https://www.nrlmry.navy.mil/tc-bin/. (b) Relative humidity averaged in the 700-400 hPa layer (shaded, %) valid 00 UTC August 25. Image courtesy tropicaltidbits.com. | |
 (a) |
 (b) |
|
Figure 3. (a) Relative vorticity at 850 hPa (shaded, x 10-5 s-1), geopotential height at 500 hPa (contour, dm), and winds at 200 hPa (barb, kt) from GFS analysis valid 00 UTC August 25. Image courtesy tropicaltidbits.com. (b) GOES-13 water vapor brightness temperature (shaded, deg C) valid 0000 UTC August 25. Image courtesy https://www.nrlmry.navy.mil/tc-bin/. | |
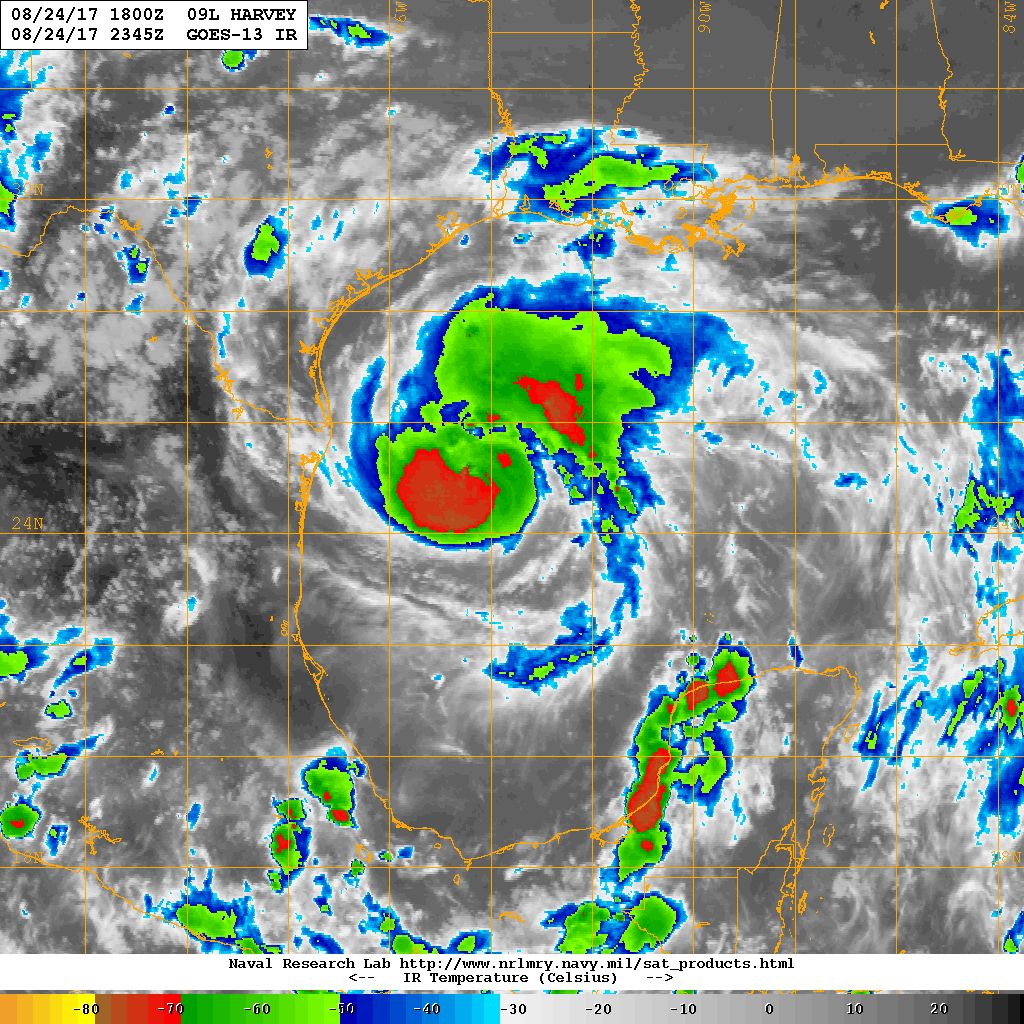
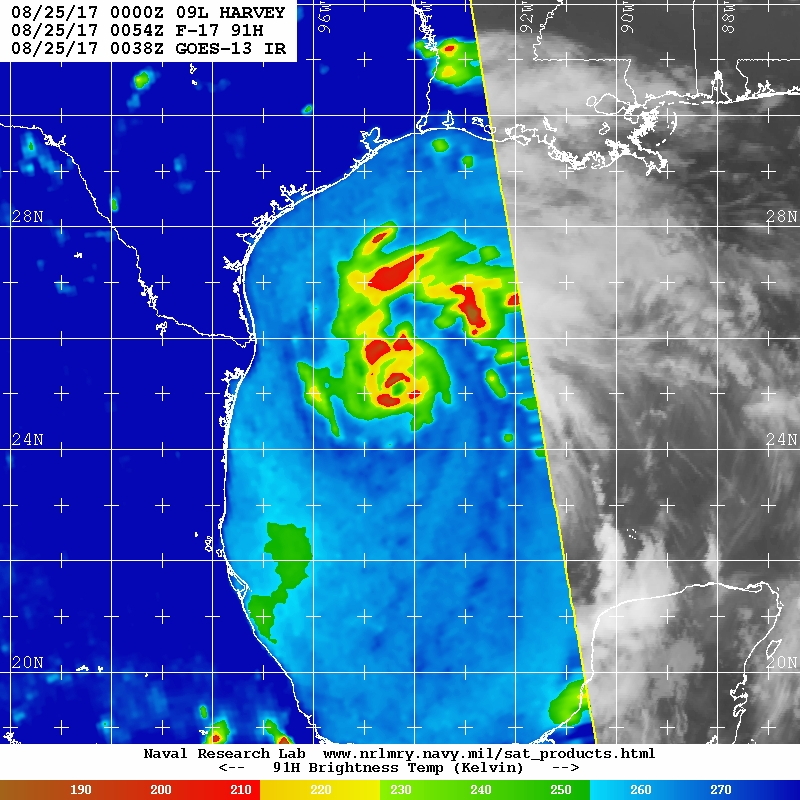
Satellite imagery shows a more symmetric presentation of clouds and precipitation (Fig. 4) in the inner core. A broad central dense overcast is apparent, and there appears to be a localized area of warming cloud tops in the center of circulation, suggesting a clear eye is trying to form. Microwave imagery shows that there is widespread areas of deep convection on the downshear side of the storm outside the inner core. Upshear there is little precipitation outside the eyewall. High-resolution animations of visible satellite imagery (not shown) indicates convection in the eyewall developing downshear, maturing left of the shear vector, anviling upshear, and wrapping around to the right side of the shear vector. There could be a second stage of intensification over the next 12 h, as the storm enters the nighttime phase of the diurnal cycle and the eye potentially clears out.
 (a) |
 (b) |
 (c) |
|
Figure 4. (a) GOES-13 visible satellite image valid 2345 UTC August 24 (b) GOES-13 infrared brightness temperature (shaded, deg C) valid 2345 UTC August 24 (c) 91H GHz F-17 microwave brightness temperature (shaded, K) valid 0054 UTC August 25. Images courtesy https://www.nrlmry.navy.mil/tc-bin/. | ||
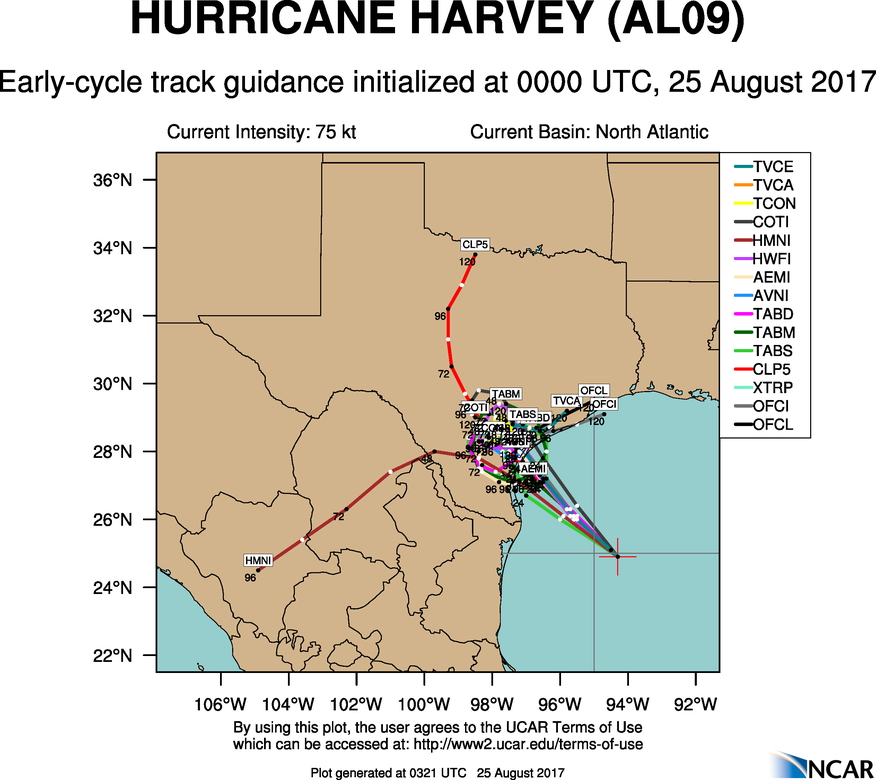
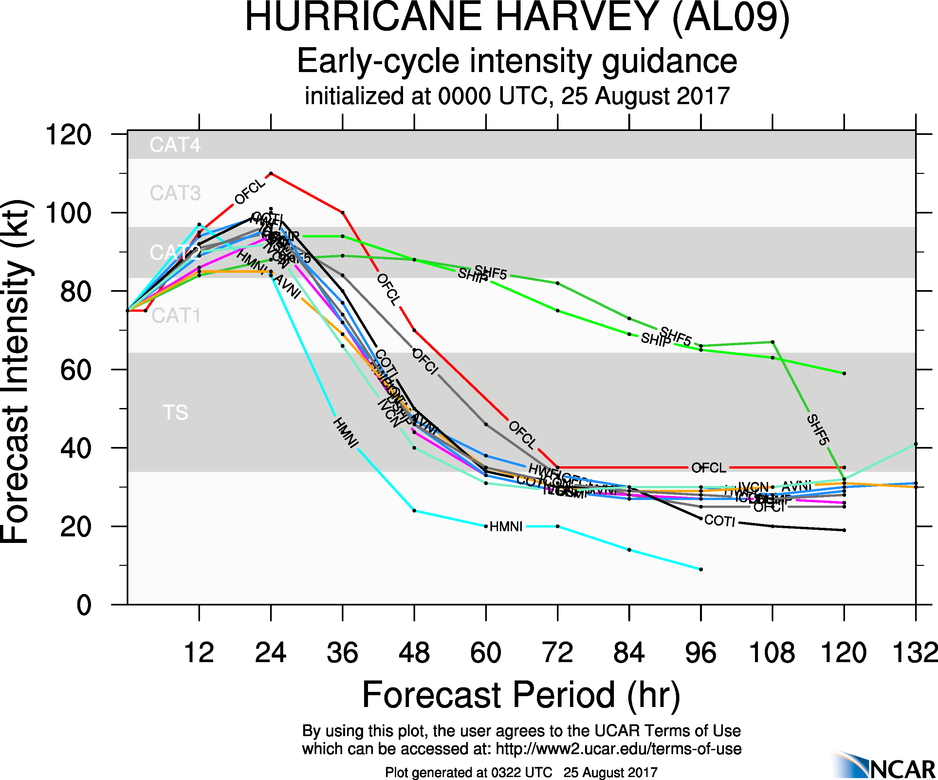
Forecast guidance continues to agree that Harvey will track toward the northwest, making landfall in south Texas in the next 24-48 h (Fig. 5). Intensity guidance suggests Harvey will continue to strengthen, possibly reaching Major Hurricane status. The NHC official forecast at 00 UTC August 25 was actually the most aggressive forecast, bringing Harvey to near Category 4 strength in 24 h.
 (a) |
 (b) |
|
Figure 5. (a) Track forecast guidance for Hurricane Harvey valid 00 UTC
August 25
(b) Intensity forecast guidance for Hurricane Harvey valid 00 UTC August 25. Images courtesy http://www.ral.ucar.edu/guidance/realtime/current/. | |
The mission plan called for a butterfly pattern (Fig. 6), with 105 nm legs. Similar to the flight from 24 h previous, an attempt was going to be made to coordinate the final outbound leg with an overpass from CYGNSS. Combination GPS sonde/AXBTs are planned at all turn points, plus a center drop for NHC if a center can be found at the flight altitude of 8000 ft, and a drop in the peak winds on the outbound leg to the northeast. Time limitations due to crew rest onstraints prevented any attempt at an SFMR bank maneuver.
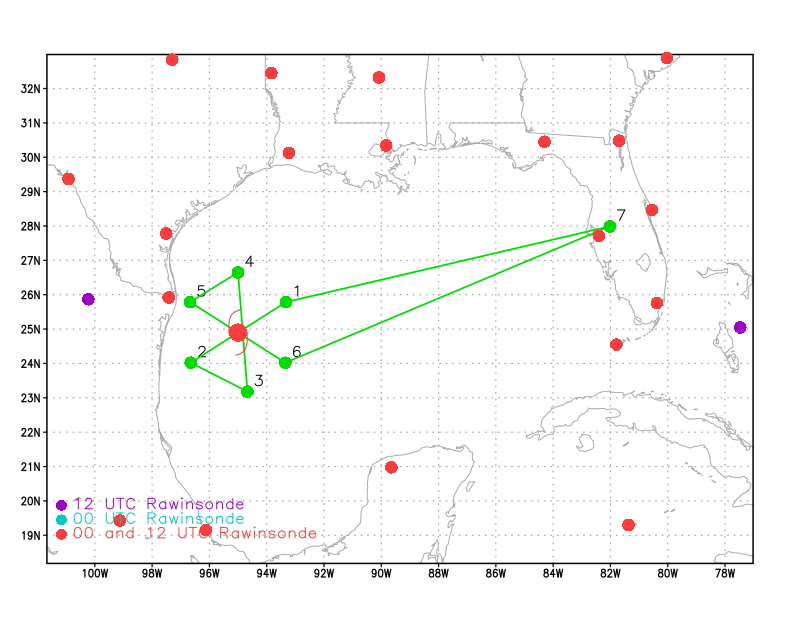 Figure 6. Proposed flight track for mission20170825H1. |
Mission Summary :
| Take off | Landing
| Linder-Lakeland Airport, FL
| 01:46 UTC
| Linder-Lakeland Airport, FL
| 08:45 UTC
| | ||
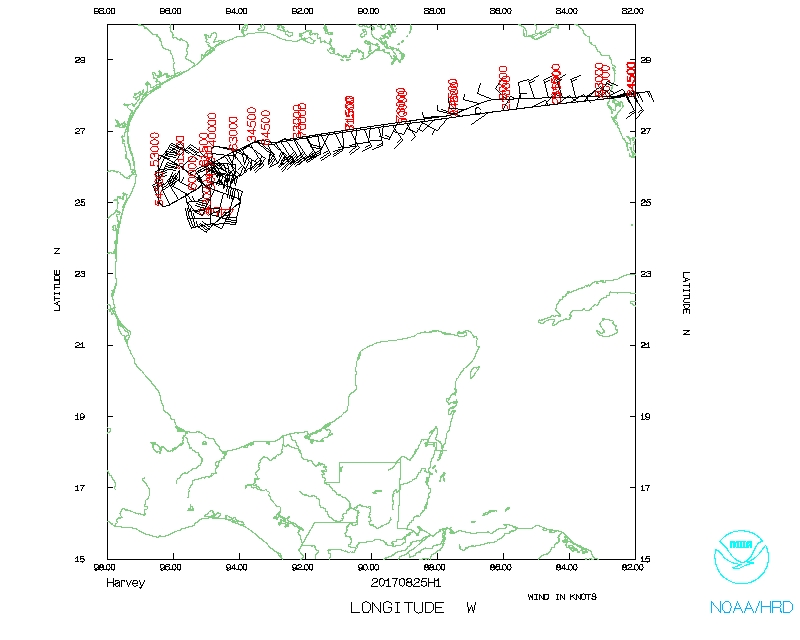
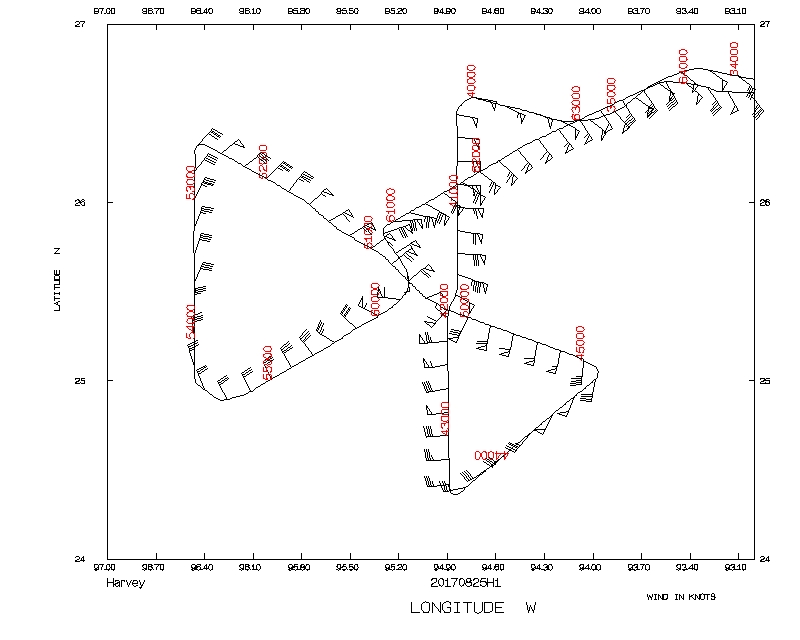
The actual flight track in shown in Fig. 7. Takeoff was at 0146 UTC from Lakeland, FL. The mission accomplished the intended flight pattern. Flight-level winds continued to show that the wind field was asymmetric, with a broad field to the northeast (Figs. 7-8). Lower fuselage radar and tail Doppler radar imagery (Fig. 8) and satellite imagery showed pronounced banding features, particularly on the north side of the storm. The eyewall was open on the south and southeast side, perhaps due to the southwesterly shear impacting the storm. The bands outside the eyewall showed a complex structure, with evidence of a secondary wind maximum on the south side, but not as much on the north. Flight level data (Fig. 7) also supported the presence of a secondary wind maximum on the south side. The band connected to the eyewall on the north (DSL) side.
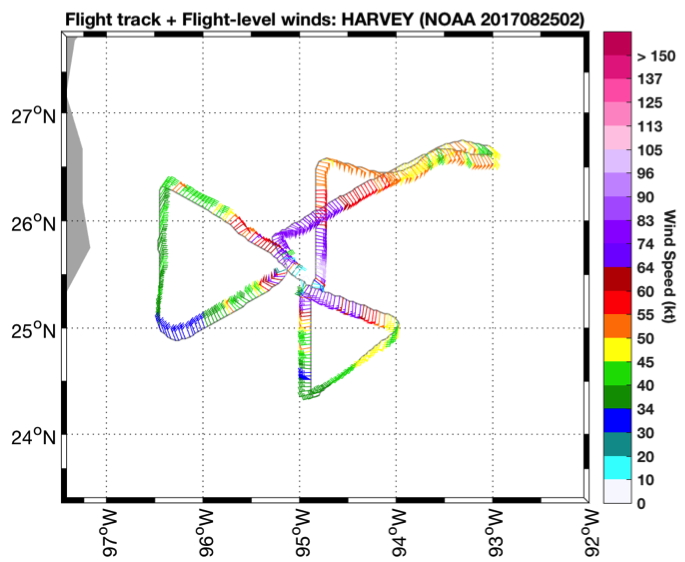 Figure 7. Actual flight track for mission 20170825H1. Flight-level winds (barbs, kt) and wind speeds (shaded, kt) indicated. |
 (a) |
 (b) |
|
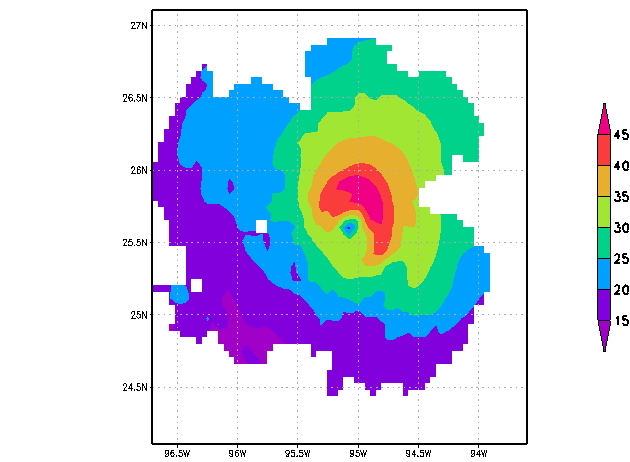
Figure 8. (a) Reflectivity (shaded, dBZ) at 2 km altitude from tail Doppler
radar analysis. Line NS denotes location of vertical cross section in Fig. 10. "X" denotes location of circulation center. (b) As in (a), but for wind speed (shaded, m/s). | |
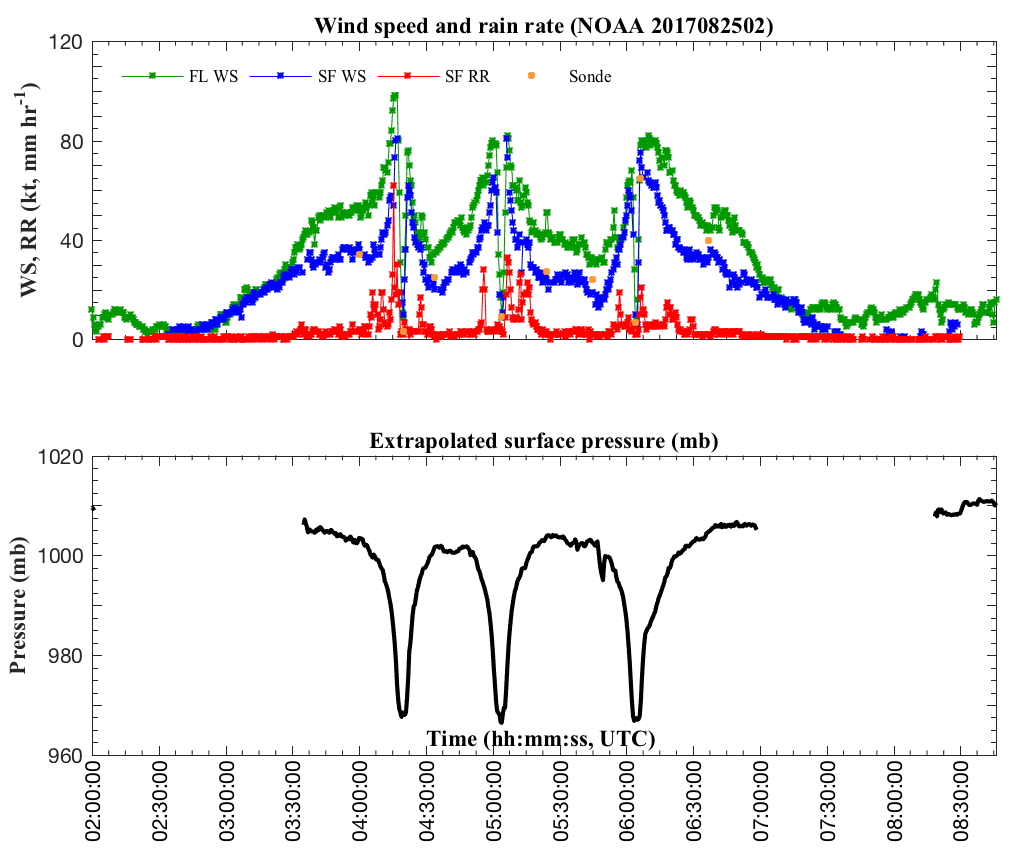
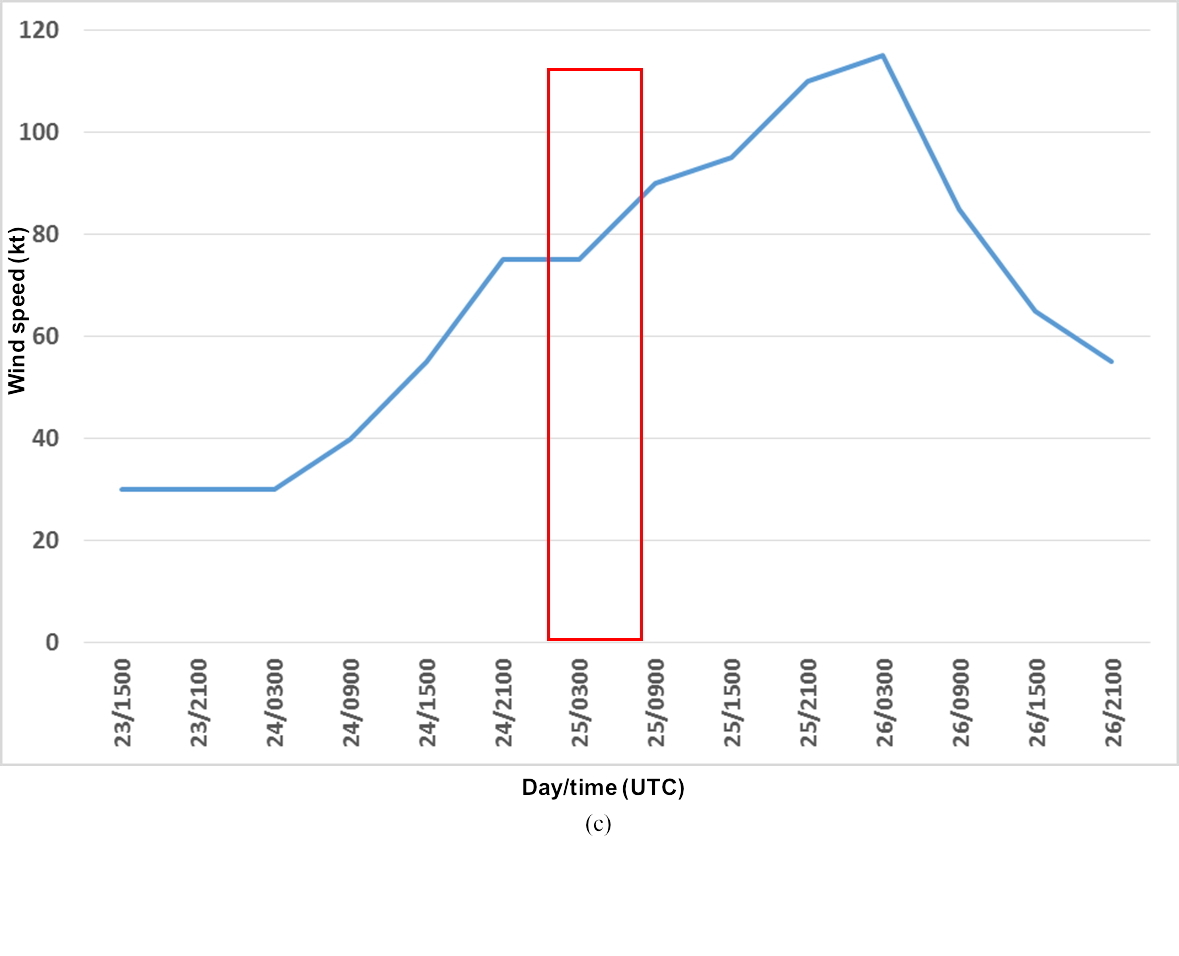
Time series of flight-level parameters (Fig. 9) also indicated the weak reflection of the wind maximum on the south side of the storm, as well as the broad wind field on the north side. Extrapolated surface pressure showed that the storm intensified little during the flight. As indicated in Fig. 9c, the flight occurred during a pause in intensification, which resumed once the flight ended.
 (a) |
 (b) |
|
Figure 9. (a) Time series of flight-level winds (green, kt), SFMR winds
(blue, kt), and SFMR rain rate (red, mm/hr) for mission 20170825H1
(b) Time series of surface pressure extrapolated from flight level (mb) for mission 20170825H1 (c) time series of NHC working best track intensity of Harvey. Red box denotes times of mission 20170825H1. | |
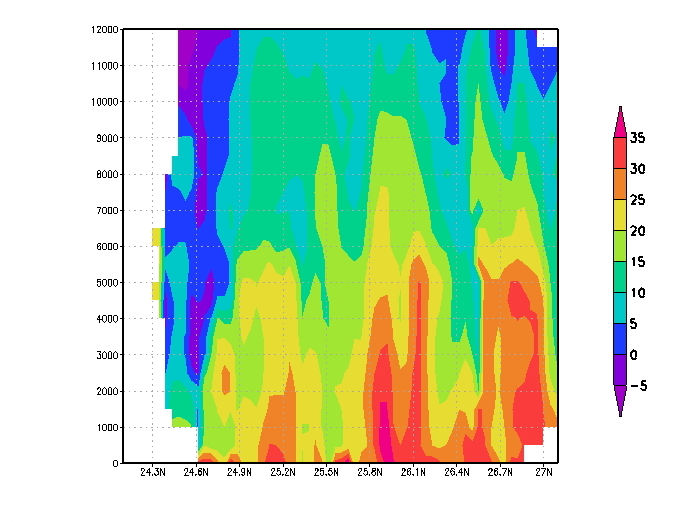
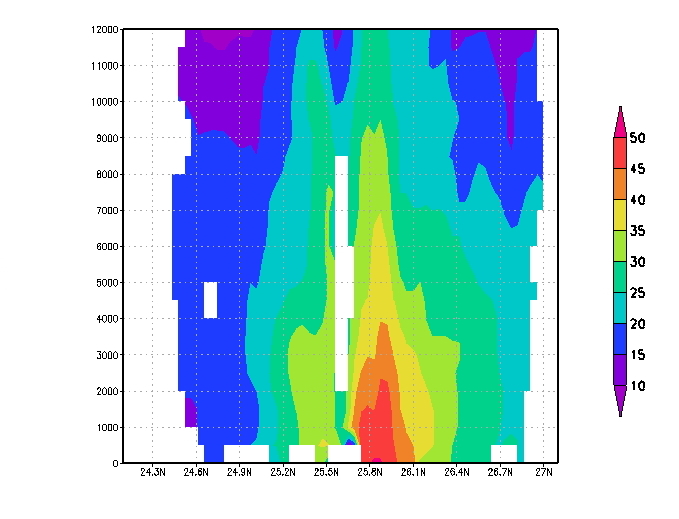
Vertical cross sections of reflectivity and wind speed from the tail Doppler radar (Fig. 10) showed evidence of the outer wind maximum on the south side of the storm, in the presence of primarily stratiform rainfall in this outer band. The signal was rather weak, though, possibly because of the coarse resolution (5 km) of the real-time radar analysis.
 (a) |
 (b) |
|
Figure 10. (a) Vertical cross section of reflectivity (shaded, dBZ) along
line N-S shown in Fig. 8. "X" denotes location of circulation center.
(b) As in (a), but for wind speed (shaded, m/s). Dashed line denotes location of secondary wind maximum on the south side of the storm. | |
The leg on the south side was truncated to conserve time. Also, the aircraft deviated around a sharp reflectivity gradient on the final northeast pass. The final outbound leg was extended for further CYGNSS coordination.
The aircraft landed at 0845 UTC.
Mission Evaluation:
The mission went well. The radar worked fine, producing three analyses and superobs that were transmitted to EMC in real time. The sondes only had one failure, though most (4/6) of the AXBT’s did not work. The SFMR did work.
This could be a good dataset to examine the structural variability of a spiral rainband that could potentially become a secondary eyewall in the next 12 h. In addition to the potential secondary eyewall formation sampled during this flight, the aircraft also sampled convection in the eyewall first on the north side inbound, and then again on the northwest side on an outbound leg, ~1.5 h later. It appears that this was the same feature, so it is possible that the aircraft sampled a convective burst at two different times as it moved around the storm, from the downshear left to the left of shear locations within the eyewall.
Problems :
No major problems. One dropsonde and four AXBTs failed.
Rob Rogers
August 28, 2017
 Flight track |
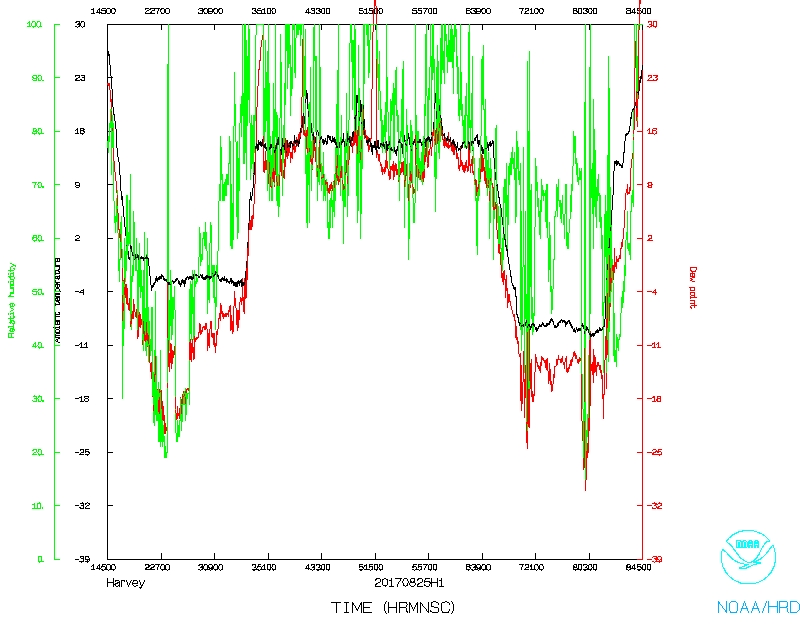 Temperature and Moisture |
 Wind and Atlitude |
 Flight track detail |
LPS log |
Radar log |
Drop log
Flight Director's manifest
Flight Director's log |
serial data
NetCDF data |
1 second data