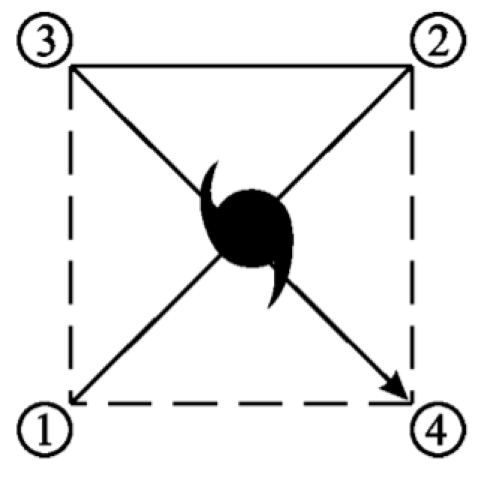
Figure 1. Proposed ALPHA flight track for mission 201800904H2. Adopted from National hurricane operations plan FCM-P12-2018 Figure 5-7. |
| Aircraft Commander | Scott Price |
| Co-pilot | Albert Abitol |
| Co-pilot | Kevin Doremos |
| Navigator | Brian Richards |
| Flight Engineer | Ken Heystek |
| Flight Engineer | Mike Sanchez |
| Flight Director | Ian Sears |
| System Engineer | Mike Mascaro |
| Data Technician | Joe Greene |
| AVAPS Operator | Nick Underwood |
| LPS | Hui Christopherson | HRD |
| Radar | Rob Rogers | HRD |
| Dropsonde | Andy Hazelton | HRD |
| Observer | Jon Zawislak | HRD |
| Observer | Sophia de Solo | Embry Riddle |
| LPS | Paul Chang | NESDIS |
| Observer | Joe Sapp | NESDIS |
| Radar | John Gamche | HRD |
Mission Plan :
|
Figure 1. Proposed ALPHA flight track for mission 201800904H2. Adopted from National hurricane operations plan FCM-P12-2018 Figure 5-7. |
NOAA 42 will conduct a NHC-tasked mission for Tuesday 2200 UTC (6:00 PM EDT) takeoff, targeting the 00Z and 06Z fixes. Proposed track (Fig. 1) is to do the ALPHA pattern before the storm makes landfall. When the storm is close to making landfall, beach survey patterns will be flown. If there is an opportunity, fly potential modules; i.e., offshore intense convection module and/or SFMR high incidence angle module (clear region, 15 m/s).
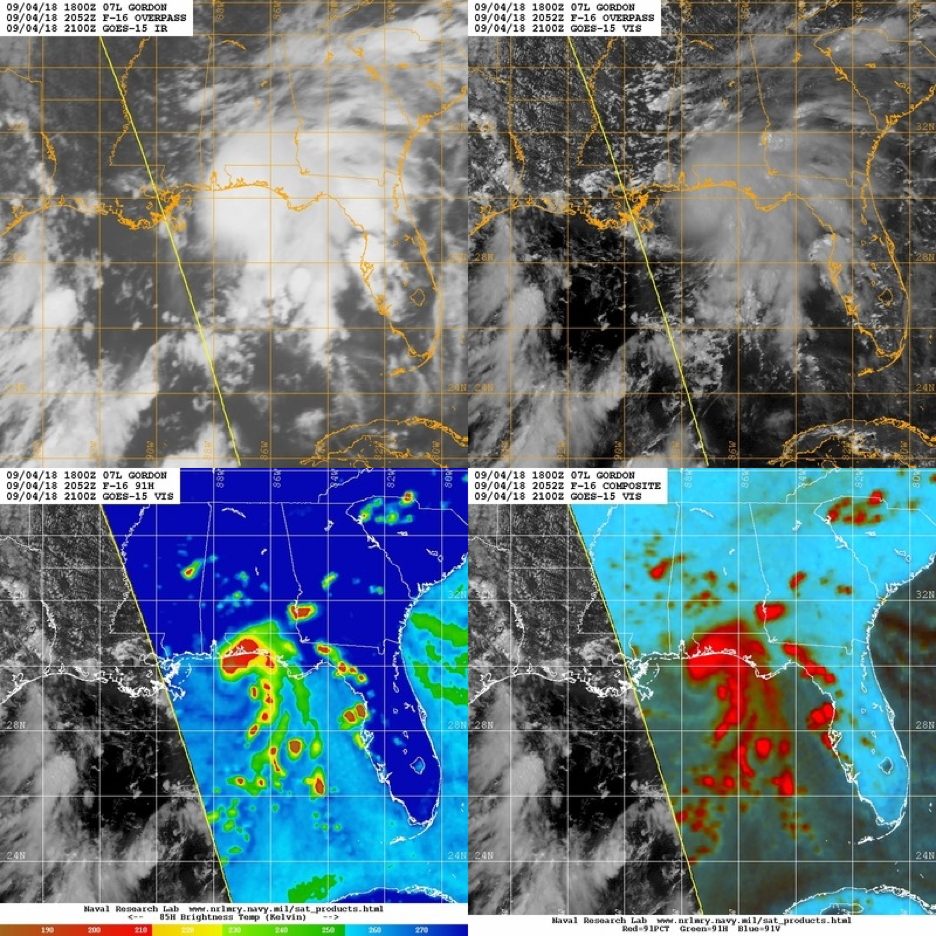
Figure 2. Composite satellite imagery of TS Gordon at 2052 UTC September 4, 2018. Image courtesy of https://www.nrlmry.navy.mil/. |
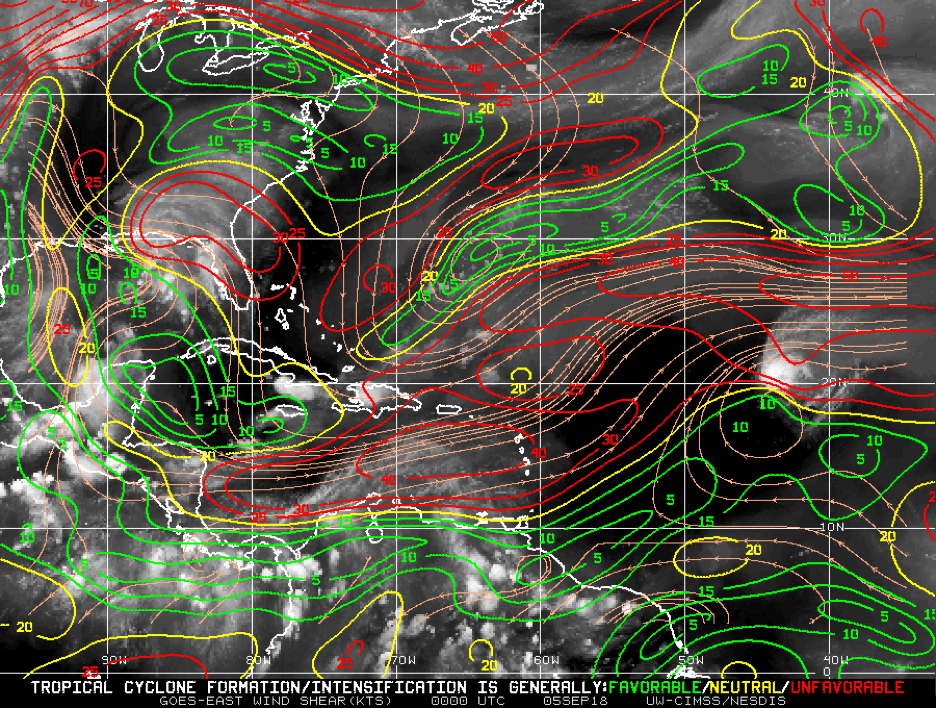
Figure 3. 250 to 850 hPa shear from CIMSS analysis at 0000 UTC, September 05 2018. |
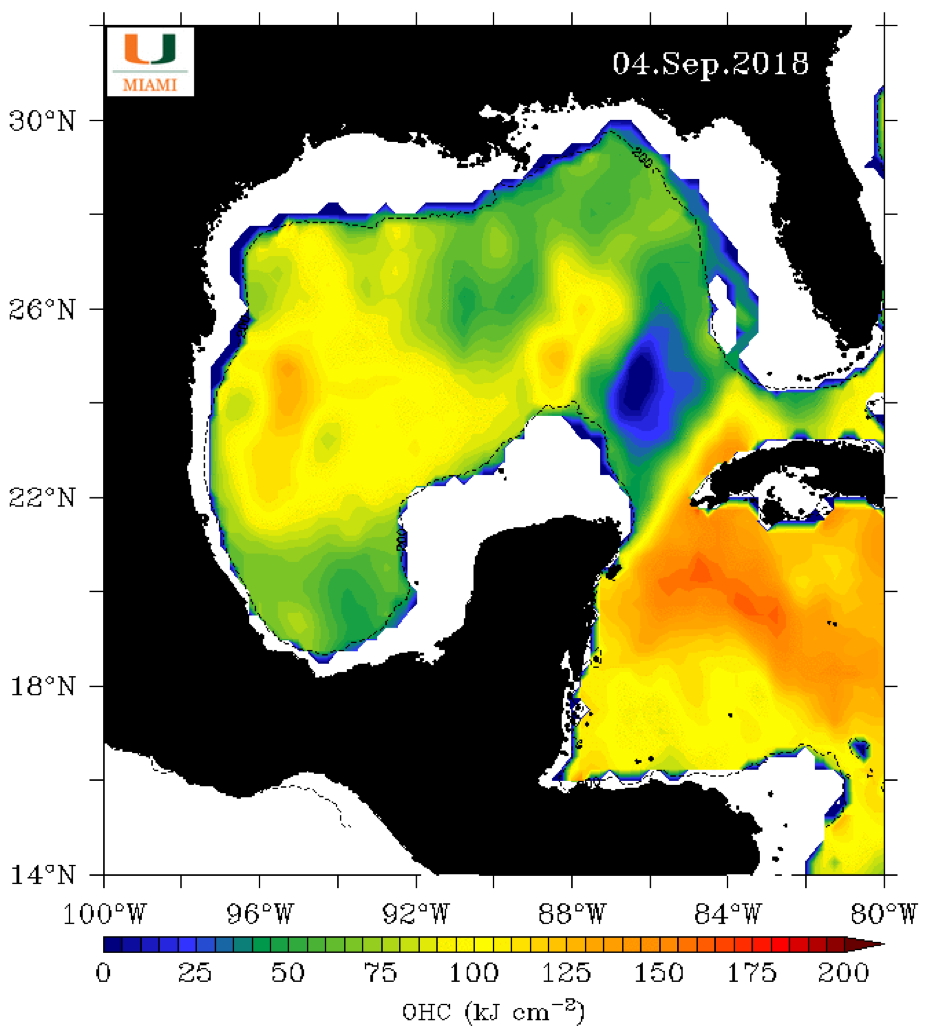
Figure 4. Ocean heat content on September 4, 2018. Image courtesy of http://isotherm.rsmas.miami.edu/heat/weba/atlantic.php. |
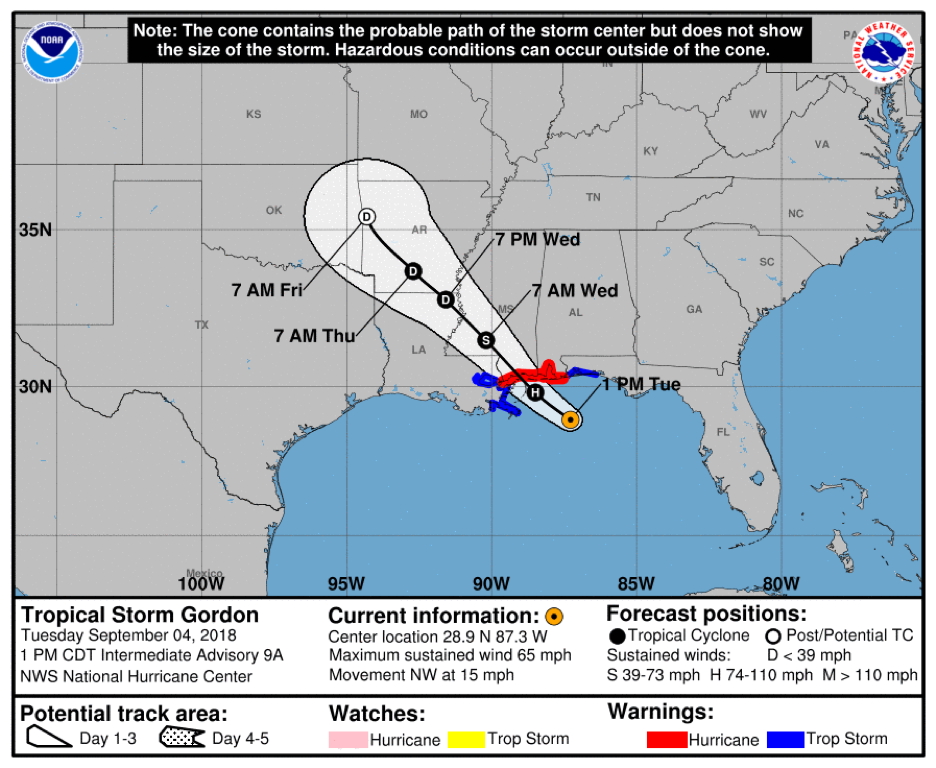
Fig. 5: NHC official advisory at 1PM on September 4, 2018. |
Most of the deep convection was located to the northeast of Gordon, based on either IR or microwave satellite imagery (Fig. 2). At this time, Gordon was experiencing moderate to high northwesterly shear (Fig. 3). Gordon still had ~6 h over warm SSTs before landfall (Fig. 4). With diffluent southeast upper-level flow and increased convergence from land interaction, the official NHC forecast called for Gordon to track northeast and became a hurricane just before landfall (Fig. 5). Once Gordon made landfall, the storm was expected to weaken rather quickly, with it becoming a remnant low by 48 h.
Mission Summary :
| Take off | Landing
| Linder-Lakeland, FL
| 22:11 UTC
| Linder-Lakeland, FL
| 05:05 UTC
| Penetrations
| 7
| Expendables
| 14 dropsondes (NHC)
| | ||||||
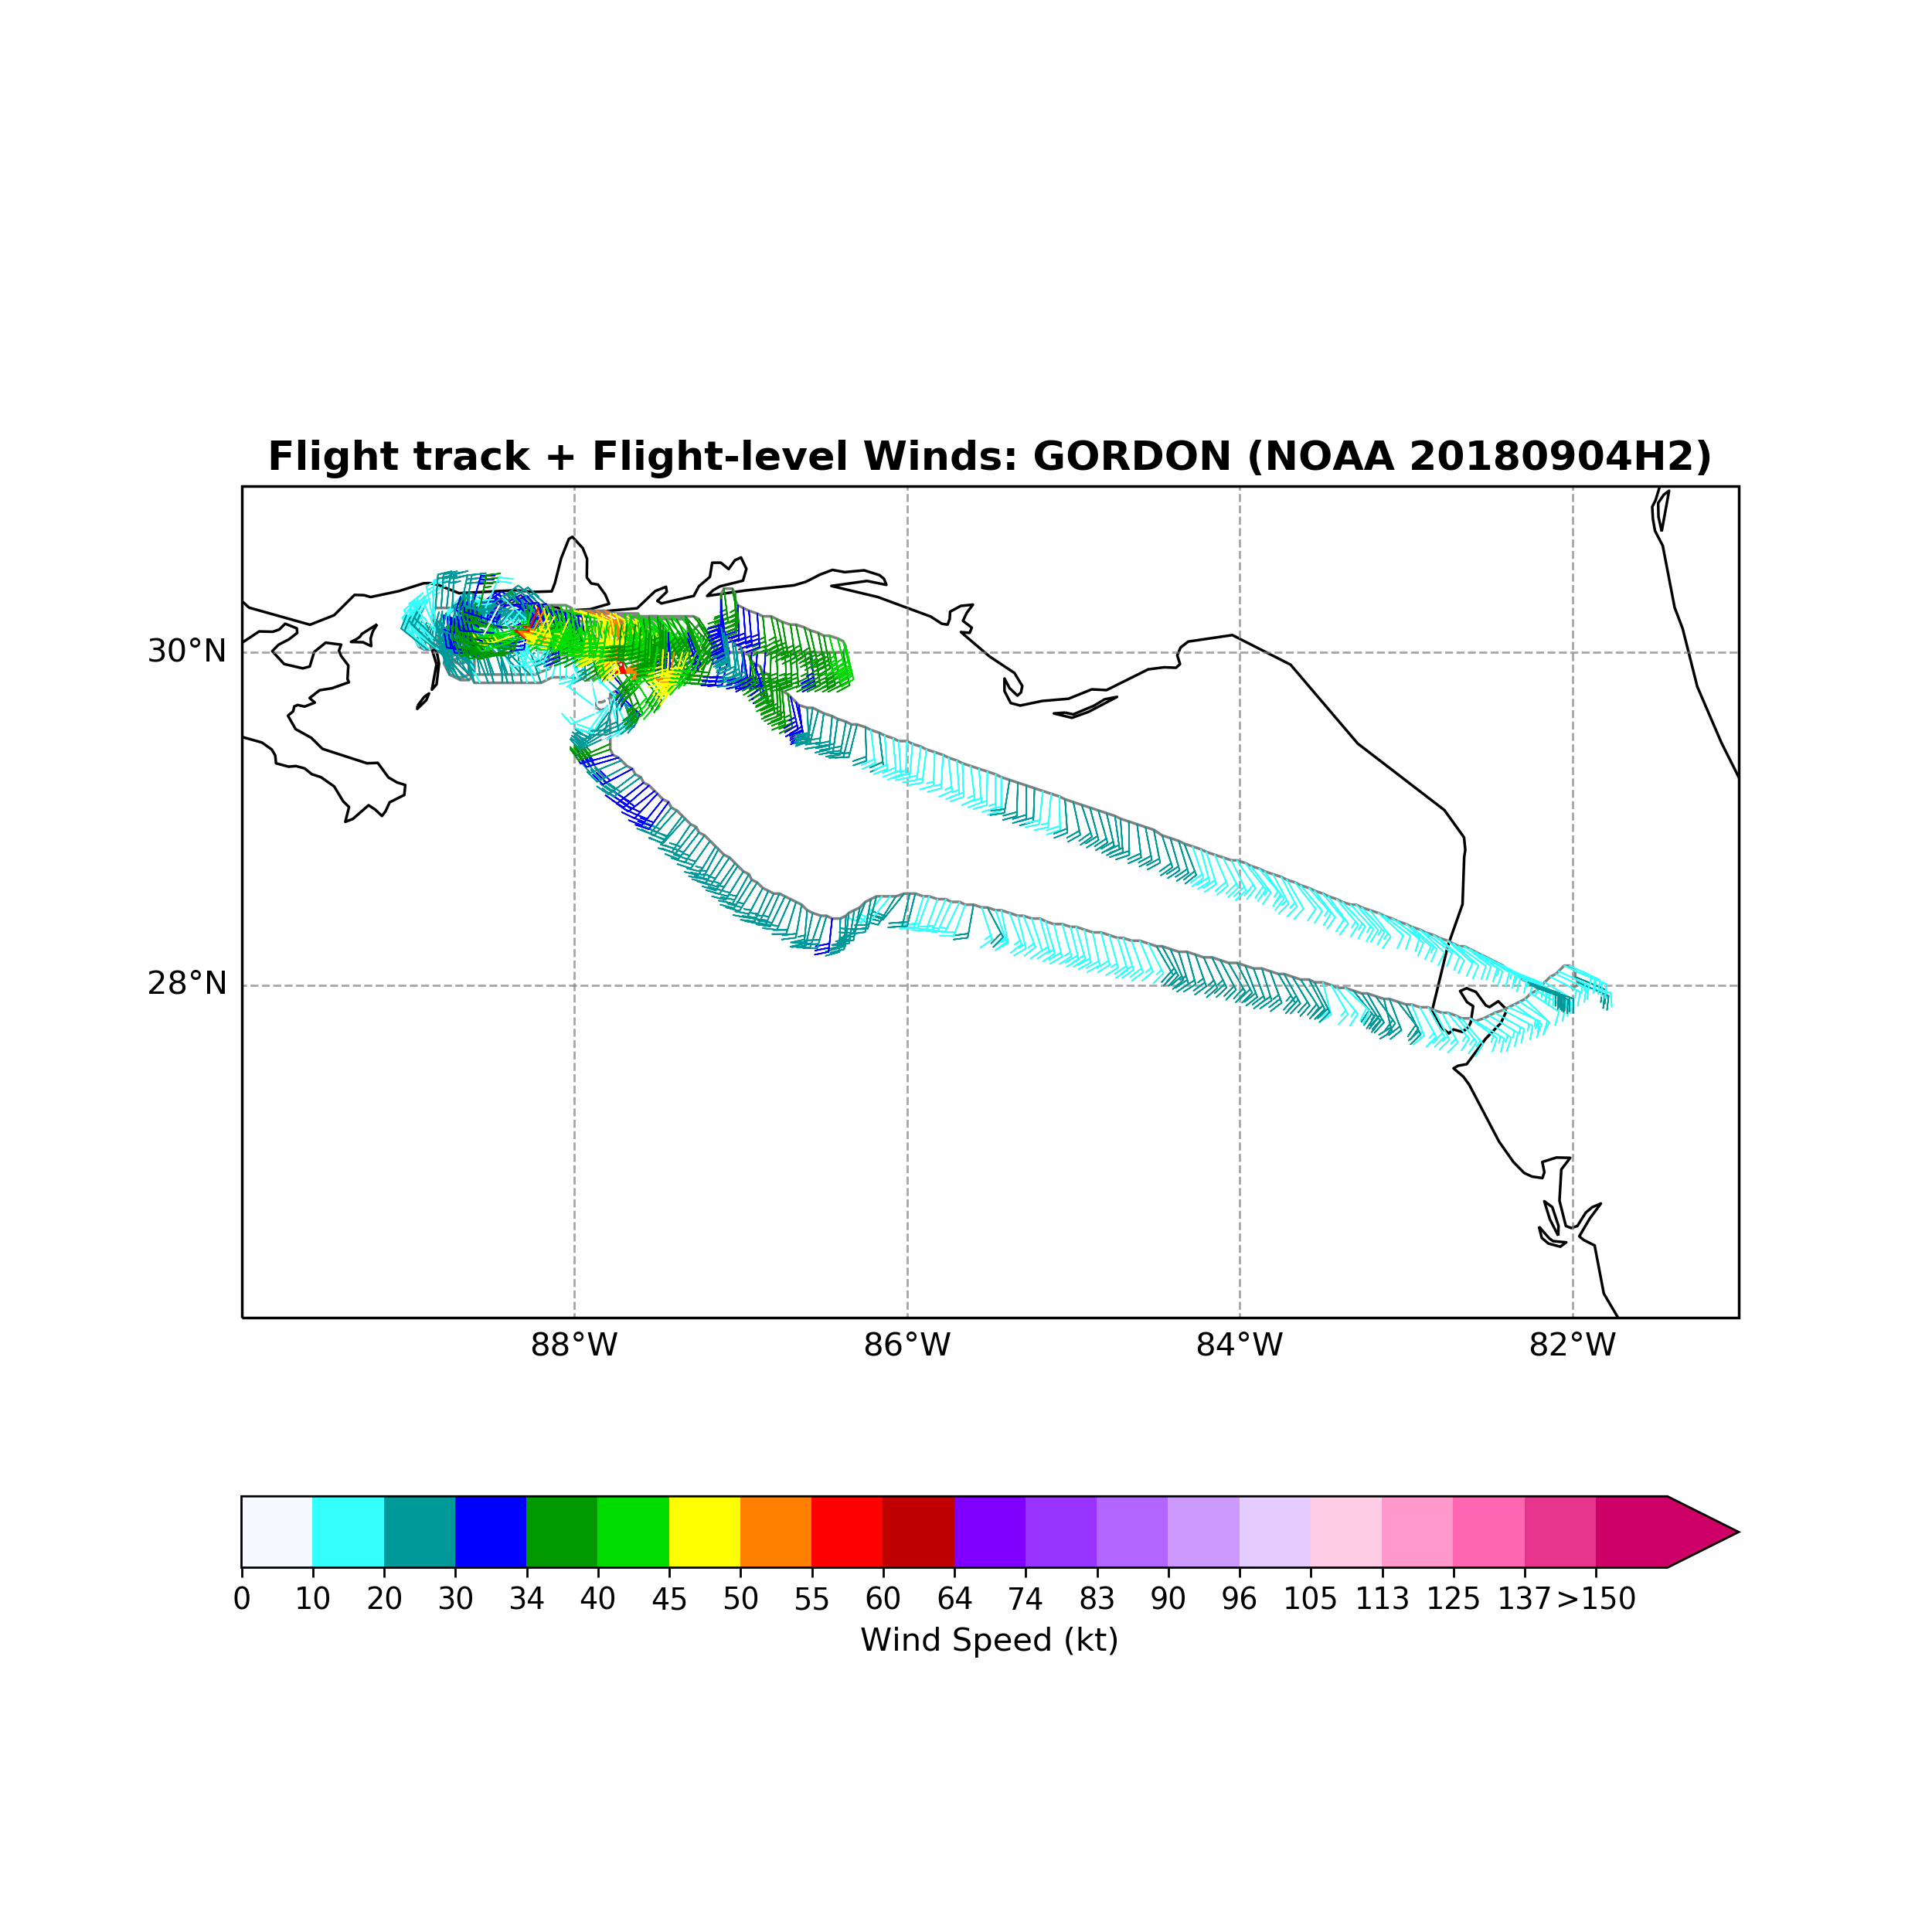
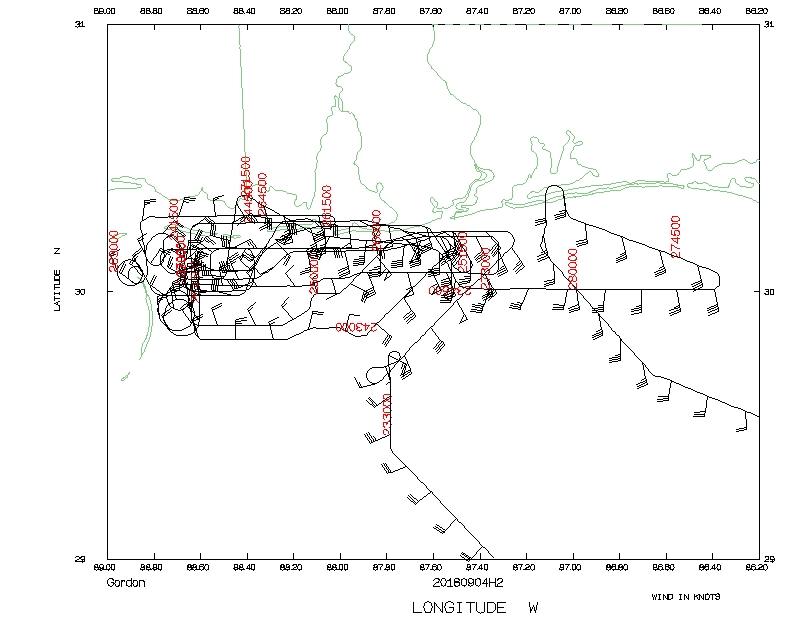
When we finished the first truncated ALPHA pattern, however, the storm had moved closer to land than expected. We were requested not to repeat the truncated ALPHA pattern, but rather just do the beach survey, with center drops and fixes at the flight director's discretion. The actual flight track reflected many west-east beach survey patterns with center fixes (Fig. 6). Ground radar scientist Gamache had to break down the individual west-east survey legs into separate analyses. We ended up with record-breaking 8 real-time TDR analyses. The final TDR analysis showed that Gordon was a very asymmetric storm just before landfall, with most of the strong winds and heavy precipitation located in the NE quadrant of the storm (Fig. 7-8).
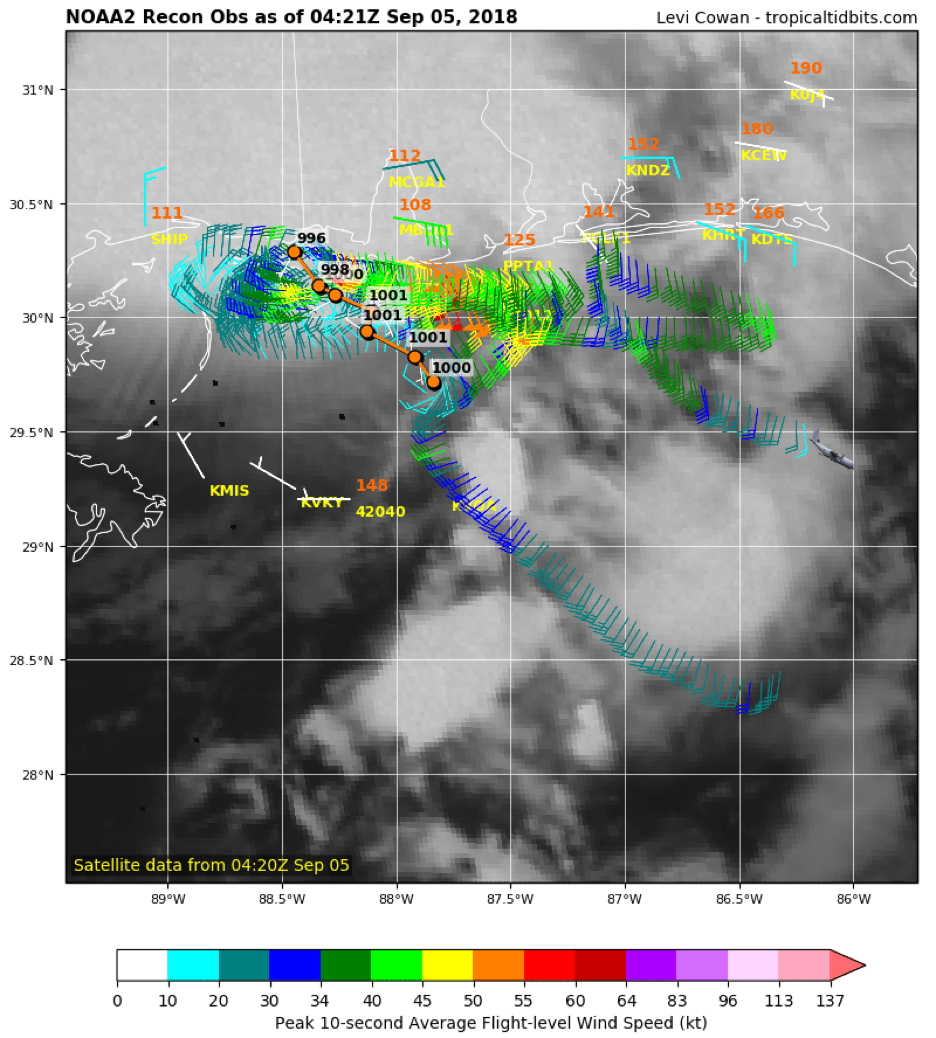
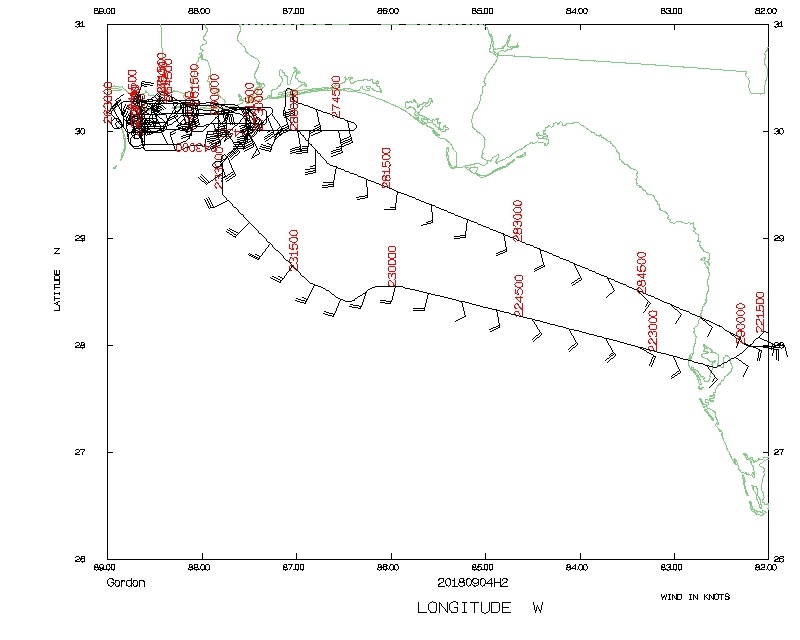
Figure 6. Actual flight track for mission 20180904H2. Flight-level winds (barbs) and wind speeds (shaded, kt) indicated (courtesy of www.tropicaltidbits.com). |
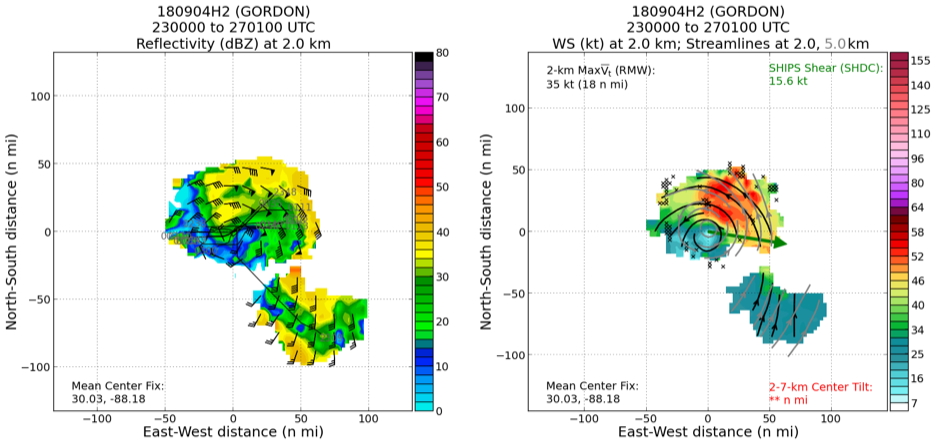
Figure 7 Reflectivity at 2 km (left) and wind speed at 2 km and 5 km (right), respectively. |
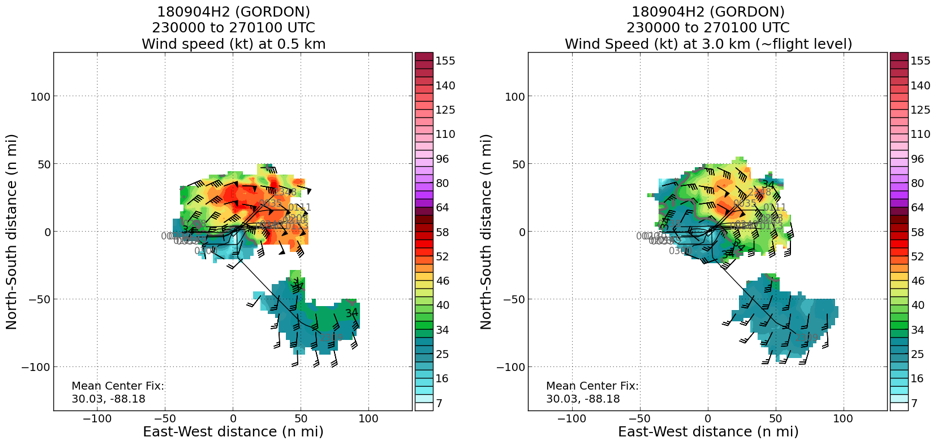
Figure 8. Wind speed at 0.5 km (left) and 2.5 km (right). |
Gordon finally made landfall around 0315 UTC (1015 PM CDT) just west of the Alabama-Mississippi border with maximum sustained winds of 70 mph (60 kt), just under hurricane strength. The mission hence was released from NHC. We were informed we still had some opportunity to conduct research tasking. The LPS decided to fly the offshore intense convection module, targeting an intense convective rainband just offshore south of pansacola (Fig. 9, local nearby NWS radar >35 dbZ ). While ideally the module would involve sampling both sides of the rainband, the western flank of the rainband was too cellular and quickly evolving. Hence, only the eastern flank of the rainband was sampled, where 3 dropsondes were released every ~20 nm, along with TDR analyses. The rainband initially was rather convective from the TDR real-time velocity display. As we flew further south, it was accompanied by some stratiform rain. From the second dropsonde location, we could also see some inflow from the real-time TDR velocity scanning. The evolution of the target rainband can be further found from the MMR and dropsondes skew-T analysis (Fig. 10).
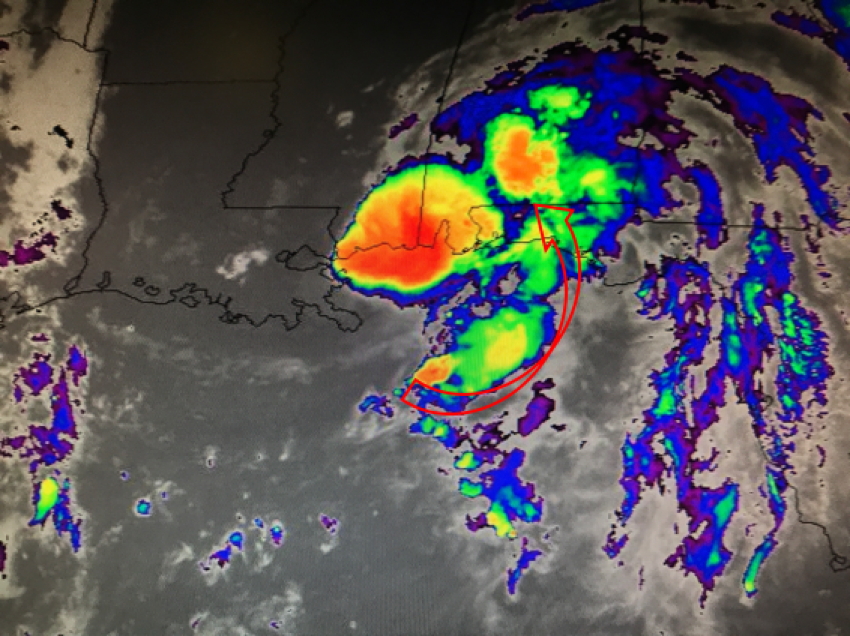
Fig. 9: IR image of Gordon around 0345 UTC with target rainband for the offshore intense convection module. |
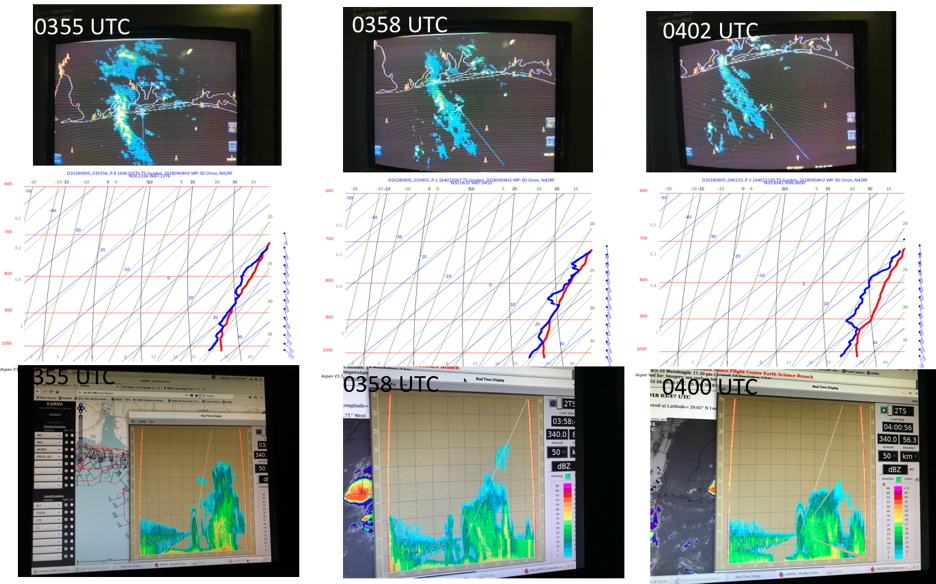
Fig. 10: Evolution of the offshore intense convection module from MMR (top), skew-T (middle) and TDR velocity (bottom). |
Mission Evaluation/Problems:
The objective of the mission was accomplished. We provided NHC the required fixes at 00Z and 06Z. Additionally, we were able to fly an offshore intense convection module to sample an intense rainband, which hopefully will help us better understand the processes that lead to tornadoes in the outer rainbands from landfalling tropical cyclones.
Hui Christophersen
October 15, 2018
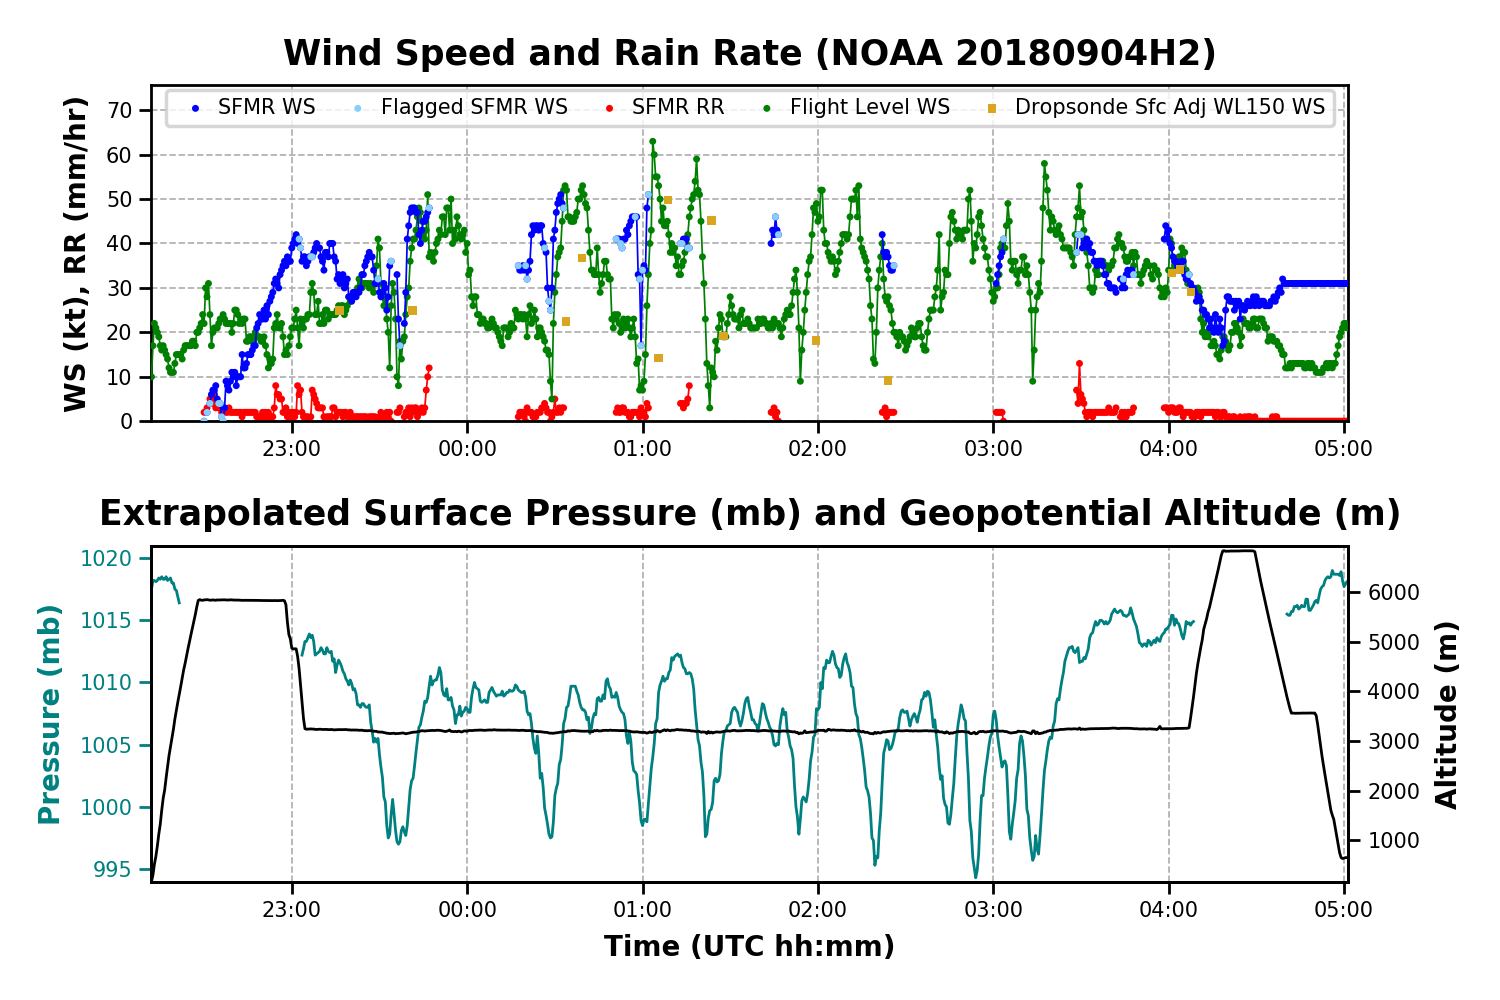
Timeseries wind, SFMR wind, rain rate, altitude and pressure plots |
Flight-level wind plot |
 Flight track |
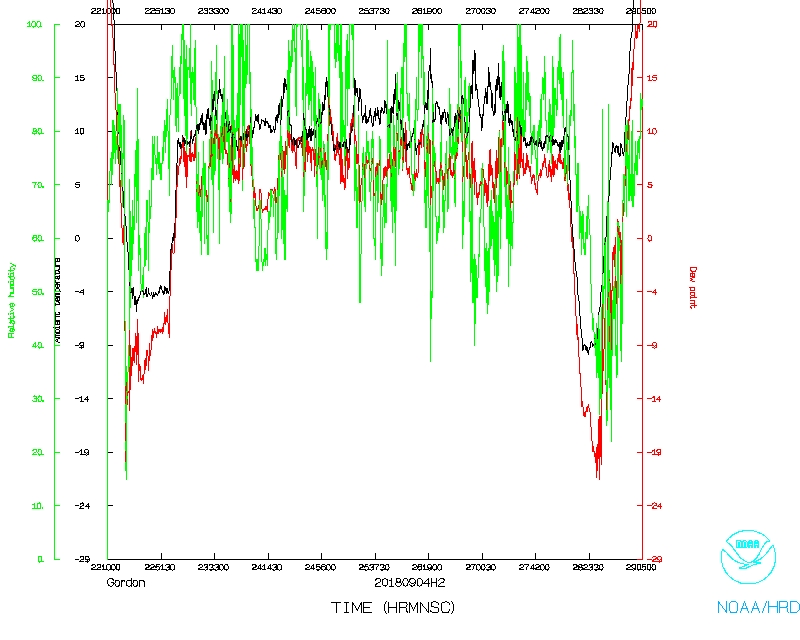 Temperature and Moisture |
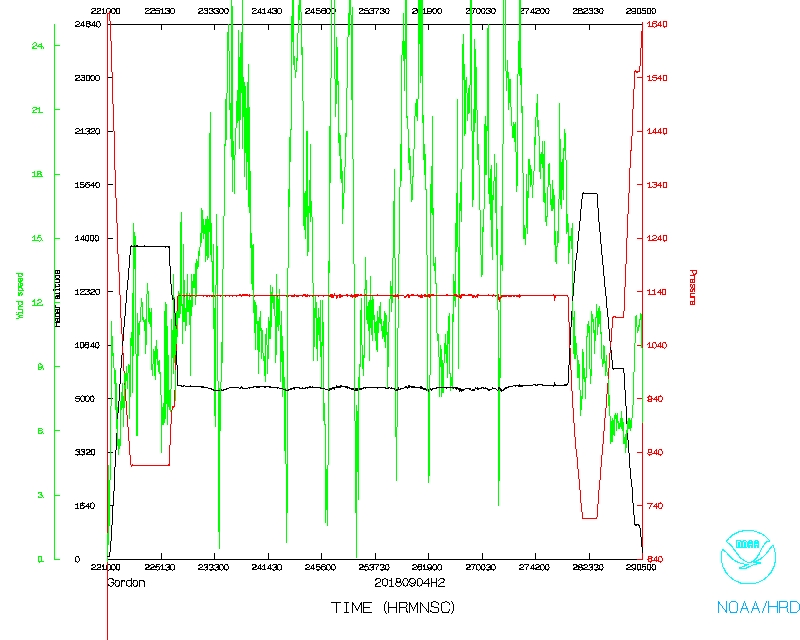 Wind and Atlitude |
 Flight track (detail) |
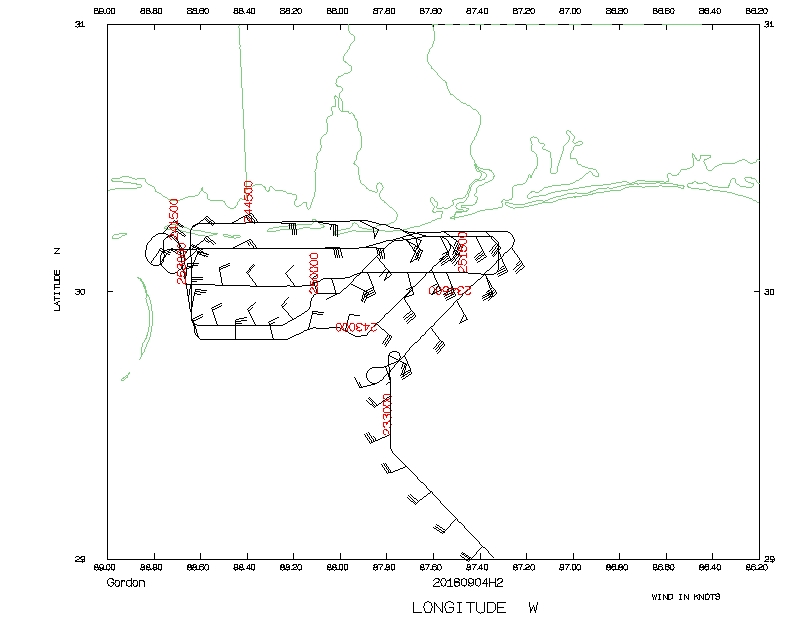 Flight track (detail) |
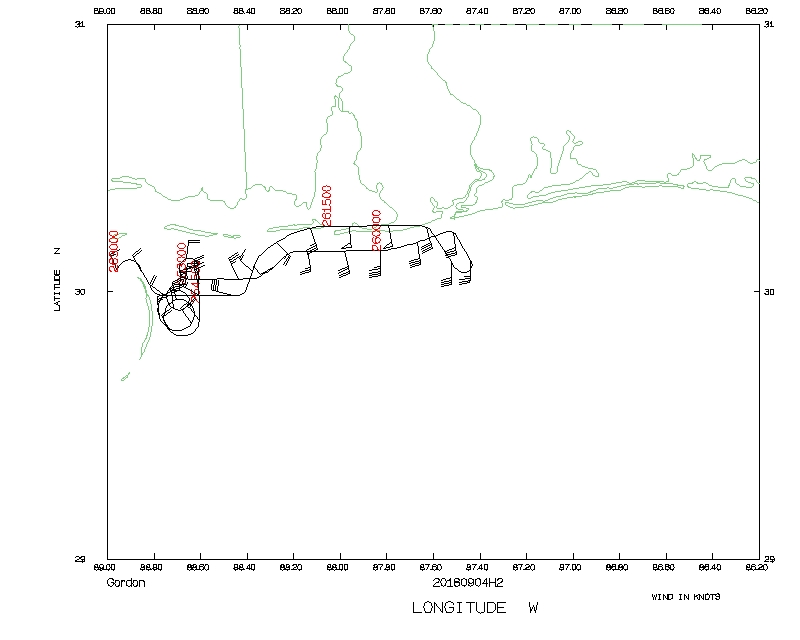 Flight track (detail) |
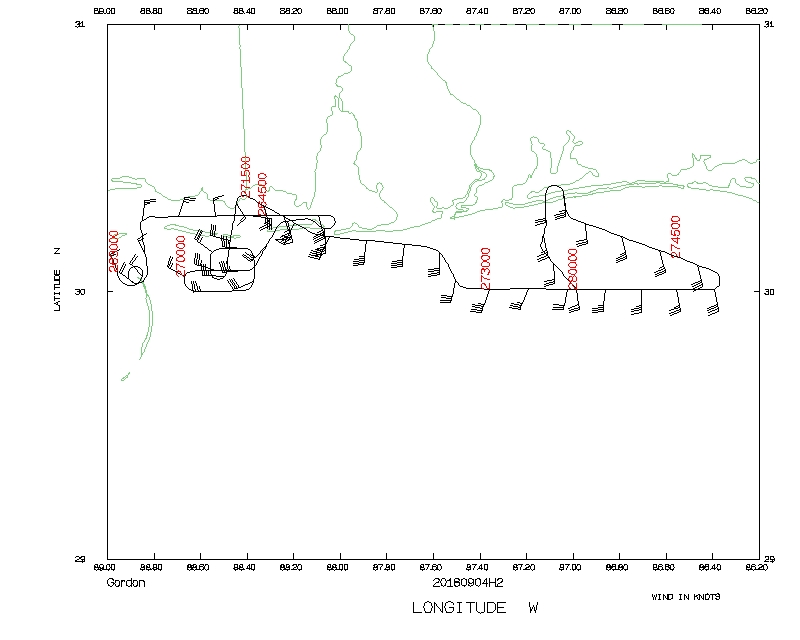 Flight track (detail) |
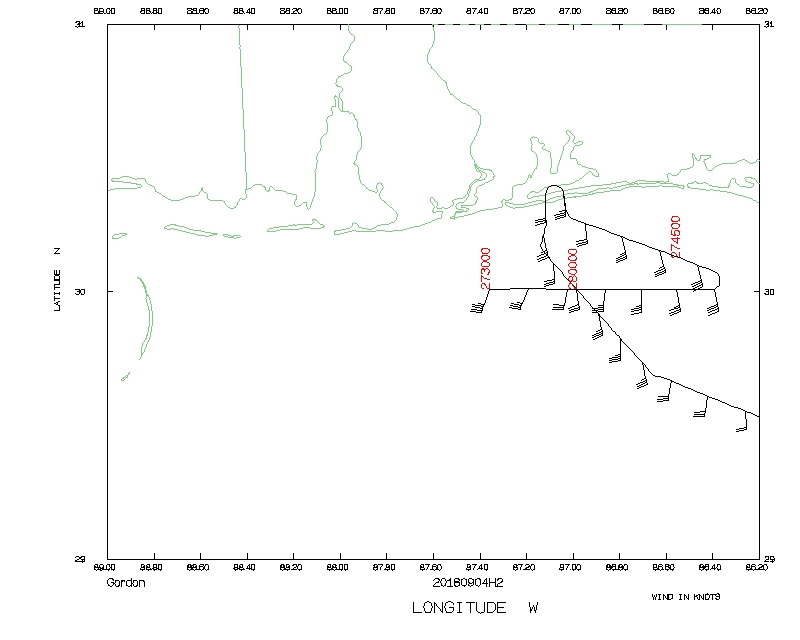 Flight track (detail) |
serial data
1 second data
SFMR data
Flight Director's manifest |
NetCDF data |
LPS log |
Radar log |
Drop log