 (a) |
 (b) |
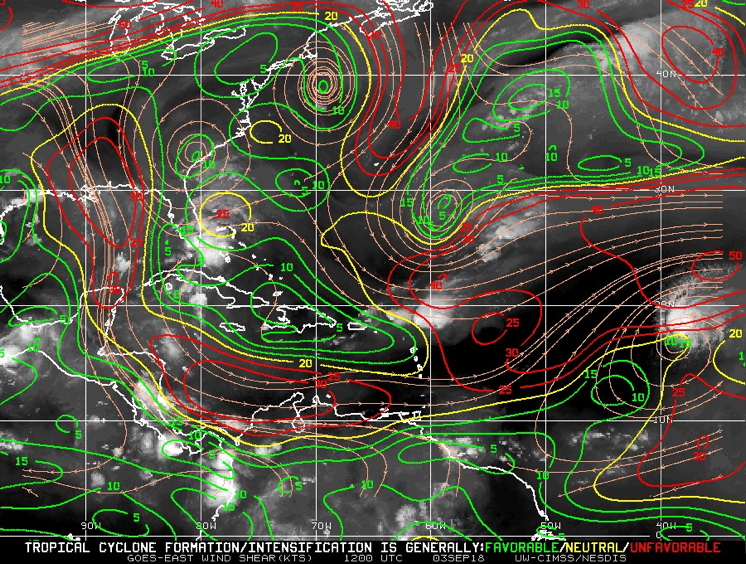
| Figure 1. (a) CIMSS analysis of 850-22hPa shear (contours, kt) and GOES-East infrared image valid 12 UTC 3 September; (b) SSMI total precipitatable water (shaded, mm) valid 12 UTC 3 September. | |
| Aircraft Commander | Scott Price, |
| Co-pilot | Adam Abitbol |
| Co-pilot | Kevin Doremos |
| Navigator | Brian Richards |
| Flight Engineer | |
| Flight Engineer | |
| Flight Director | Ian Sears |
| System Engineer | Mike Mascaro |
| Data Technician | Joe Greene |
| AVAPS Operator | Nick Underwood |
| LPS | Rob Rogers | HRD |
| Radar | Hui Christopherson | HRD |
| Dropsonde | Andy Hazelton | HRD |
| Observer | Kyle Ahern | FSU |
| Radar | HRD |
Mission Plan :
|
(a) |
(b) |
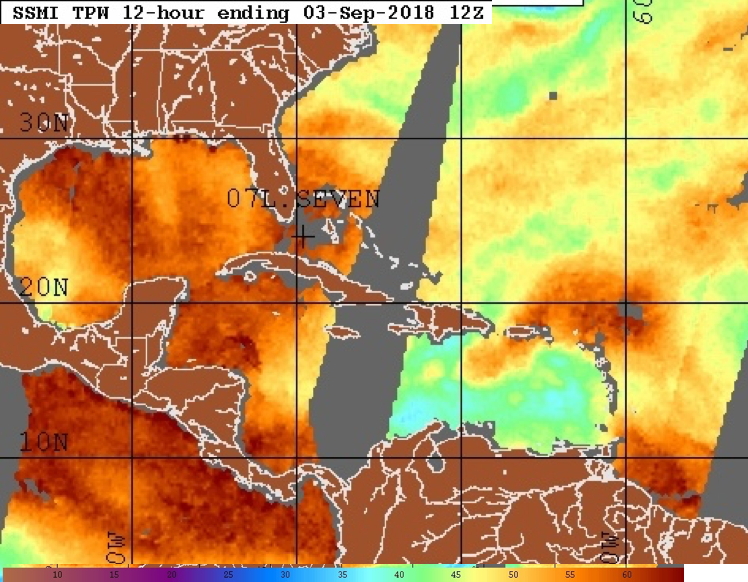
| Figure 1. (a) CIMSS analysis of 850-22hPa shear (contours, kt) and GOES-East infrared image valid 12 UTC 3 September; (b) SSMI total precipitatable water (shaded, mm) valid 12 UTC 3 September. | |
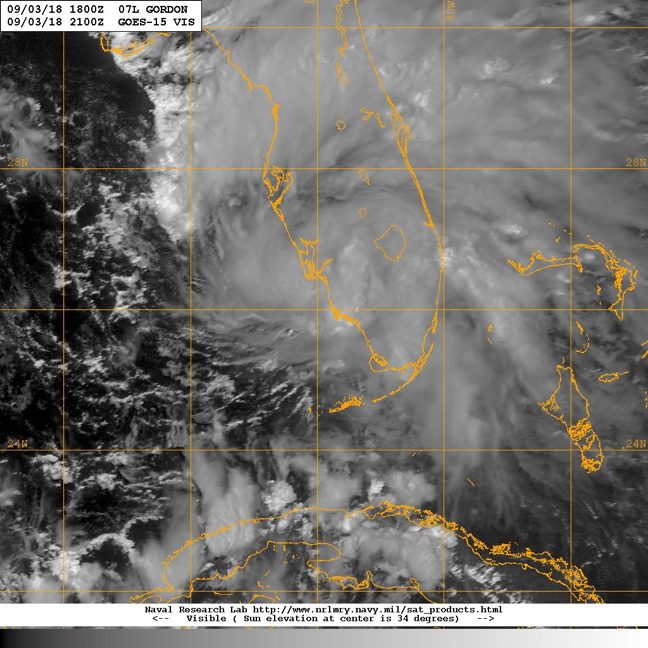
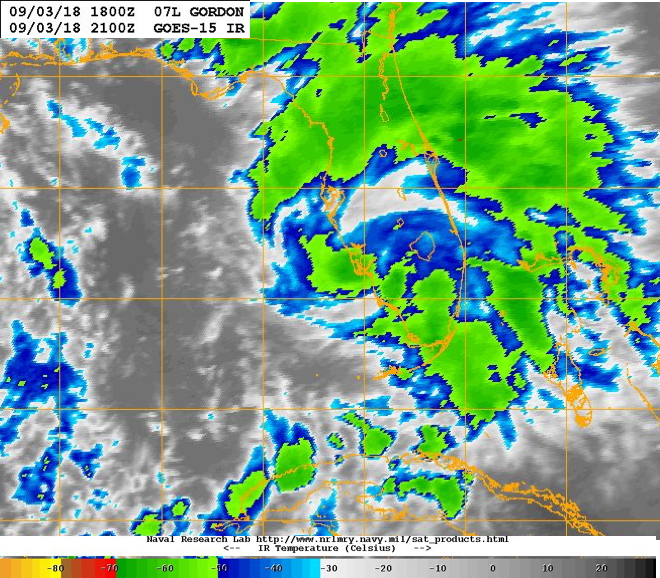
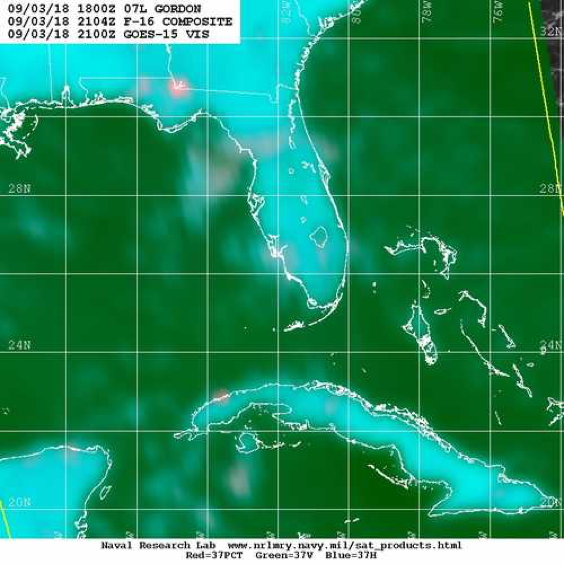
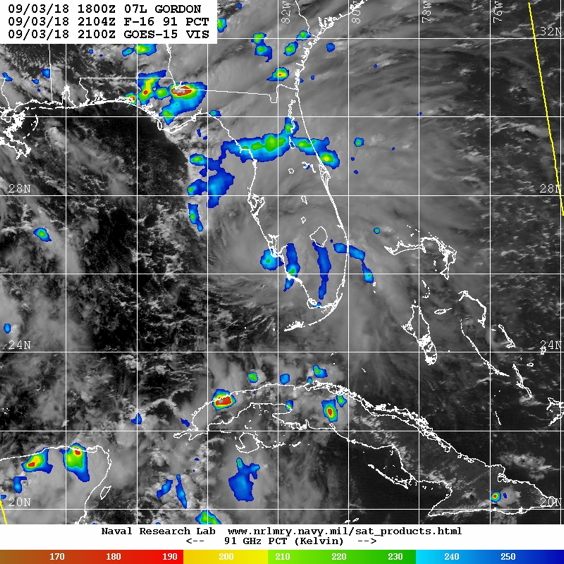
Conduct EMC-tasked missions into TS Gordon. Gordon has developed from a wave moving throught Florida Keys. It is encountering some weak to moderate westerly shear from an upper-level low to the north of the storm (Fig. 1a). Total precipitable water shows a generally moist envelope around the storm, but there are some indications of lower-TPW air on the west and southwest side of the storm (Fig. 1b). This dry air is further indicated by visible, infrared, and water vapor satellite imagery (Figs. 2-3), which shows that the bulk of the cloud shield is on the east side of a northwest-southeast oriented axis through the storm, primarily over the Florida peninsula. There are little to no cold cloud tops, and consequently little indication of deep convection within the circulation. A 37 GHz image (Fig. 4a) shows limited regions of heavy rainfall off the west coast of Florida, with a small area of ice scattering (Fig. 4b) associated with some regions of heavier precipitation on the south side of the center. The forecast calls for Gordon to track quickly to the northwest, over the eastern Gulf of Mexico and into the Louisiana/Mississippi border in about 36 h. There is a potential for intensification, especially if the shear relaxes more, deep convection develops, and symmetrization of the precipitation occurs.
 (a) |
 (b) |
| Figure 2. (a) GOES-15 visable image valid 21 UTC 3 September; (b) GOES-15 infared image valid 21 UTC 3 September. | |
The initial plan (Fig. 5) called for flying an initial lawnmower pattern, oriented north-south (2 legs), ending to the north, at highest altitude possible to sample the temperature and humidity environment ahead of and on the west side of the storm. Then descend to 10 kft, proceed to fly butterfly with IP to the northwest, finishing to the northeast. Follow butterfly with convective burst module at LPS advisement. 8 sondes in lawnmower (4 evenly spaced on each leg), endpoints (6) and midpoints (6) of butterfly, surface RMW requested by EMC, centers. If there were an opportunity to fly circles for the SFMR, that would be done too.
|
Prepared by the Hurricane Research Division Aircraft: N42RF Proposed takeoff: 3/2030Z
DROP LOCATION TABLE
| #
| LAT
| LON
| RAD/AZM
| Time
|
| deg min
| deg min
| nmi/deg
| hr:min
| 1 | 28 00 | 84 00 | 0:21
| 2I | 27 00 | 84 00 | 0:34
| 3I | 26 00 | 84 00 | 0:47
| 4 | 25 00 | 84 00 | 1:00
| 5 | 25 00 | 85 00 | 1:13
| 6I | 26 00 | 85 00 | 1:26
| 7I | 27 00 | 85 00 | 1:39
| 8 | 28 00 | 85 00 | 1:52
| 9S | 27 30 | 83 50 | 90/330 | 2:10
| 10S | 24 54 | 82 10 | 90/150 | 2:56
| 11S | 26 12 | 81 20 | 90/090 | 3:19
| 12S | 26 12 | 84 40 | 90/270 | 4:05
| 13S | 24 54 | 83 50 | 90/210 | 4:28
| 14S | 27 30 | 82 10 | 90/030 | 5:14
| | ||||||||||||||||||||||
Mission Summary :
| Take off | Landing
| Linder-Lakeland, FL
| 20:27 UTC
| Linder-Lakeland, FL
| 23:57 UTC
| Penetrations
| 1
| | ||||
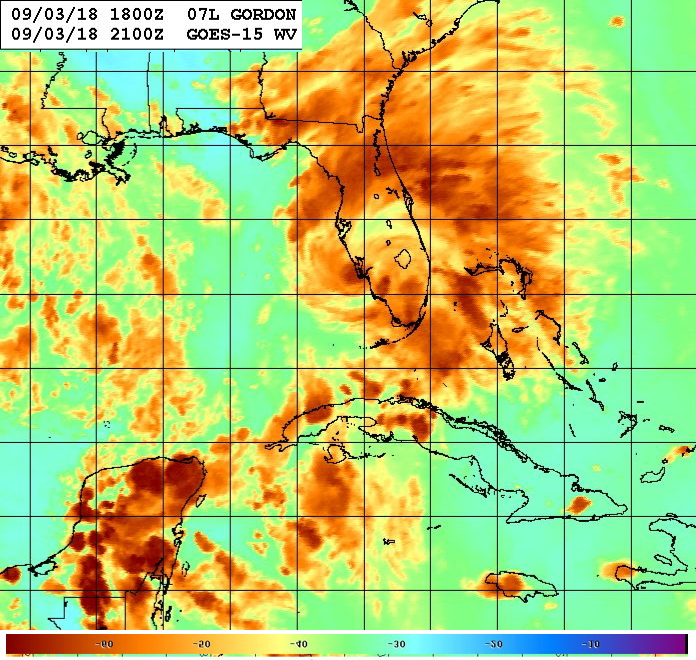 Figure 3. (a) GOES-15 water vapor brightness temperature (°C) valid 21 UTC 3 September. |
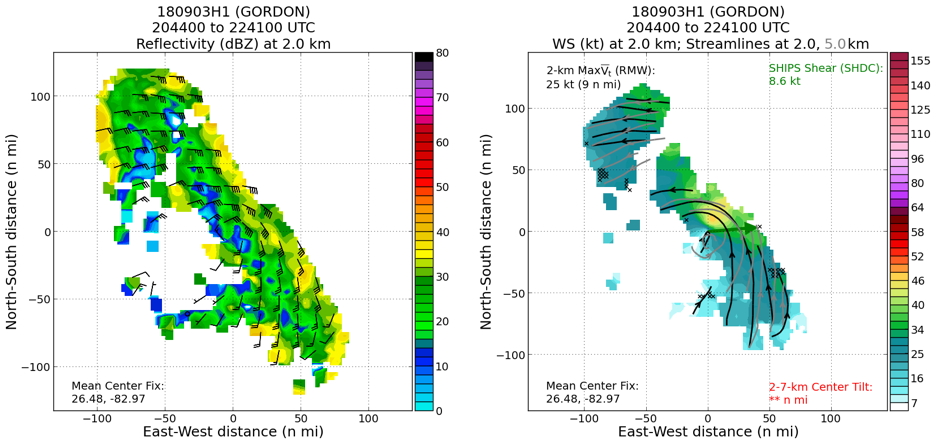
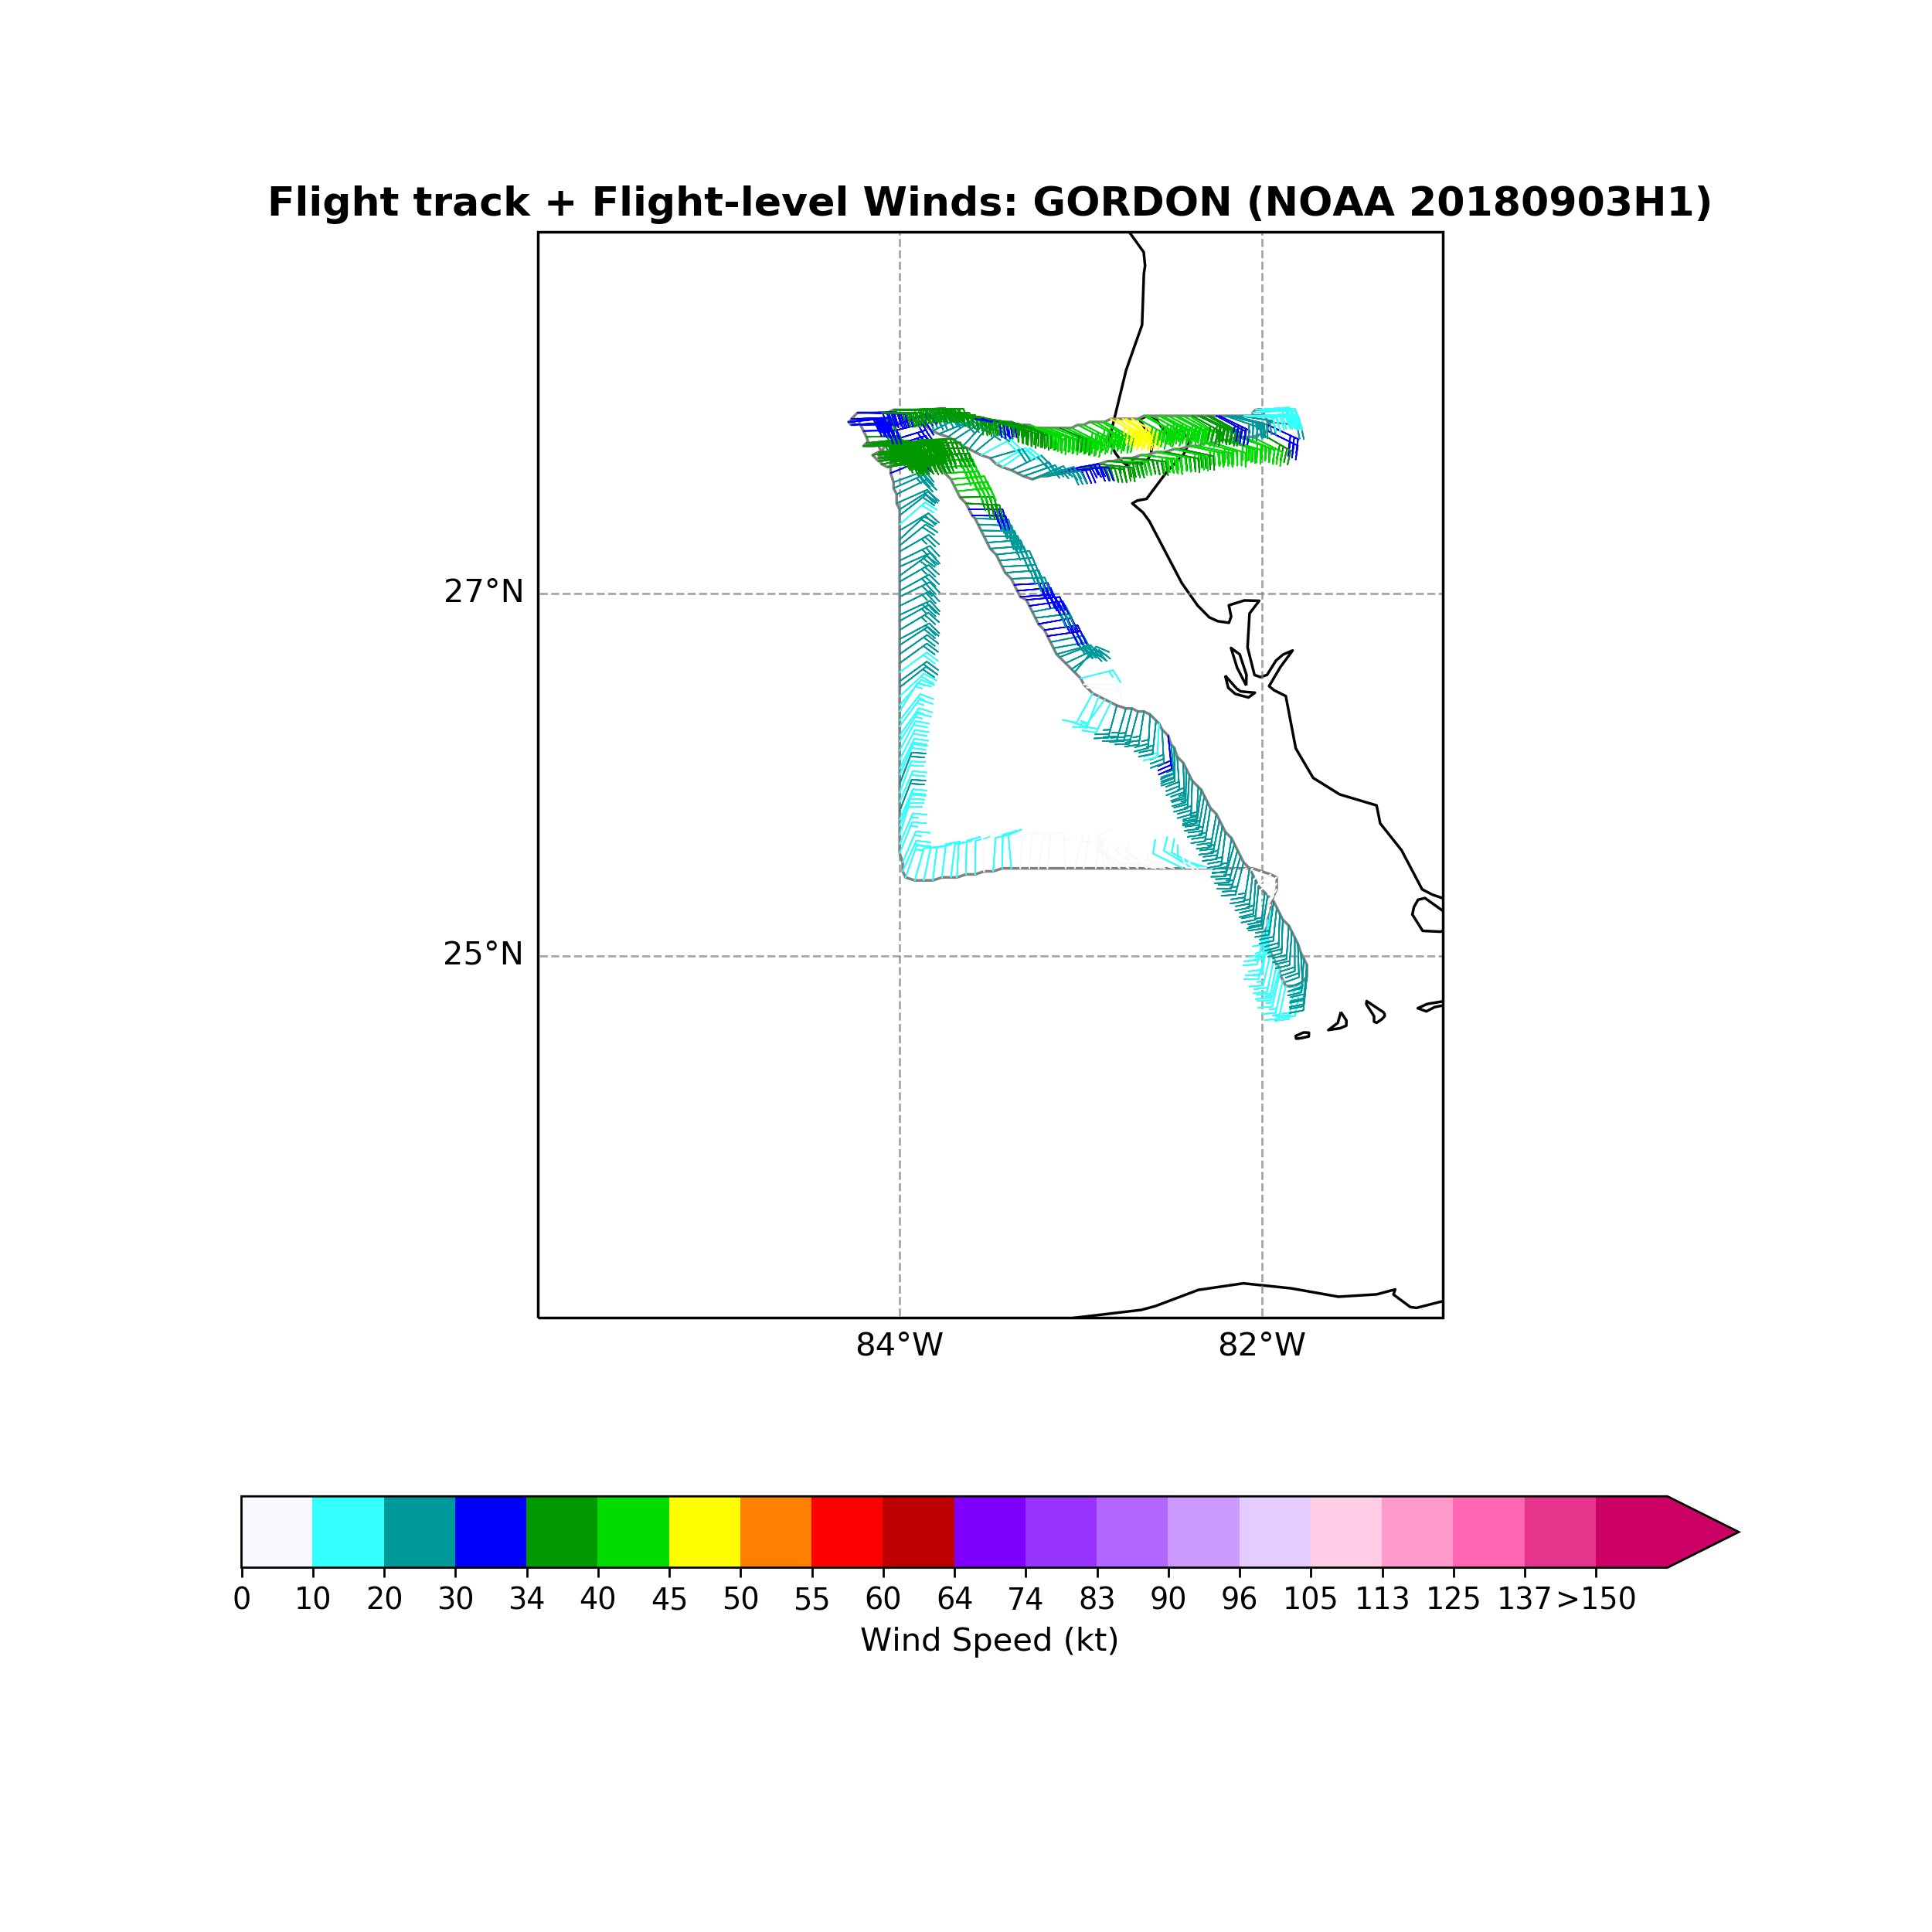
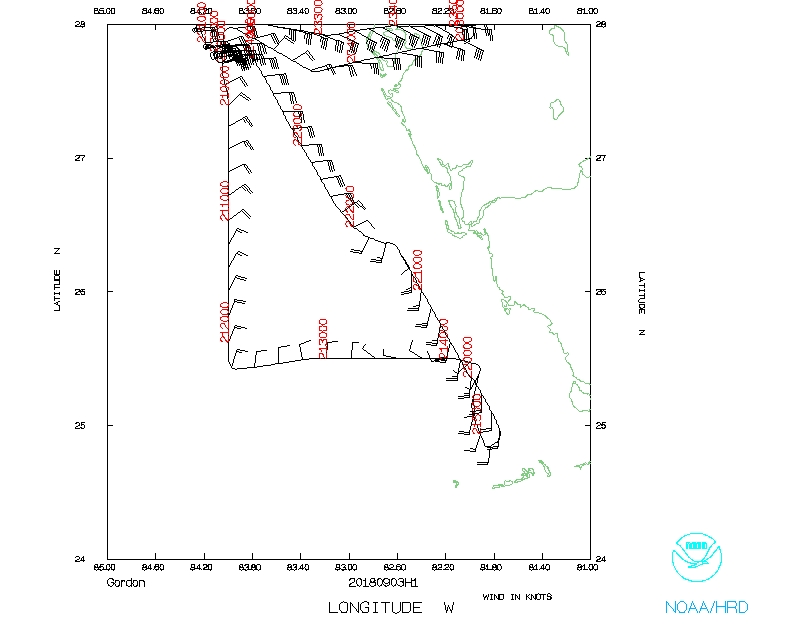
The actual flight track (Fig. 6) was adjusted to fly an L-shaped initial survey pattern instead of a lawnmower pattern. This was done to provide some sampling of the thermodynamic environment on both the west and the south sides of the storm, where satellite imagery suggested dry air was prevalent (Figs. 2-3). The initial drops on the survey pattern were released at about 17 kft. By the third drop the aircraft had climbed to 19.2 kft. The first drop was fairly moist, but the next few drops were dry. We were generally in a cirrus shield for that north-south survey leg. After the completion of the L-survey, we began the butterfly pattern after descending to 10 kft, with the first point on the southeast side. The surface winds were too weak here, so no circles were attempted on the southeast side. There was little in the way of substantial precipitation on the southeast side, with a cirrus shield above and low-level cumulus below. There was some turbulence (limited) near the center. Radar analyses (Fig. 7) showed a highly asymmetric wind field, with maximum winds on the northeast side and nearly calm winds on the southwest side (Fig. 7a). There was a small core of higher winds that was > 50 kt north of the center at 0.5 km altitude. This wind speed core rotated upwind with height, being located on the northeast side of the storm at 3 km altitude. After the completion of the outbound leg to the northwest we did SFMR circles.
 (a) |
 (b) |
| Figure 4. (a) F-16 37 GHZ composite image valid 2104 UTC 3 September; (b) F-16 91 GHZ PCT image valid 2104 UTC 3 September. | |
After completion of the circles we were notified that there was a hydraulic leak. As a result we had to abort the mission prematurely and return to base.
Mission Evaluation :
Some of the mission objectives were achieved. Specifically, the survey pattern was flown and drops were released, providing information of the thermodynamic profiles on the west and south side of the storm. One southeast-northwest leg, and SFMR circles, were flown. The storm was found to be highly asymmetric, with a core of strong winds on the north and northeast sides. Unfortunately not enough of the storm could be sampled to produce a complete picture of the storm structure.
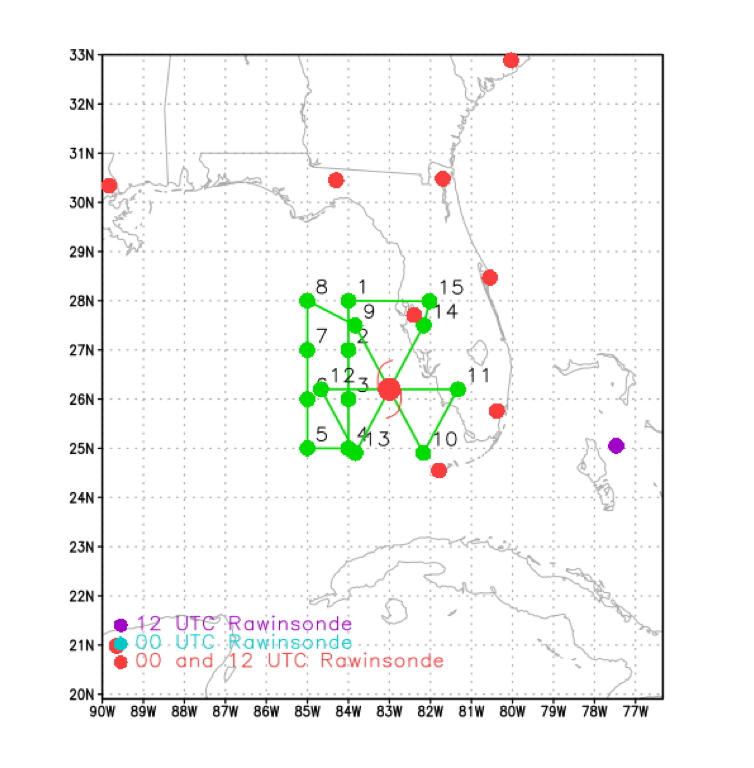 Figure 5.Proposed flight track for mission 20180903H1. |
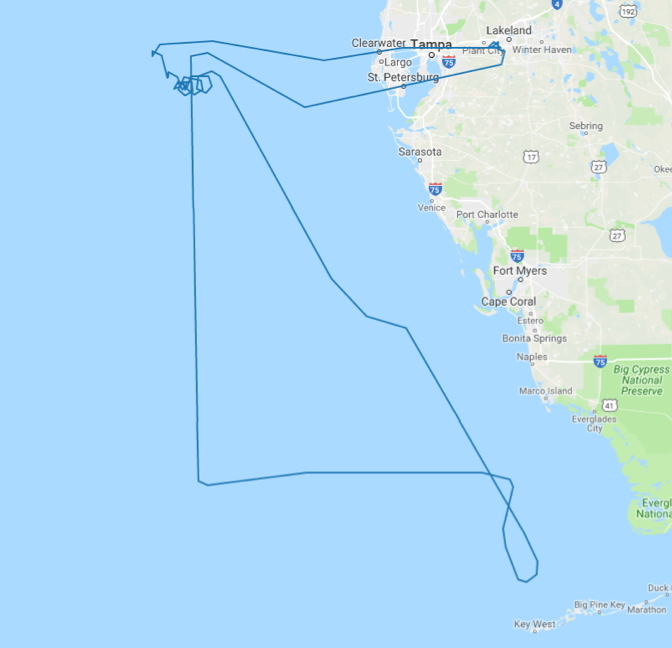 Figure 6.Actual flight track for mission 20180903H1. |
Problems :
The mission was aborted prematurely due to a hydraulic leak. All of the 12 dropsondes released worked, though only one of the three AXBTs (the center AXBT) worked.
 |
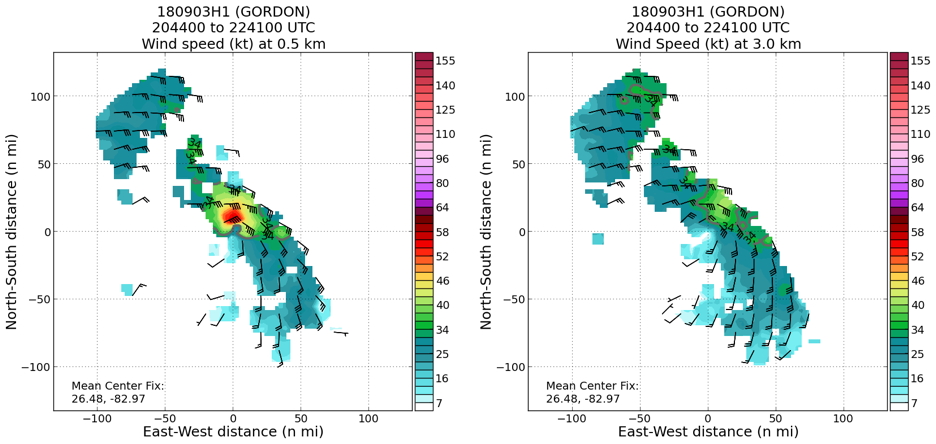 |
| Figure 7. (a) Tail-Doppler derived reflectivity (shaded, dBZ) and winds (barb, kt) at 2-km altitude for P-3 pattern flown from 20:44-22:41 UTC 3 September (b) as in (a), but for wind speed at 2 km (shaded, kt) and streamlines at 2 (black) and 5 (grem) km; (c) as in (a), but for wind speed (shaded, kt) and barbs (kt) at 0.5 km; (d) as in (a), but for wind speed (shaded, kt) and barbs (kt) at 3.0 km. |
Rob Rogers
October 12, 2018
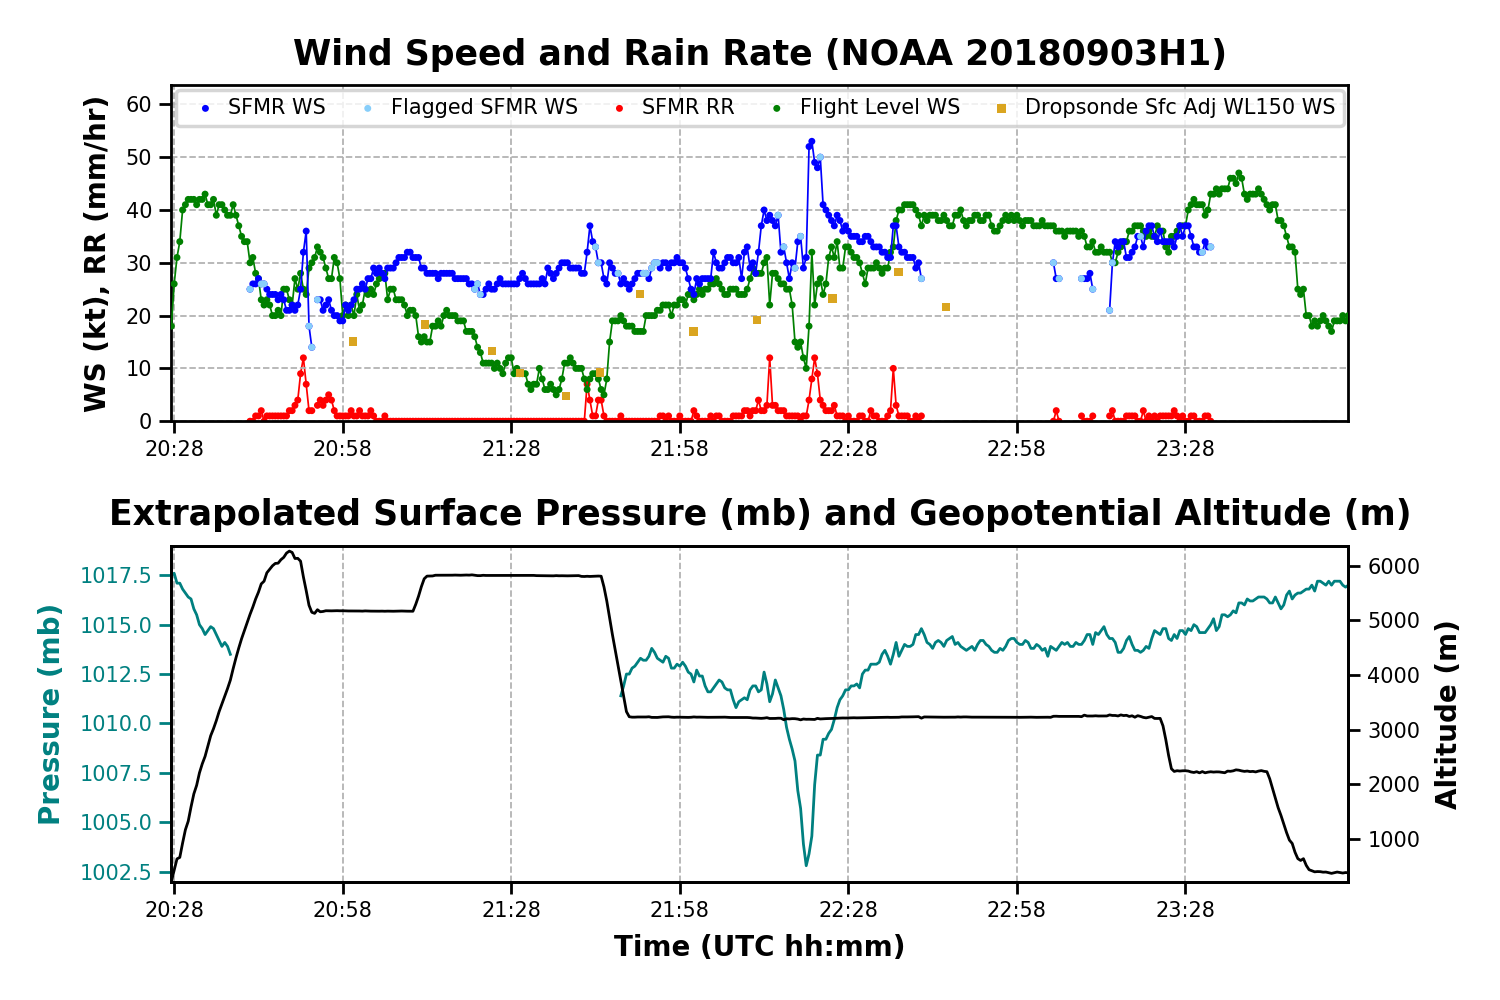
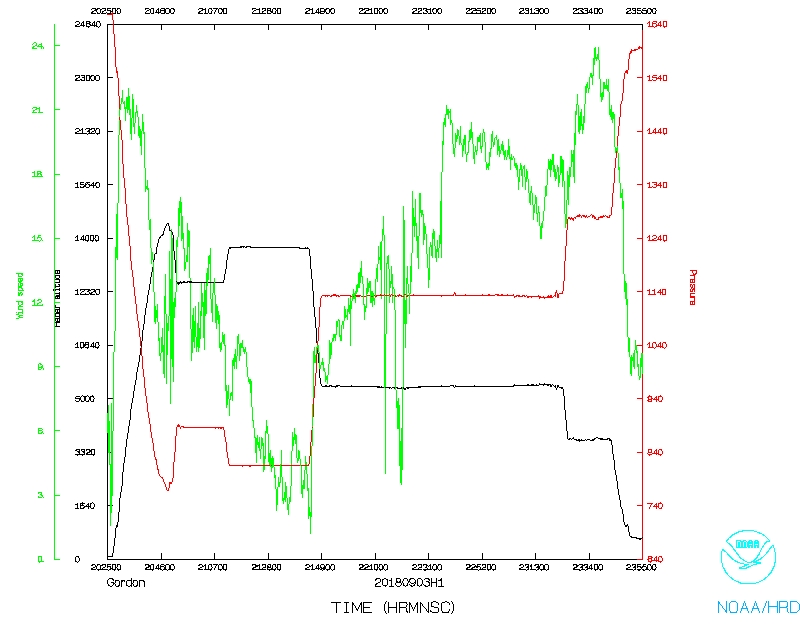
Timeseries wind, SFMR wind, rain rate, altitude and pressure plots |
Flight level wind plot |
 Flight track |
 Temperature and Moisture |
 Wind and Atlitude |
serial data
1 second data
Flight Director's manifest |
NetCDF data |
LPS log |
Radar log |
SFMR data
Drop log