Mission Summary
20180928H1 Aircraft 42RF
Genesis (pre-Sergio)
Aircraft Crew (42RF)
| Aircraft Commander | Scott Price
|
| Co-pilot | John Rossi
|
| Co-pilot | Nate Kahn
|
| Flight Engineer | Mike Sanchez
|
| Navigator | Brian Richards
|
| Flight Director | Ian Sears
|
| System Engineer | Mike Mascaro
|
| Data Technician | Joe Greene
|
Science crew (42RF)
| LPS | Jon Zawislak | HRD
|
| Dropsonde | Jun Zhang | HRD
|
| Radar | Rob Rogers | HRD
|
| LPS | Paul Chang | NESDIS
|
| Observer | Joe Sapp | NESDIS
|
| Observer | Zorana Jelenak | NESDIS
|
Science crew (Ground)
| Radar | Paul Resor | HRD
|
Mission Plan :
NOAA42 will conduct a research mission in the East Pacific for the HFP-IFEX
Genesis Stage Experiment, Objectives #1 (Precipitation Mode) and #2 (Pouch).
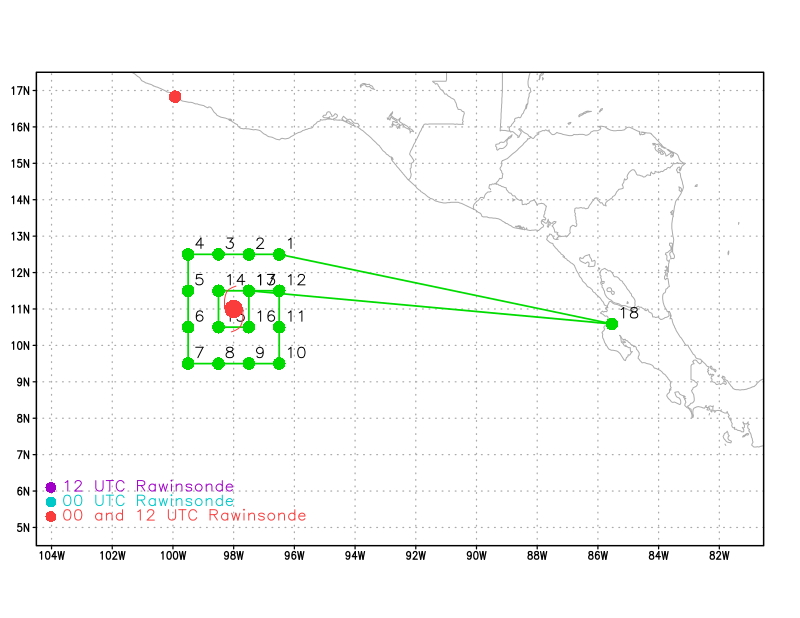
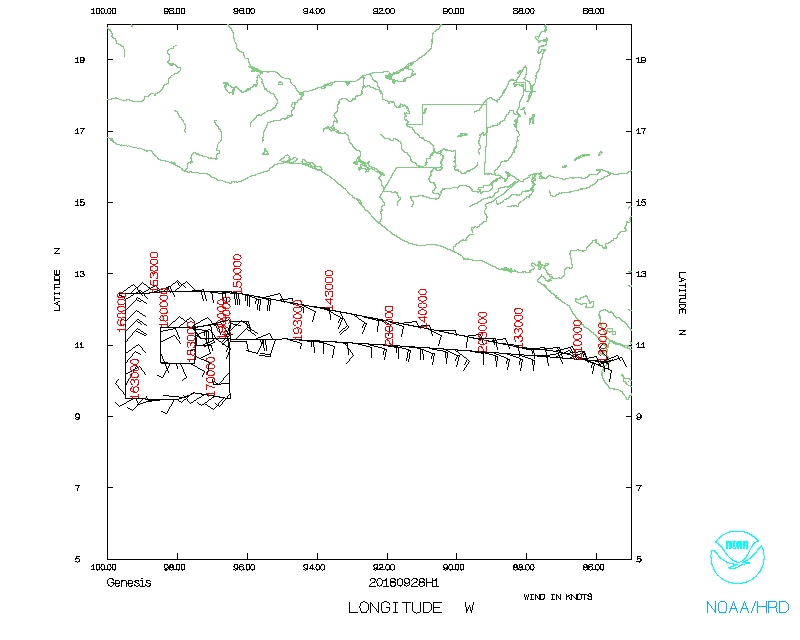
The initial plan calls for a square spiral pattern (Fig. 1), with a width of
3x3 degrees on the outer square and 1x1 degree in the inner square. Dropsondes
will be released at each of the corners of the two squares, as well as 2
equally spaced sondes (every 1 degree) on the northern, western, and southern
edges of the outer square. The pattern will be flown at 12 kft pressure to
accommodate the IWRAP data collection. We will attempt to do include TDR
analyses on the way in and out, fairly close to the starting and ending points
of the square-spiral pattern. The square spiral will be flown counterclockwise.
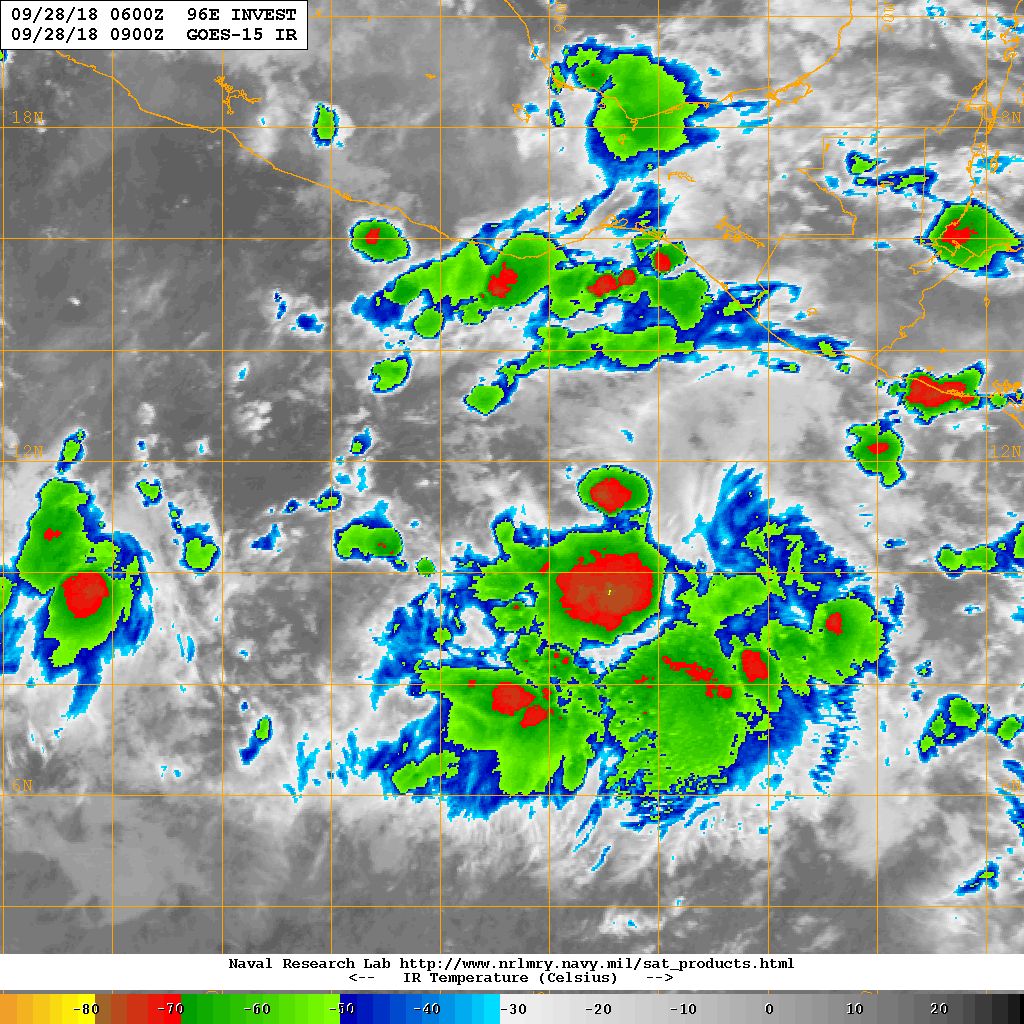
EP96 is certainly looking healthier this morning, especially considering a
large convective burst has developed just southeast of the apparent broad
surface / low-level circulation center (Fig. 2) (between 9-12°N /
94-96°W) While that surface circulation is likely still quite broad,
increasing convective/stratiform activity close to that region could allow it
to consolidate some today. The mesoscale convective system (MCS) currently
located to the south and east certainly could be influential in terms of
developing a mid-tropospheric convective vortex (MCV), which could subsequently
be a focal point for surface spin up. NHC has given EP96 a 70/90% chance of
formation in 2/5 days, which is consistent of having increased convective
coverage, a clear circulation at low-levels, and optimistic global model
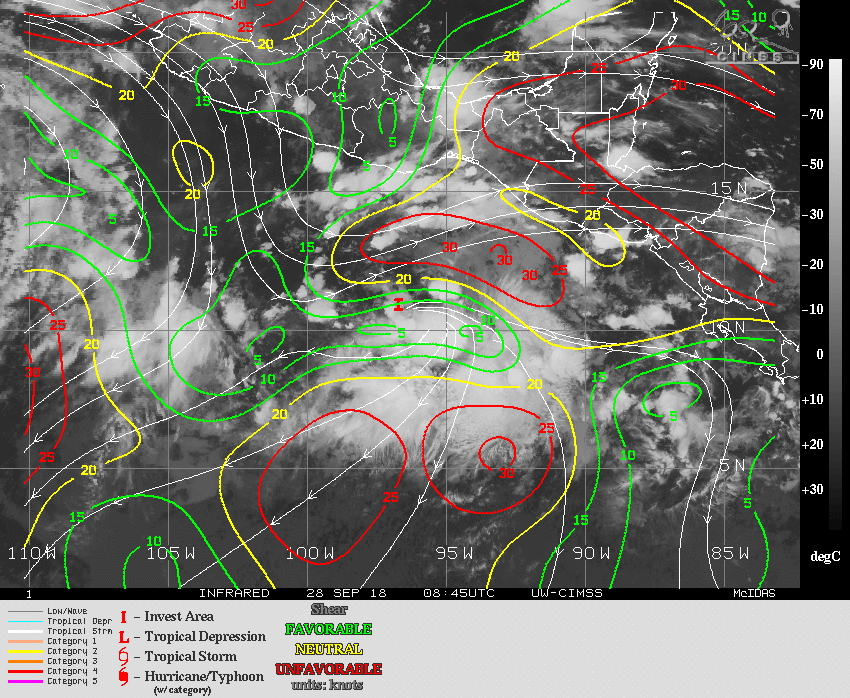
forecasts. The only hindrance at the moment seems to be a high shear zone
bordering the disturbance on the north side (Fig. 3). This has caused a
significant shear gradient over the area of the disturbance. This would
certainly suggest that the 3 kt analyzed for the SHIPS deep layer shear is
likely not indicative of the actual environmental shear magnitude, and what
the disturbance is actually experiencing. This could result in a separation
of any midlevel circulation from the low-level, and perhaps result in the
intrusion or production of dry air from subsidence over the low or surface
circulation, causing stabilization and inhibited convective development in the
area that needs it the most for genesis.
We have moved the initially planned square spiral pattern 1 degree west to
accommodate the slower speed of the disturbance than the models suggested
yesterday, centering it at 11°N/98°W. This will hopefully capture
the surface circulation we observed yesterday again, as well as any MCVs within
the precipitation region.
Mission Summary :
| Take off
| Landing
| Liberia, Costa Rica
| 12:56 UTC
| Liberia, Costa Rica
| 21:14 UTC
| | Expendables
| 18 Dropsonde (14 HRD, 4 IR), 0
AXBT
| |
RESEARCH MISSION PLAN: INVEST 96E
Prepared by the Hurricane Research Division
Sept. 26, 2018 7:16 PM EDT
Aircraft: N42RF
Proposed takeoff: 28/1300Z
|
|
DROP LOCATION TABLE
|
| #
| LAT
| LON
| Time
|
|
| deg min
| deg min
| hr:min
|
| 1 | 12 30 | 96 30 | 2:01
|
| 2I | 12 30 | 97 30 | 2:14
|
| 3I | 12 30 | 98 30 | 2:27
|
| 4 | 12 30 | 99 30 | 2:41
|
| 5I | 11 30 | 99 30 | 2:55
|
| 6I | 10 30 | 99 30 | 3:08
|
| 7 | 9 30 | 99 30 | 3:22
|
| 8I | 9 30 | 98 30 | 3:36
|
| 9I | 9 30 | 97 30 | 3:49
|
| 10 | 9 30 | 96 30 | 4:03
|
| 11 | 10 30 | 96 30 | 4:17
|
| 12 | 11 30 | 96 30 | 4:32
|
| 13 | 11 30 | 97 30 | 4:46
|
| 14 | 11 30 | 98 30 | 5:00
|
| 15 | 10 30 | 98 30 | 5:14
|
| 16 | 10 30 | 97 30 | 5:28
|
| 17 | 11 30 | 97 30 | 5:43
|
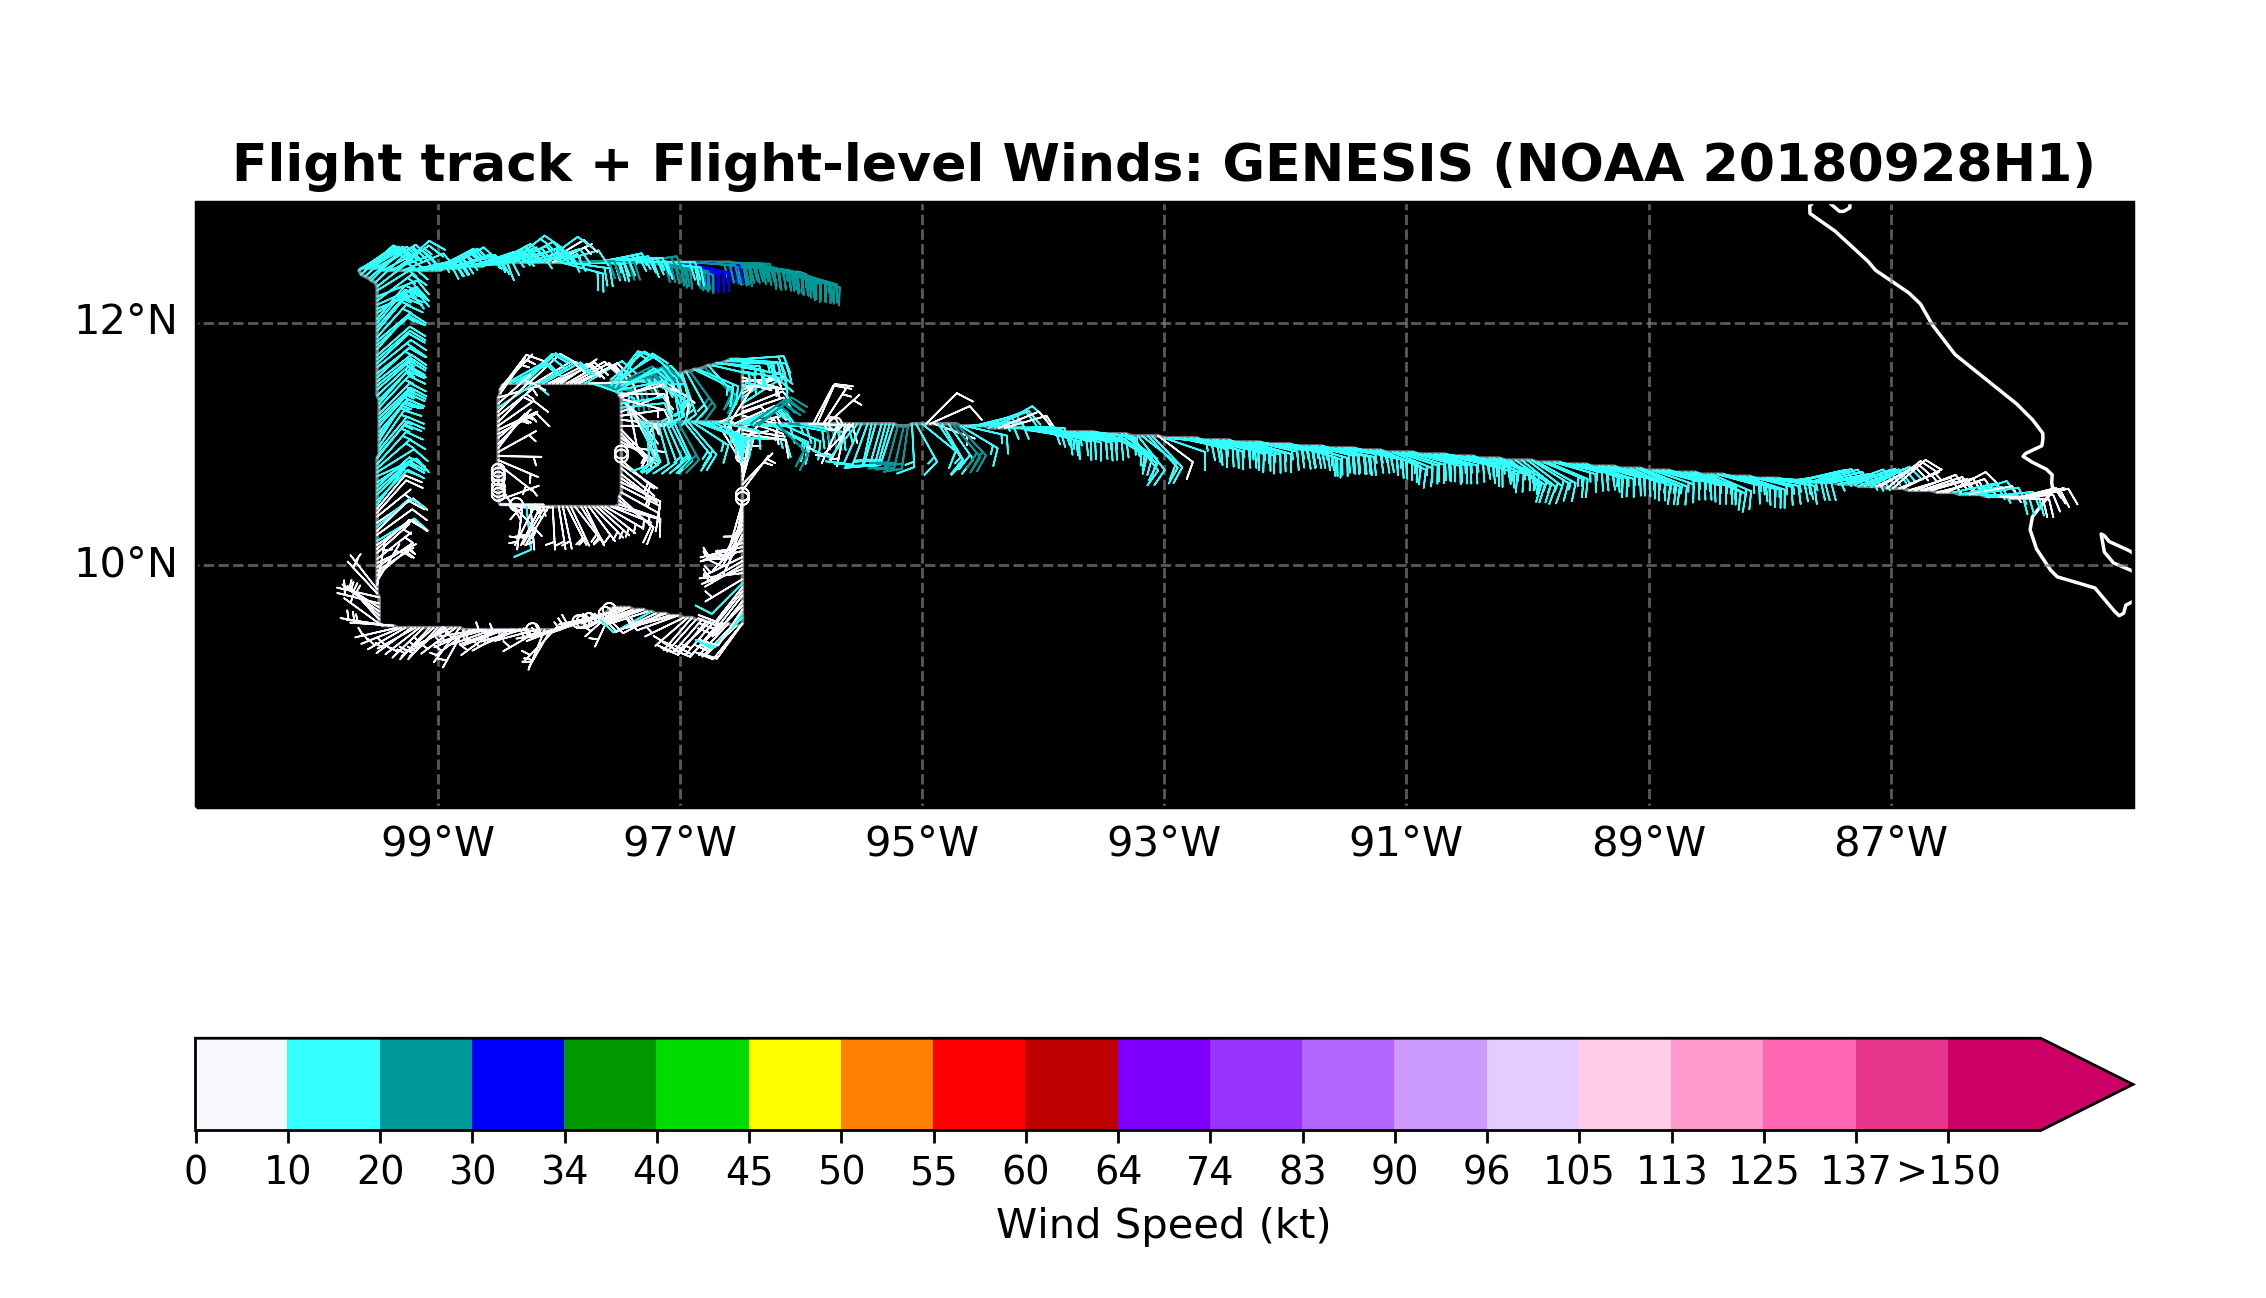
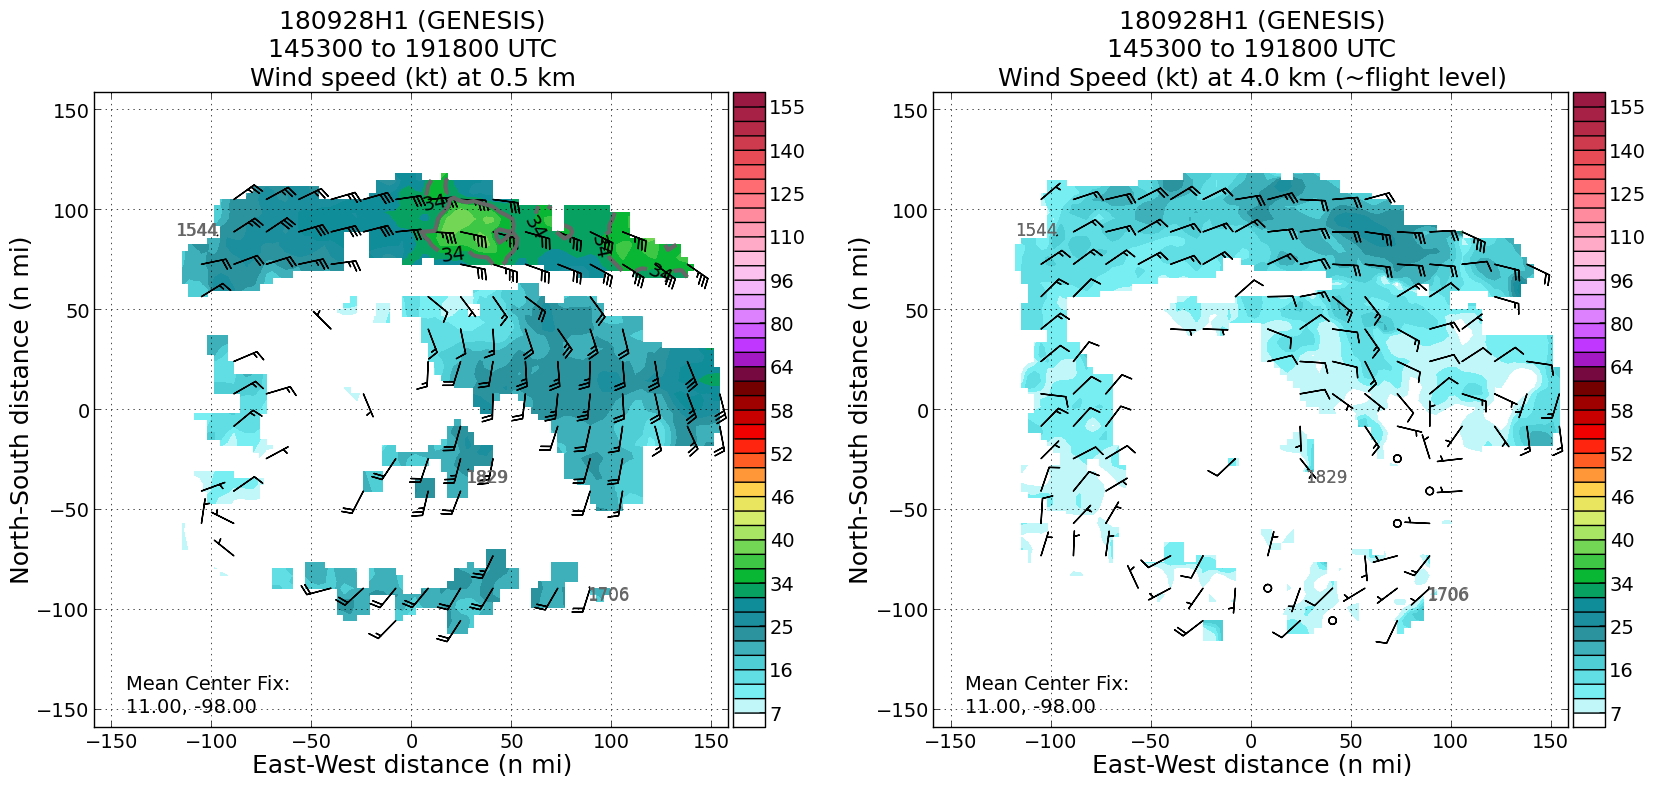
The actual track of the mission is shown in Fig. 4, with wind information at
flight level (FL), extrapolated sea level pressure (SLP), and SFMR surface wind
speed and rain rate shown in Fig. 5. The transit to the IP of the outer square
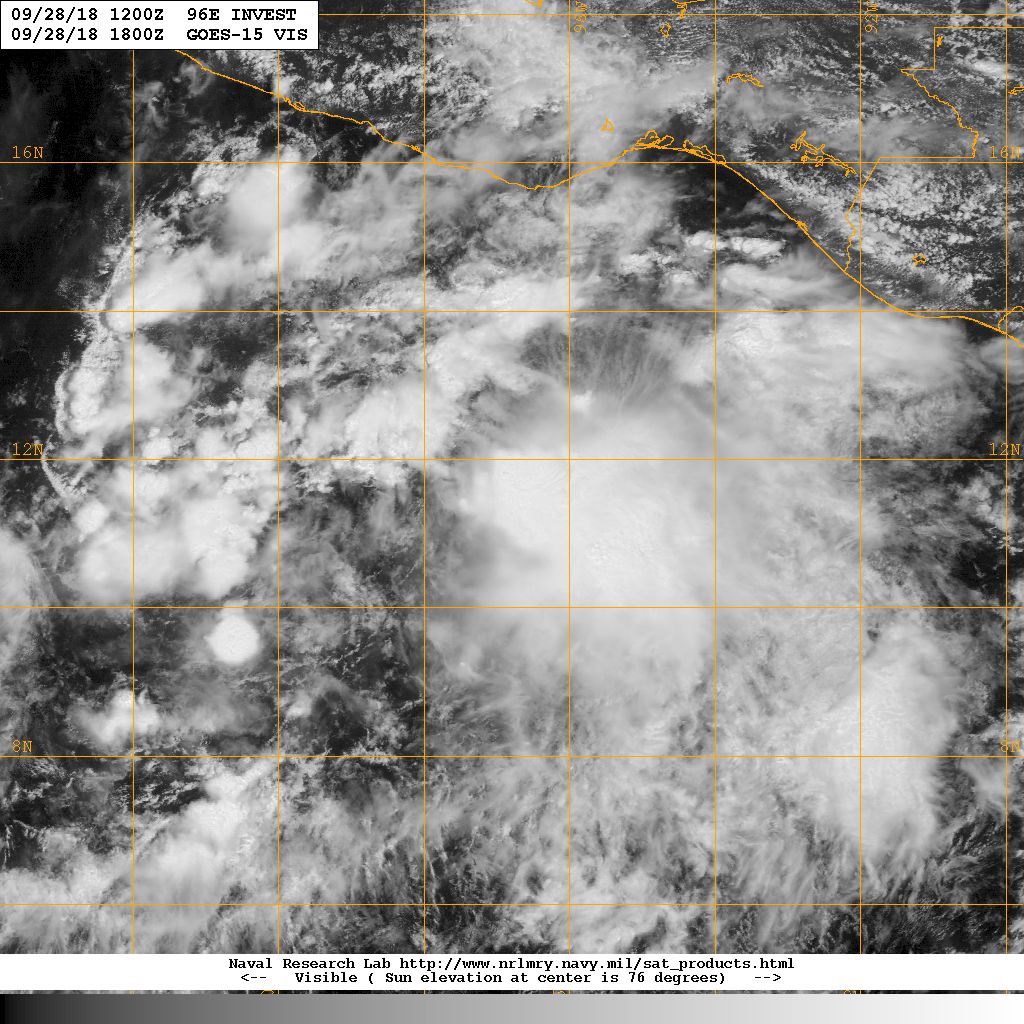
(northeast corner) was about 2 hr. On our way in, we passed just north of the
MCS we observed on satellite that developed east of the apparent broad
circulation overnight (Figs. 2, 6). We reached the IP near 12.5°N /
96.5°W at 1504 UTC (Sonde #1) and began our westbound trek on the northern
side of the outer square. We dropped both intermediate sondes along the leg at
12.5°N at 1516 (WP #2) and 1529 (WP #3) UTC (Sondes #2, #3). There was some
scattered deep convection (Fig. 6) to our north on the leg, which was allowing
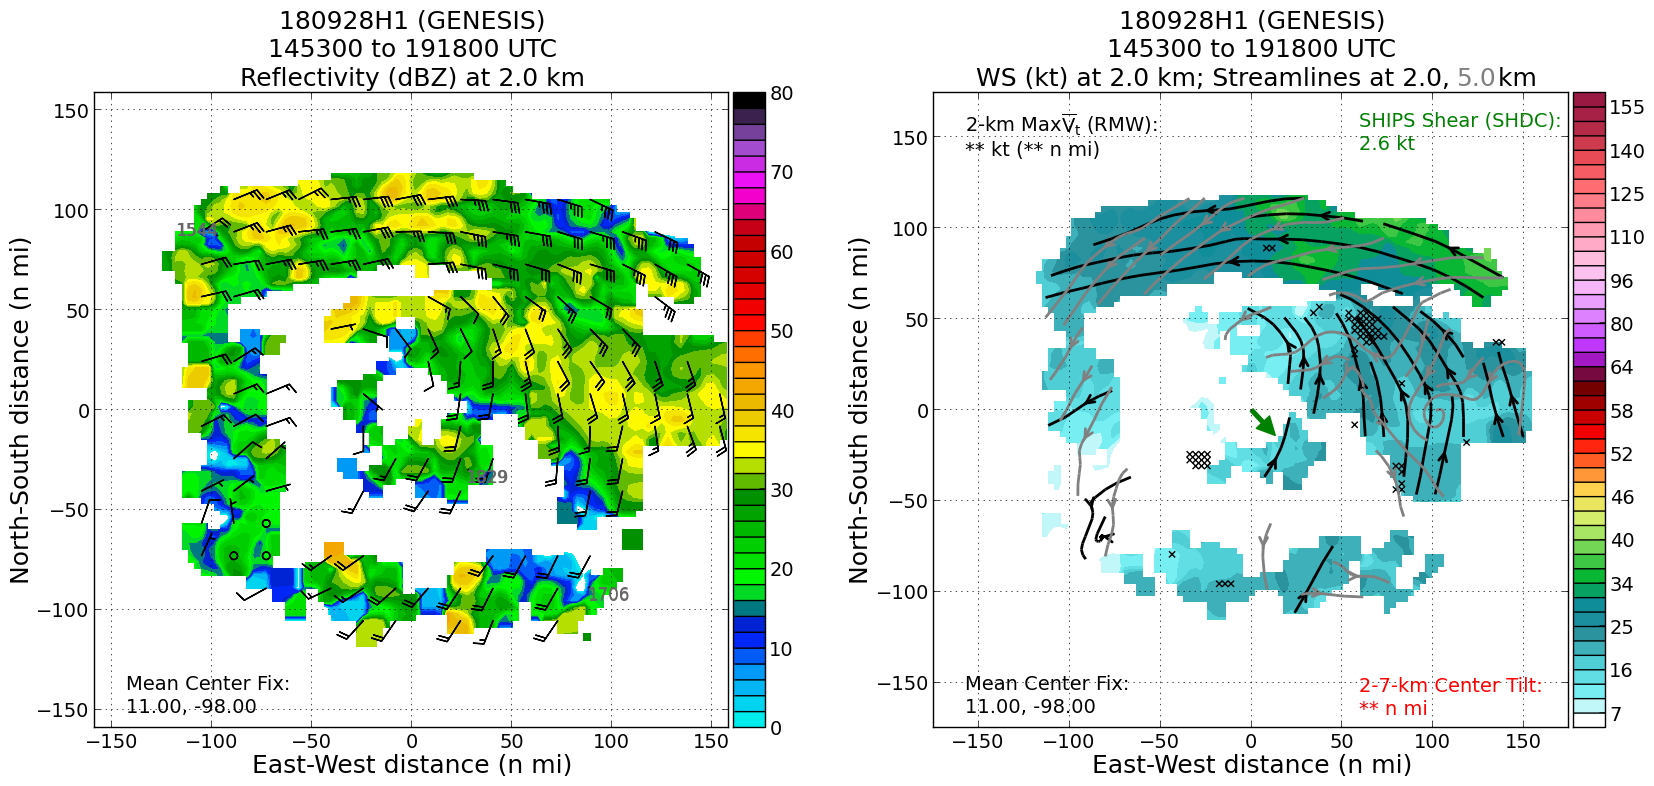
us to get TDR returns, helping to produce a better analysis (Fig. 7, Fig. 8).
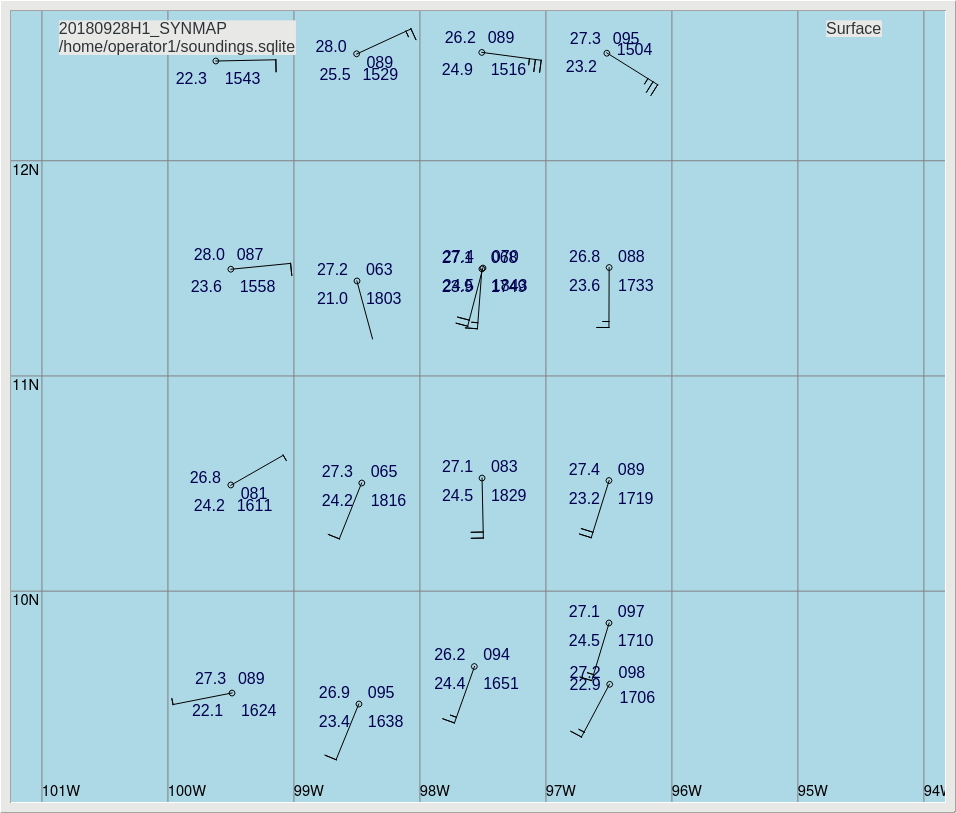
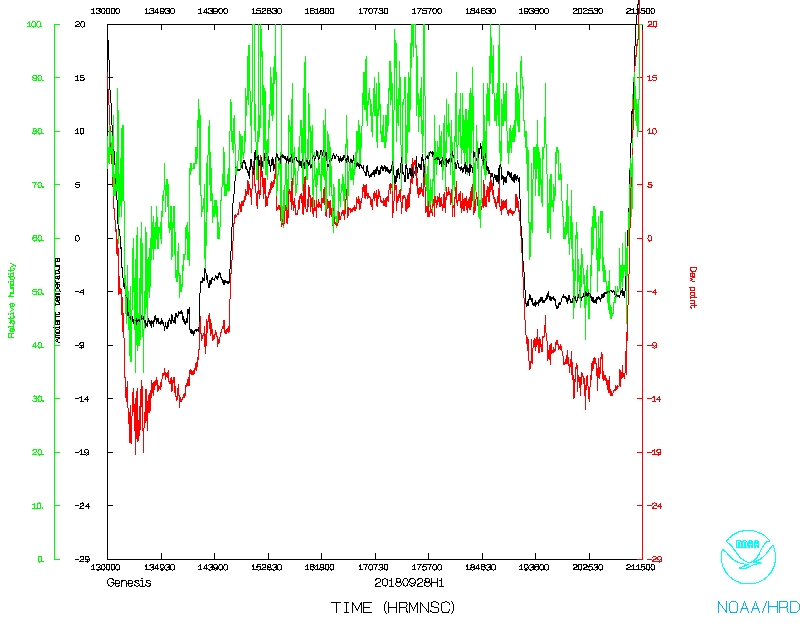
Sondes showed 30 kt easterly winds higher up towards flight level, with a bit
of weaker easterly winds towards the surface (Fig. 9). We arrived at WP #4 near
12.5°N/99.5°W, the northwest end point of the westbound leg at 1543 UTC
(Sonde #4; IR Sonde #1). This was an IR sonde drop and the release was delayed
a few minutes until we were able to see the ocean below. Once dropped we had
passed the original turnpoint, so we had to maneuver back to the original north
to south line.
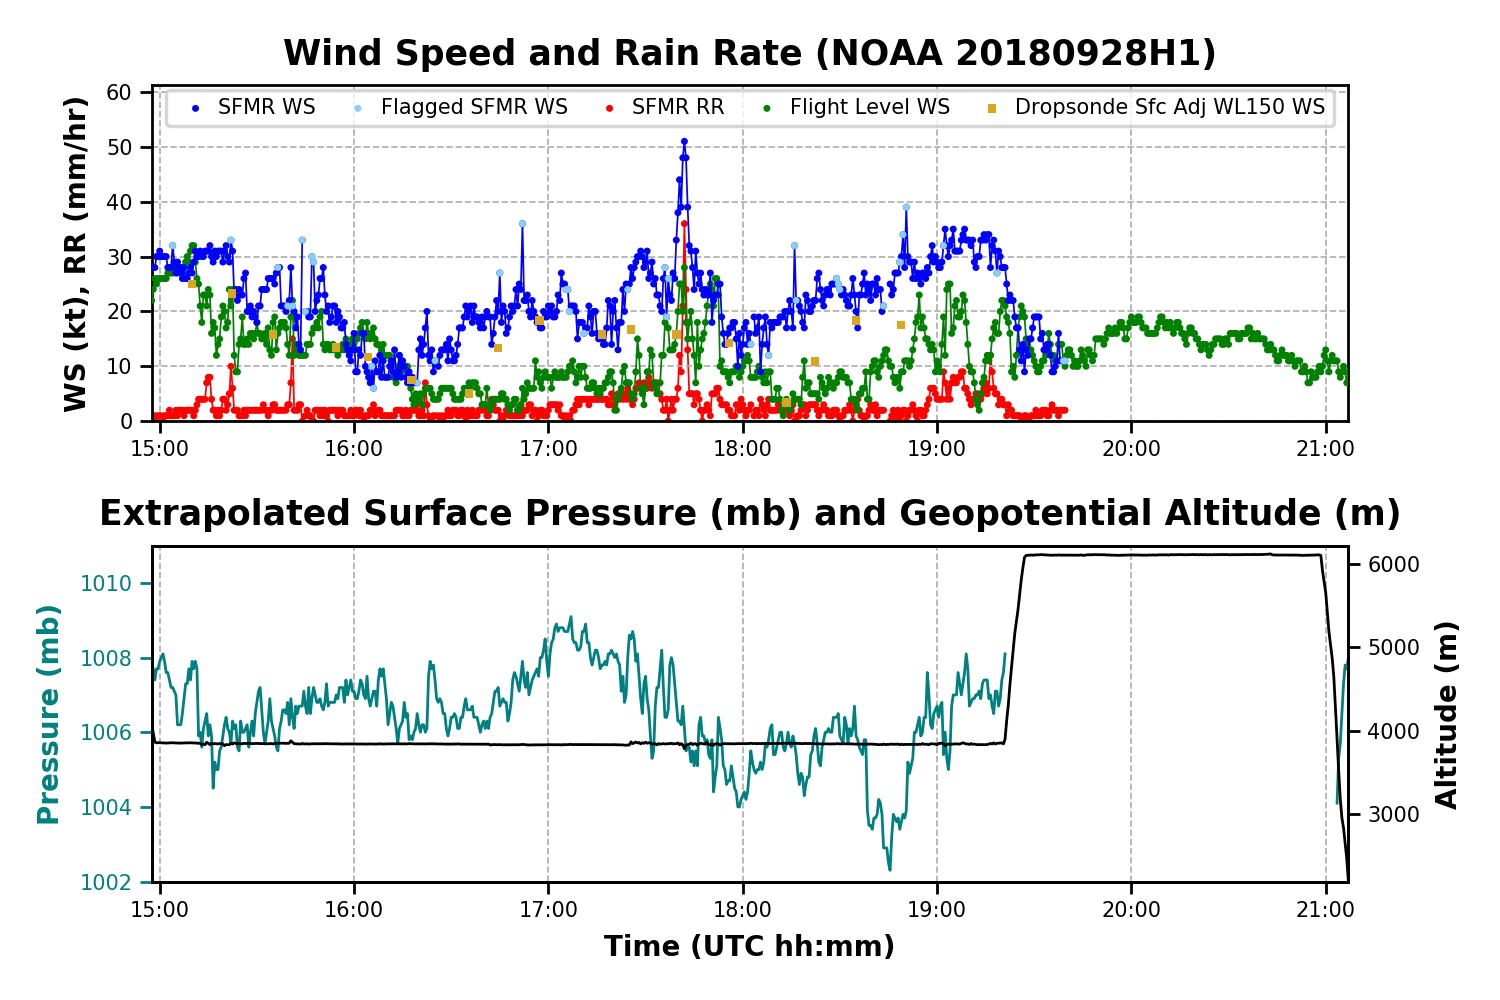
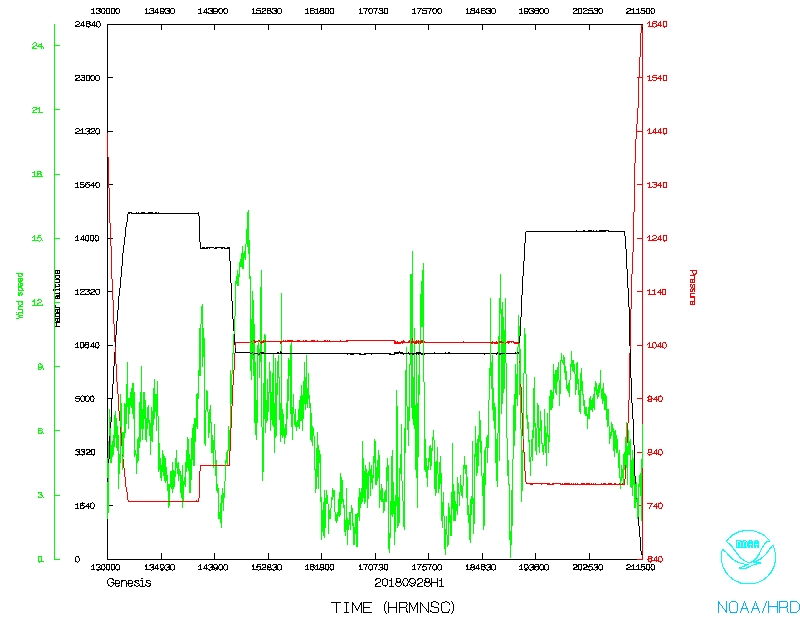
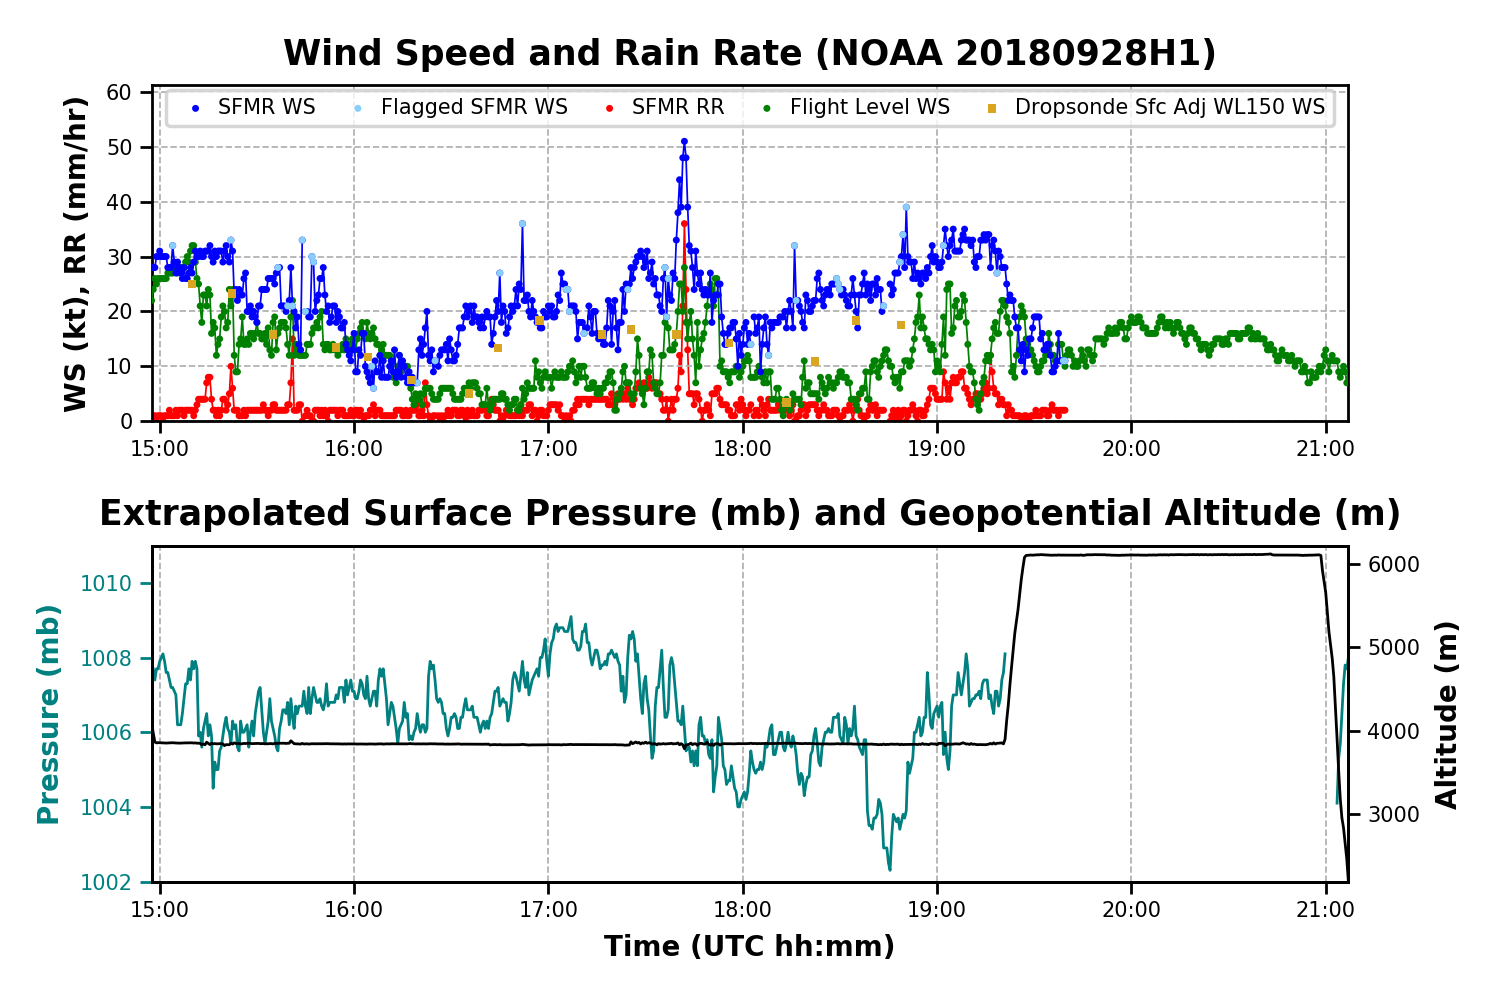
Figure 5. Time series of flight-level wind speed (green, kt), SFMR surface
wind speed (blue, kt), and SFMR rain rate (red, mm/hr) for mission 20180928H1,
as well as the extrapolated surface pressure (mb) (bottom, teal, mb) and
altitude of the aircraft (bottom, black, m).
|
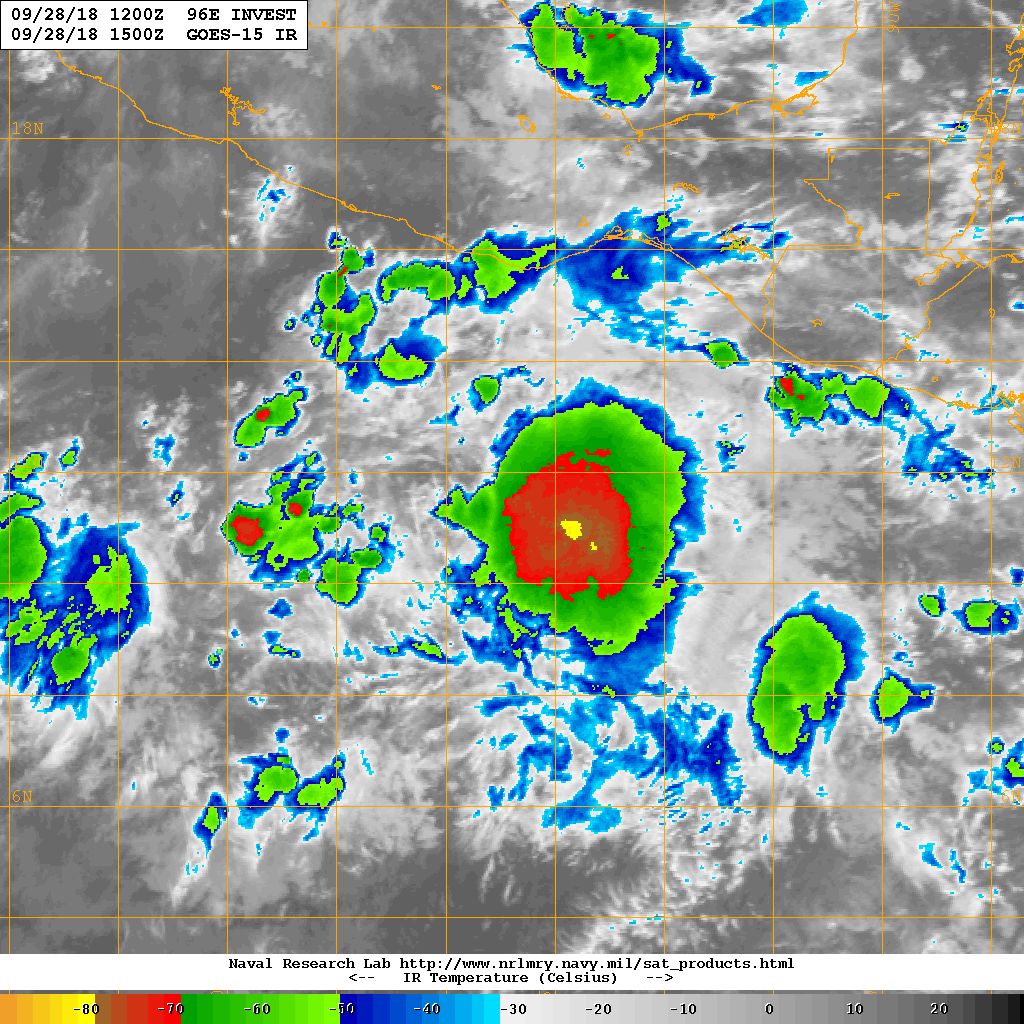
Figure 6. IR satellite image of Invest EP96 at 1500 UTC 28 September
|
On the southbound line along 99.5°W (between 12.5° and 9.5°N) on
the west side of the outer square, we dropped intermediate sondes at 1558 (WP
#5) and 1611 (WP #6) UTC. Along this line we observed shallow to moderately
deep congestus with some isolated deeper congestus (Fig. 6). Surprisingly the
sondes at WP #5 and WP #6 observed easterlies at the surface (Fig. 9) (expected
to see some westerly or northerly component if the square was centered on the
surface circulation), witch would not be consistent with having the low-level
circulation there. The sonde at the southwest point of the outer square (WP #7,
Sonde #7) did, however, have a weak (5 kt) westerly wind at the surface (Fig.
9). This suggests that we did pass through a possible surface circulation,
thought it was difficult to know whether it was associated with the coherent,
broad circulation we were expecting to see. We reached WP #7 at 1624 UTC (IR
Sonde #2) near 9.5°N/99.5°W. Sky conditions were mostly clear in this
region, with little in the way of congestus buildup. We also observed a wind
shift at flight level in this southwest side (Fig. 4), indicative of possibly
an elongated trough or circulation, or an MCV (though MCV not likely
considering the region has been mostly absent of precipitation).
The next leg was west to east along 9.5°N (between 99.5° and
96.5°W), bordering the southern side of the outer square. We dropped both
intermediate sondes at 1638 (WP #8) and 1651 (WP #9) UTC (Sondes #8 and #9).
Up to 15 kt southerly winds were observed in these sondes at the surface (Fig.
9) up to flight level (Figs. 7, 8), consistent with the cloud motion in
low-levels observed in the visible satellite. As we reached WP #10 near
9.5°N/96.5°W around 1706 UTC on the southeast side of the outer square,
we were approaching the large MCS. We were able to drop our third IR sonde
(Sonde #10; IR Sonde #3) in decent conditions below the aircraft (just
scattered clouds), and turned northbound for our last south to north leg
(between 9.5° and 11.5°N) to complete the outer square. The IR sonde
at WP #10 appeared to have a questionable fall rate, so we dropped a backup
sonde (regular RD94) at 1711 UTC (Sonde #11). Once we got more north, we
entered a stratiform rain region (Fig. 7). Given that a new convective line
had developed near the northeast point of our inner square (near 11.5°N /
97.5°) (Fig. 10), we opted to extend the northbound leg some in order to
deviate safely around that line to its north. We dropped both sondes on the
northbound leg at 1719 UTC (WP#11, Sonde #12) and 1733 UTC (WP #12, Sonde #13).
As expected, these sondes had mostly southerly winds over their depth to the
surface (Fig. 9). On this track we also observed another wind shift at flight
level; from westerly to easterly (Figs. 4, and 7, 8 right panels). This would
certainly suggest a midlevel circulation (MCV) within the stratiform rain
region we were flying through. The TDR analysis, in fact, shows a very
distinct, coherent MCV in the stratiform rain region to the east of the
aircraft position (Fig. 7)
We flew through the new convection forming near the northeast point of our
inner square near 11.5°/97.5°W (and on the western edge of the older
MCS), dropping a sonde at WP #13 at 1749 UTC (Sonde #13). We had decent
turbulence in the convective line, most notably one we got through the leading
edge (Fig. 10). We reached the northwest corner of the inner square (WP# 14)
near 11.5°N/98.5°W at 1803 UTC (Sonde #14; IR Sonde #4) and dropped an
IR sonde, given that it was clear below the aircraft. This sonde reported
1006.3 mb surface pressure, the lowest observed so far (Fig. 9). We turned
south and reached the southwest corner of the inner square (WP #15) at 1816
UTC (Sonde #16) near 10.5°N/98.5°W, where we saw the clearest
conditions of the whole pattern (Fig. 10). The southerly surface winds for the
two western sondes of the inner square (Fig. 9) would suggest that any existing
surface circulation would have moved west of our inner square at the time we
flew it. We then turned east and arrived at the southeast corner (WP# 16) at
1829 UTC (Sonde #17) near 10.5°N/97.5°W. We finally turned northward
and returned to the northeastern-most point of the inner square (WP #17) at
1843 UTC near 11.5°N/97.5°W. We decided to drop another sonde at this
location to get some time evolution from the one we dropped about an hour
earlier at 1748 UTC.
We exited the storm to the east, passing through the large stratiform rain
region associated with the convective system we observed throughout the time
on station (and that developed much before our arrival). The TDR analyses
showed a coherent midlevel circulation in this region earlier on our south to
north pass of the outer square (Figs. 7, 8), and this pass would allow us to
get some time evolution of that feature. The TDR analysis on the outbound leg,
did in fact shown the MCV again. Overall this MCS was very persistent, even
developing new convection on its western edge, that we passed through on the
eastern edge of inner square. As we left, convection continued to grow on the
eastern, northern, and western sides of the disturbance, with the southern side
having the least convective development. There were decent southerly and
easterly winds, and if the circulation can become more coherent (and maybe
aligned?) in the low and mid-levels, the storm could soon develop. It does,
however, appear to have to overcome some dry air within the broad surface
trough or circulation, which could be impacted by the apparent westerly shear.
Mission Evaluation / Problems :
Overall, this was a very interesting mission during the potential genesis of
EP96. Through the square spiral pattern we were able to observe what appeared
to be a surface circulation or trough axis west of the main convective area, on
the eastern side of the surface circulation or trough and edge of our pattern.
The surface wind shift occurred in the west and southwest portion of the outer
square (Fig. 9). When we returned to that region to fly the inner square, winds
were predominantly southerly, suggesting that the surface circulation or
trough had moved off to the west of our position (Fig. 9). We also observed a
couple of distinct wind shifts at flight level. One was located in that same
southwest portion of the outer square, while the other was observed on the
eastern edge of the pattern in the stratiform precipitation region (Fig. 4).
The TDR analyses (Figs. 7, 8), as well as flight level winds (Fig. 4),
indicated a coherent MCV in that MCS. The MCS remained rather persistent during
our time on station, with some new development on the west side of the MCS,
along the eastern portion of our pattern. On the transit home we went through
quite a bit of stratiform precipitation, and kept the TDR running to perhaps
observe some time evolution of the MCV. It seems likely that the MCV was very
coherent, and long lasting, considering it very clearly shows up in the
composite TDR analyses (Figs. 7, 8). The question is: could this be a focal
point for surface spinup within the apparently broad surface circulation or
trough?
Overall, it does appear that some westerly vertical wind shear could be
impacting the disturbance, keeping the greatest deep convection coverage
predominantly to the east of any surface circulation/trough. Throughout all
levels, though, there were likely multiple centers (particularly within the
midtroposphere), which makes this mission more difficult to analyze. We did
observe quite a bit of moderately deep and deep congestus development on the
north and west sides of the pattern, too, indicating that generally the
environment is fairly unstable in the low to middle troposphere, and favorable
for further convective development. That said, we observed some fairly
thermodynamically stable air within the square (perhaps near the center of the
surface circulation/trough axis) that was void of any convection of depth.
Perhaps some subsidence aloft, not observed by these shallower sondes, would
suggest that dry air and stability could be preventing additional convective
growth and coverage in that region.
The lowest MSLP we observed from a dropsonde was 1006.3 mb, with 40 kt easterly
winds on our inbound to the northeast point, and 20-30 kt southerlies feeding
into the MCS on the south and into the eastern portion of the pattern. NHC has
increased the probability of formation in 48 hours to 80%, and keeping the
probability 90% in 5 days. It may need to move away from that high shear
region and gradient, apparently present during today’s mission (Fig.
3) to get promote further development. If it does, we may see more coverage of
convection tomorrow and, possibly, the official genesis (at least TD) of EP96.
The only issue on the flight was that the wing pod, operational SFMR was not
working (issue that cropped in the first mission of the sequence). The LIPF
(2nd, research) SFMR in the belly was being used in its place. Otherwise the
pattern was flown with very little deviations. Generally when deviations did
occur they were done early to keep with smooth turns to help maintain the
quality of the TDR analyses.
Jon Zawislak
Oct. 4, 2018
Mission Data :
Flight Director's log |
Flight Director's manifest |
NetCDF data |
serial data
1 second data
LPS log |
Radar log |
Drop log
Page last updated March 15, 2019
Return to Mission page.