Mission Summary
20180926H1 Aircraft 42RF
Genesis (pre-Sergio)
Aircraft Crew (42RF)
| Aircraft Commander | Scott Price
|
| Co-pilot | John Rossi
|
| Co-pilot | Nate Kahn
|
| Flight Engineer | Mike Sanchez
|
| Navigator | Brian Richards
|
| Flight Director | Ian Sears
|
| System Engineer | Mike Mascaro
|
| Data Technician | Joe Greene
|
Science crew (42RF)
| LPS | Jon Zawislak | HRD
|
| Dropsonde | Jun Zhang | HRD
|
| Radar | Rob Rogers | HRD
|
| LPS | Paul Chang | NESDIS
|
| Observer | Joe Sapp | NESDIS
|
| Observer | Zorana Jelenak | NESDIS
|
Science crew (Ground)
| Radar | Paul Resor | HRD
|
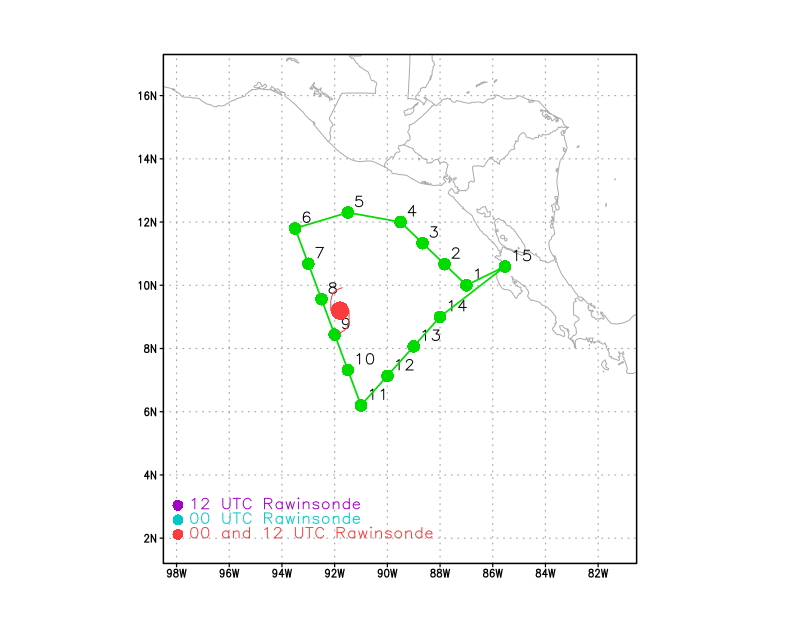
Mission Plan :
NOAA42 will conduct a research mission in the East Pacific for the HFP-IFEX
Genesis Stage Experiment. The initial plan (Fig. 1) calls for a survey pattern
immediately off the coast of Nicaragua and Costa Rica to sample; (1) the
structure of the potential Papagayo Gap flow (with the easternmost southeast
to northwest transect); and (2) the expected surface trough to the west of that
gap flow (with the westernmost northwest to southeast transect). Dropsondes
will be released at each of the points shown in Fig. 1. The pattern will be
flown at 14 kft pressure to accommodate the IWRAP data collection (required
to be below 15 kft). We will attempt to do TDR analyses, although there will
be limited coverage due to the pattern design, as well as the possibility of
having very little coverage of precipitation on station.
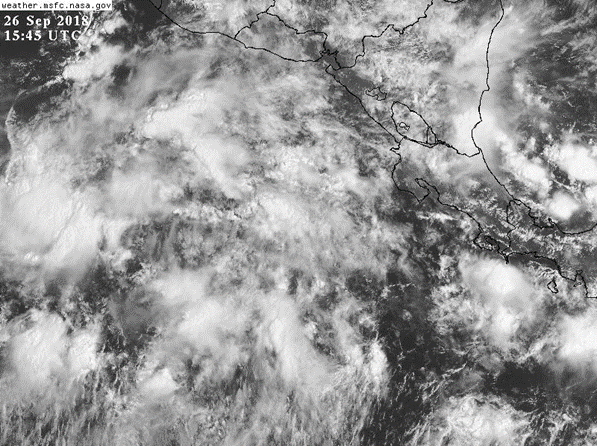
At the start of the mission, there is no invest designated in the region and
NHC did not indicate any potential for genesis in their Tropical Weather
Outlook, perhaps due to the fact that the dynamic models have backed off on
the degree of genesis, and that there is still little convective organization
(Fig. 2). It did appear that there is potentially a broad surface circulation
or trough, likely caused by the interaction of the easterlies to the north
(coming from the gap) and the monsoon westerlies to the south. We should sample
that with the planned pattern.
Mission Summary :
| Take off
| Landing
| Liberia, Costa Rica
| 15:57 UTC
| Liberia, Costa Rica
| 20:42 UTC
|
| Expendables
| 16 Dropsonde (11 HRD, 5 IR), 3
AXBT
| |
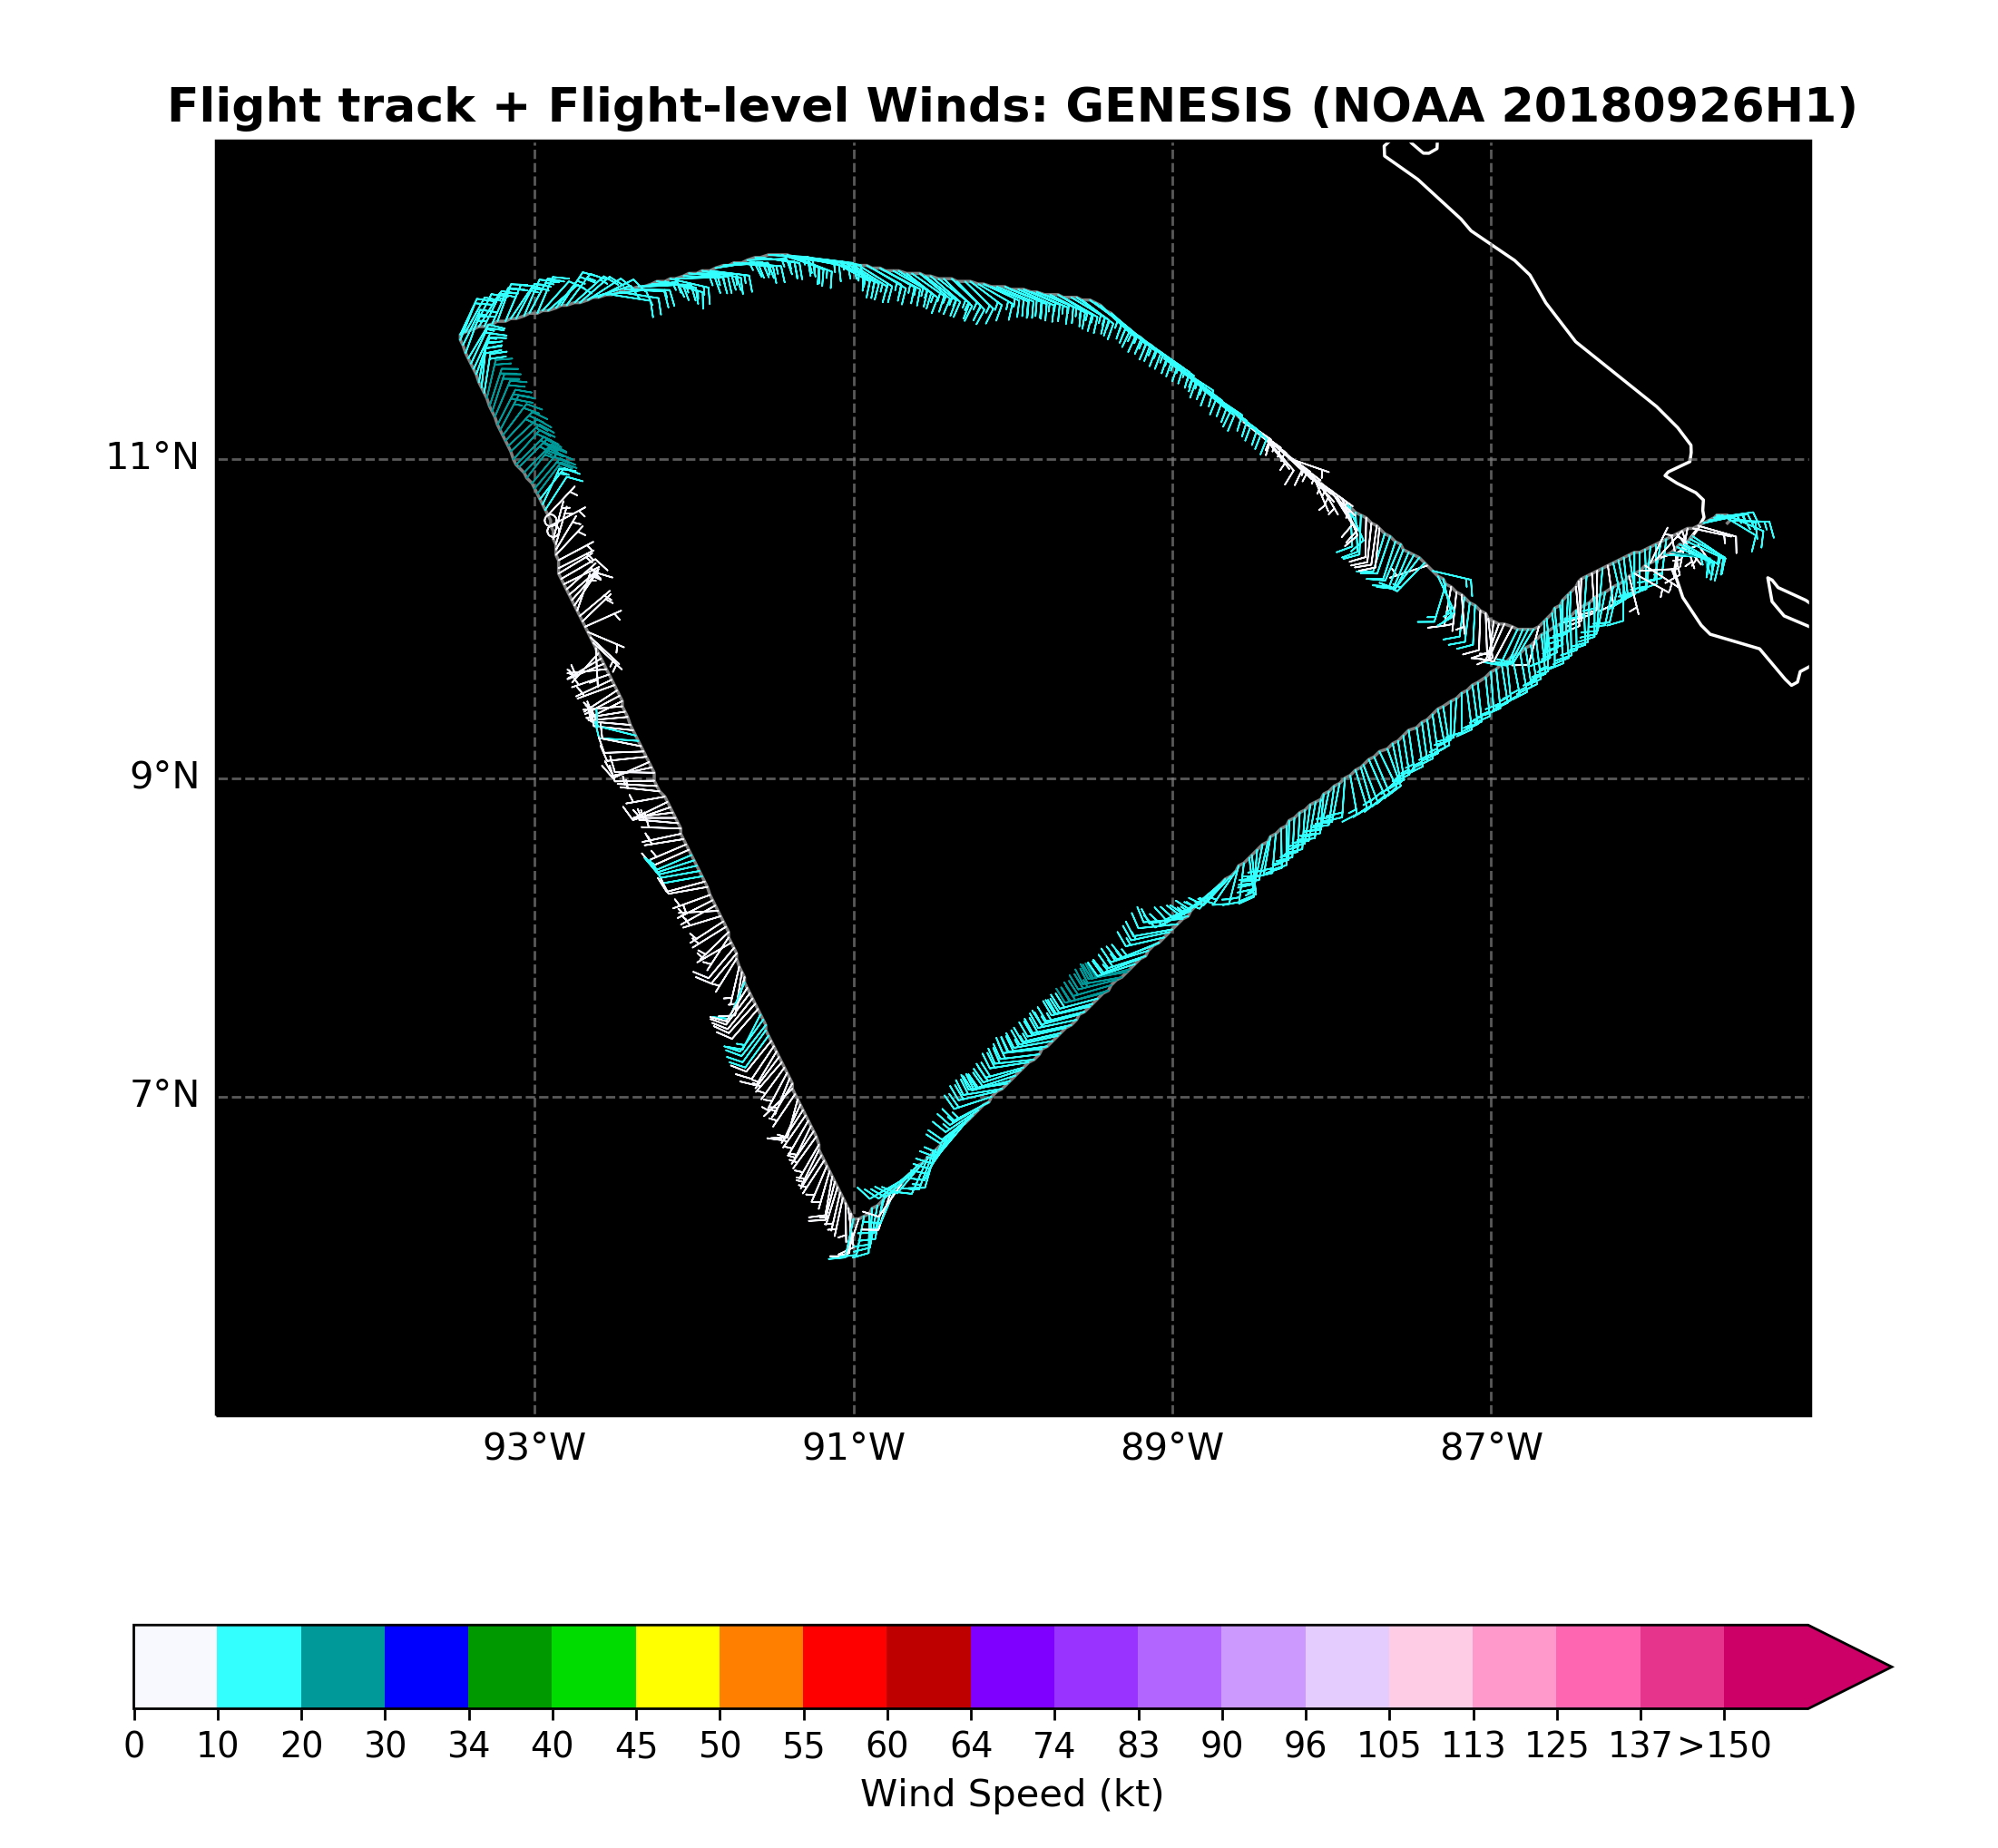
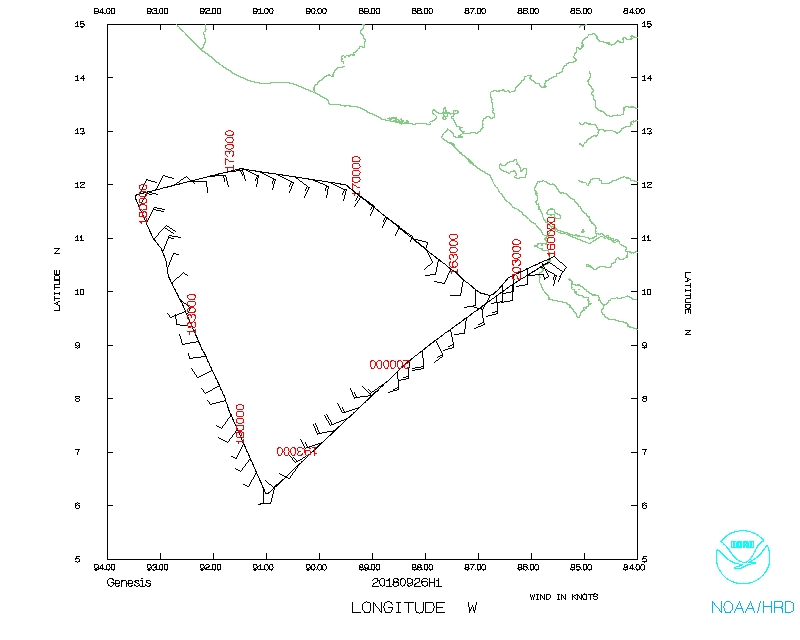
Figure 3. Actual flight track for mission 20180926H1. Flight-level winds
(barbs) and wind speeds (shaded, kt) indicated.
|
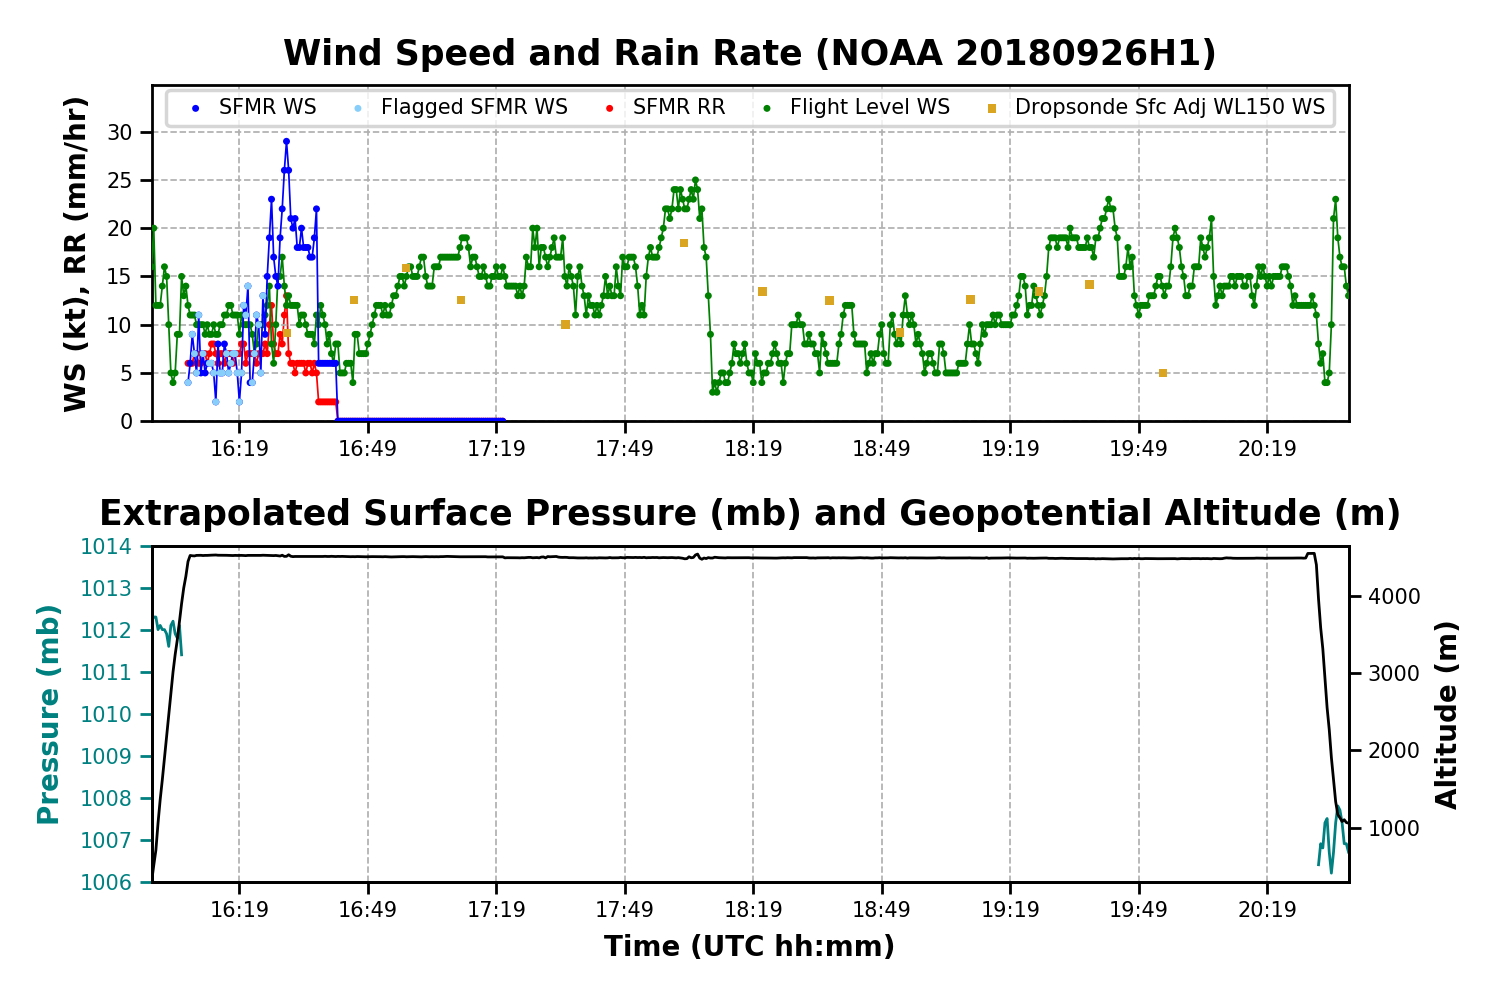
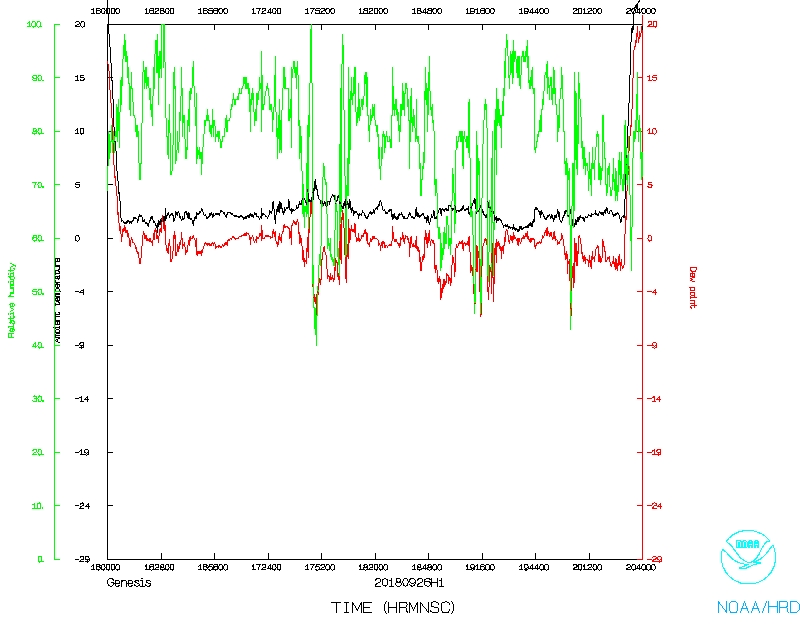
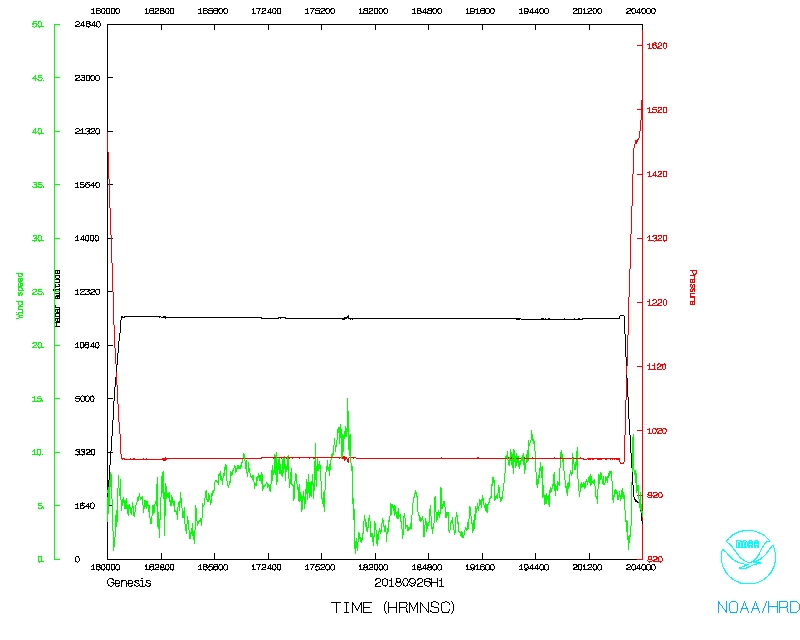
Figure 4. Time series of flight-level wind speed (green, kt), SFMR surface
wind speed (blue, kt), and SFMR rain rate (red, mm/hr) for mission 20180926H1,
as well as the extrapolated surface pressure (mb) (bottom, teal, mb) and
altitude of the aircraft (bottom, black, m).
|
RESEARCH MISSION PLAN: GENESIS
Prepared by the Hurricane Research Division
Sept. 25, 2018 5:55 PM EDT
Aircraft: N42RF
Proposed takeoff: 26/1500Z
|
|
DROP LOCATION TABLE
|
| #
| LAT
| LON
| Time
|
|
| deg min
| deg min
| hr:min
|
| 1 | 10 00 | 87 00 | 0:19
|
| 2I | 10 46 | 87 40 | 0:32
|
| 3I | 11 32 | 88 20 | 0:46
|
| 4 | 12 18 | 89 00 | 1:00
|
| 5 | 12 06 | 91 12 | 1:30
|
| 6 | 11 48 | 93 30 | 2:02
|
| 7I | 10 41 | 93 00 | 2:18
|
| 8I | 9 34 | 92 30 | 2:34
|
| 9I | 8 26 | 92 00 | 2:51
|
| 10I | 7 19 | 91 30 | 3:07
|
| 11 | 6 12 | 91 00 | 3:24
|
| 12I | 7 08 | 90 00 | 3:42
|
| 13I | 8 04 | 89 00 | 4:01
|
| 14 | 9 00 | 88 00 | 4:20
|
The actual track of the mission is shown in Fig. 3, with wind information at
flight level (FL), extrapolated sea level pressure (SLP), and SFMR surface
wind speed and rain rate shown in Fig. 4. The transit to the IP was about 30
min. We reached WP #1 (IP) at 1623 UTC and began the four sonde transect of the
Papagayo Gap flow region off the coast of Nicaragua. The sonde at WP #2 was a
fast fall, so it was backed up with another sonde. The first sonde at WP #2 and
the one at WP #4 were released in combo with an AXBT (AXBT Combos #1, #2).
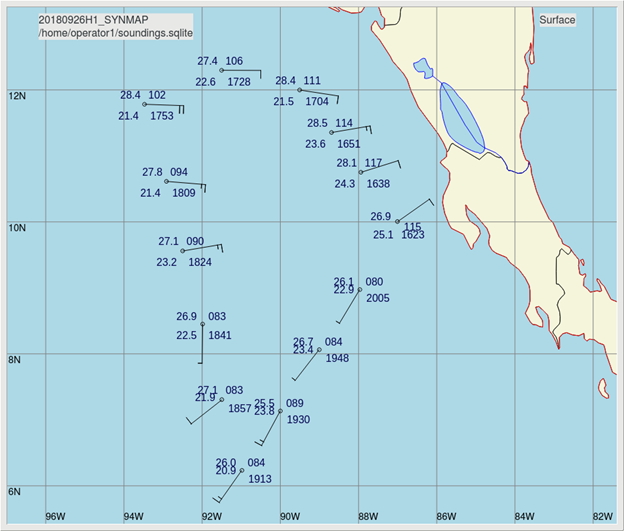
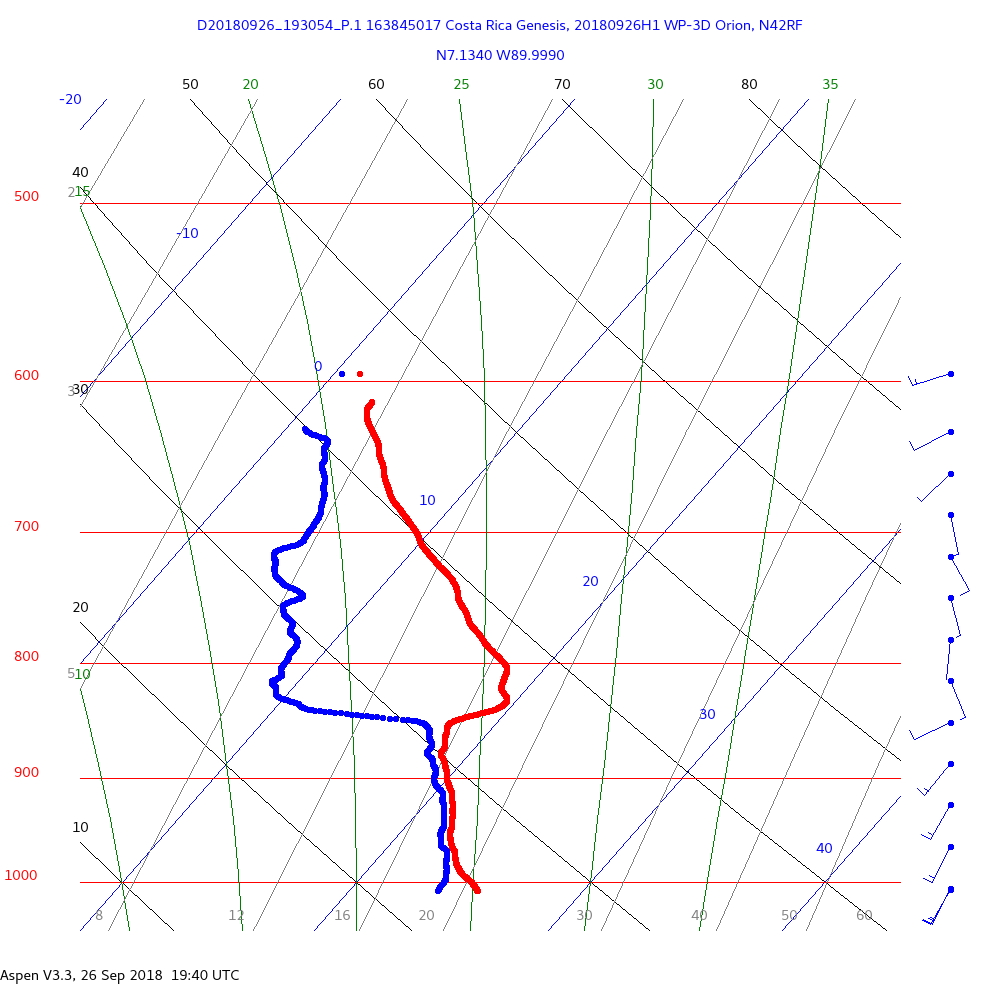
Although the winds closer to flight level were southeasterly (not consistent
with any gap flow) (Fig. 3), the dropsondes along this leg did indicate
easterly winds of about 30 kt below 1.5 km, including 10-15 kt
east-northeasterly winds at the surface (Fig. 5). This, instead, could be an
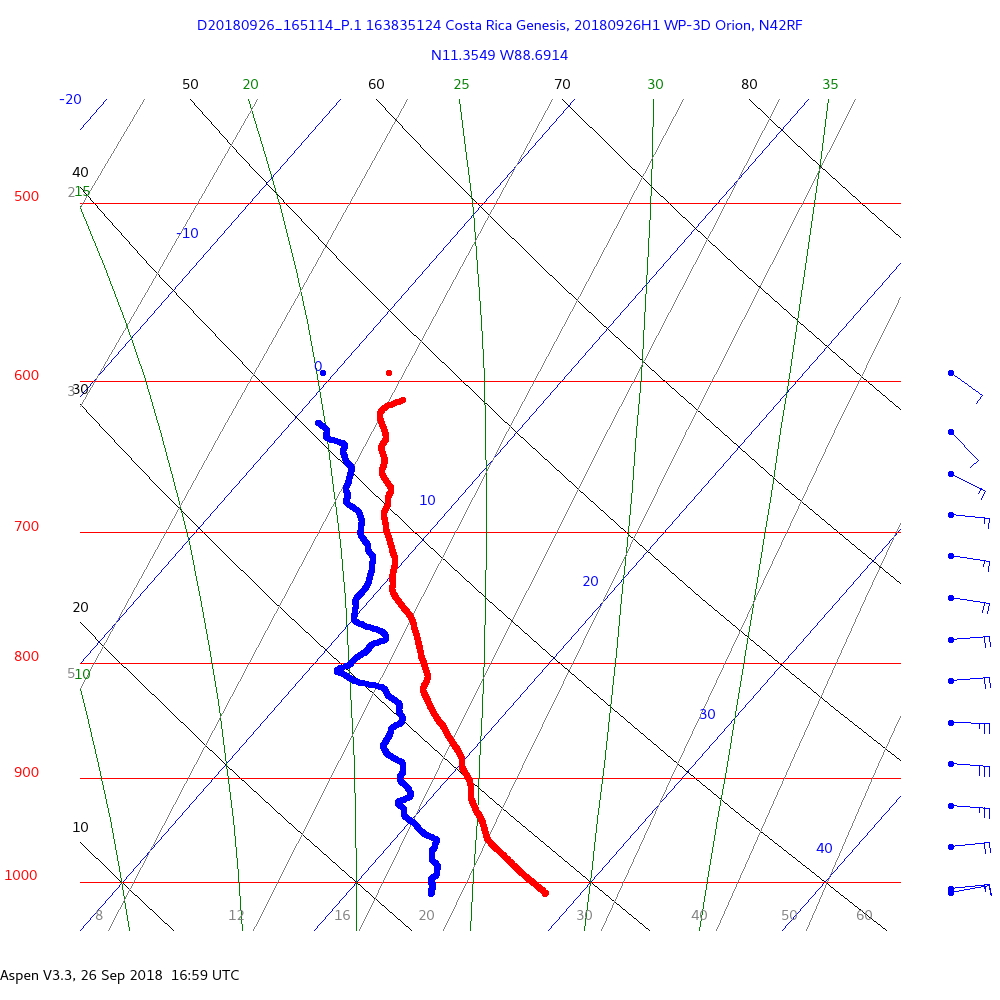
indication of the gap flow in that layer. An example sounding from this leg is
shown in Fig. 6 (sonde at WP #3). This sonde indicates that easterlies exist
below about 700 mb, with the wind speed peaking around 850-900 mb.
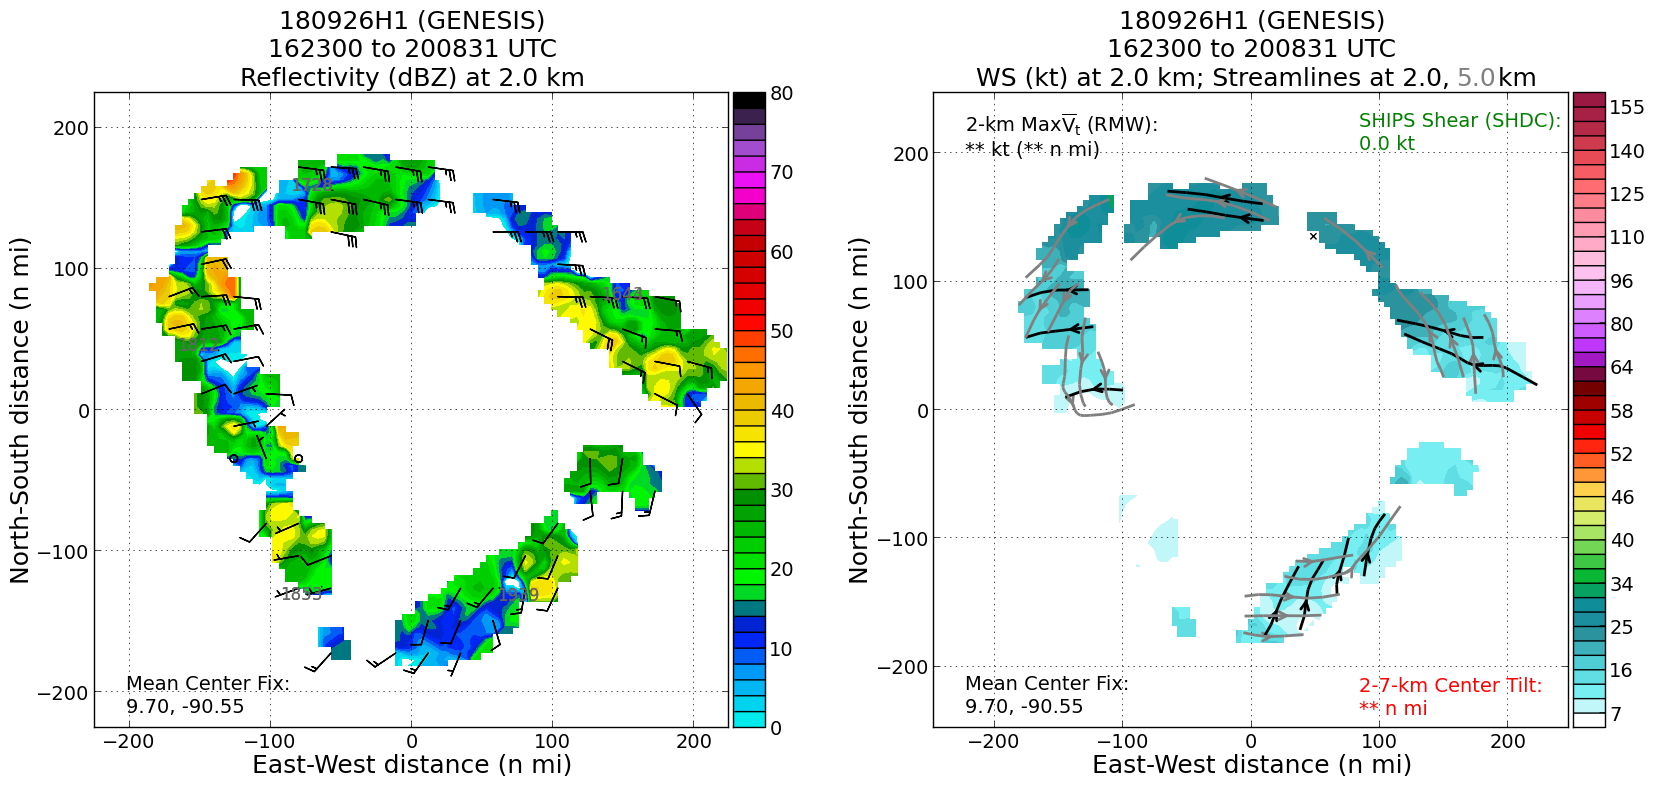
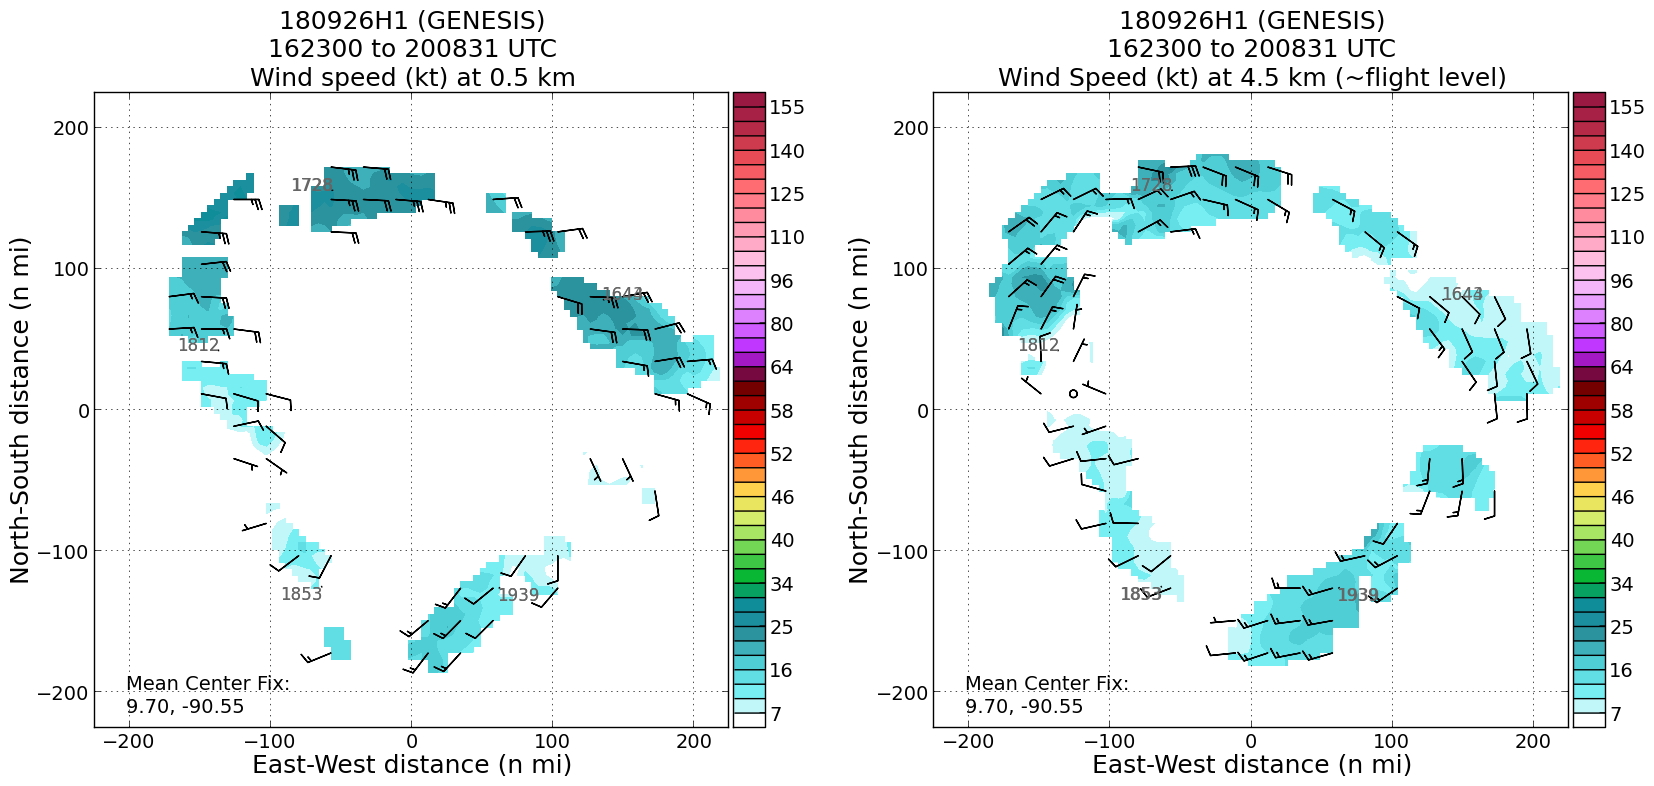
We arrived at the surface wave trough sonde transect (WP #6 - #11) at 1753 UTC.
Up until this time there was little convection of any great depth anywhere in
the pattern, but enough so to get returns from the TDR to produce an analysis
around the survey (Figs. 7 and 8). We ended up crossing a feature at flight
level around 10°N, given the wind shift from northeasterly to southwesterly
(Fig. 3). We then subsequently observed another wind shift near the surface a
bit farther south (Figs. 5, 7 left panel). This could be the indication of an
elongated surface trough. IR sondes were released at WPs #6, #7, #8, #9, and
#10, with WP #9 being an AXBT combo drop (AXBT Combo #3). Southeasterlies were
mostly observed in the low-levels on the return leg from WP #11, and these
sondes were also the driest over the entire sonde of any dropped in the pattern
(example in Fig. 9 at WP #12). This sonde in particular was indicative of
strong subsidence in the midtroposphere, with an inversion near 850 mb (Fig. 9).
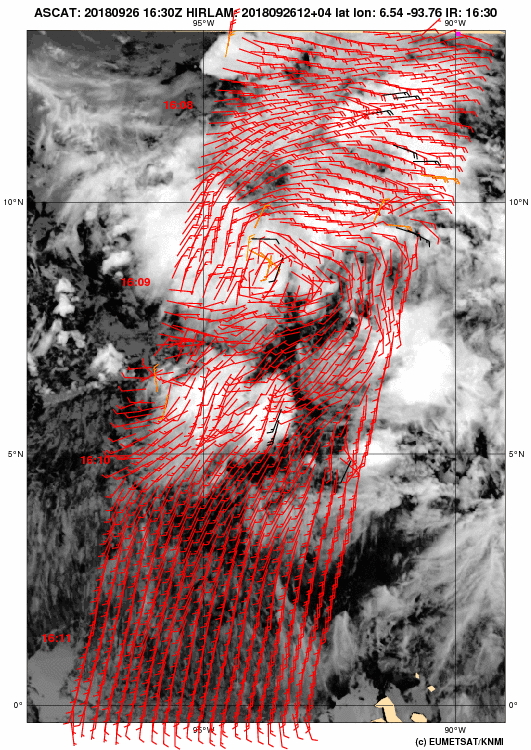
Overall, a broad circulation was observed near flight level and the
midtroposphere (~5 km), as indicated by the TDR analyses (Figs. 7 and 8, right
panels). Near the surface, the aircraft observations suggest a, more or less,
east-west elongated trough axis along 9°N; which confirms what was seen in the
visible satellite loops, as well as an ASCAT [scatterometer] pass (Fig. 10).
Mission Evaluation / Problems :
Overall the mission was successful in sampling the structure across the
Papagayo Gap flow, which could be involved in the increase of vorticity /
circulation in the potentially developing invest, as well sampling a broad
circulation in the midlevels and at the surface (characteristically more of an
elongated trough). There does appear to be drier air within the region,
particularly to the south) which could have been inhibiting the development of
organized convection, as well as limiting the depth of any convection that does
develop. NHC during the mission did indicate in their Tropical Weather Outlook
at 0/40% chance of development.
As for issues, the primary one that arose was that the operational, wing pod
SFMR stopped working. It was deemed that it would not be operational for the r
emainder of the flight sequence. The 2nd downlooking SFMR in the belly was used
in place of the readout from the operational SFMR. There were also 2 fast fall
dropsondes, each backed up with another sonde.
Jon Zawislak
Oct. 4,2018
Mission Data :
Flight Director's log |
Flight Director's manifest |
NetCDF data |
serial data |
1 second data
LPS log |
Radar log |
Drop log
Page last updated March 15, 2019
Return to Mission page.