| Aircraft Commander | Mark Nelson |
| Co-pilot | Mark Sweeney |
| Co-pilot | Cathy Martin |
| Navigator | Tim Gallagher |
| Flight Engineer | Paul Darby |
| Flight Engineer | Ken Heystek |
| Flight Director | Barry Damiano |
| Radar Technician | Joe Greene |
| Data Technician | Bobby Peek |
| Data Technician | Dana Nehar |
| Data Technician | Jeff Newnam |
| LPS | Rob Rogers (HRD) |
| Radar | Jun Zhang (HRD) |
| Dropsonde/AXBT | Eric Uhlhorn (HRD) |
| Observer | Zorana Jelenak (NESDIS) |
| IWRAP | Joe Sapp (UMass-Amherst) |
| IWRAP | Tom Hartley (UMass-Amherst) |
Mission Plan :
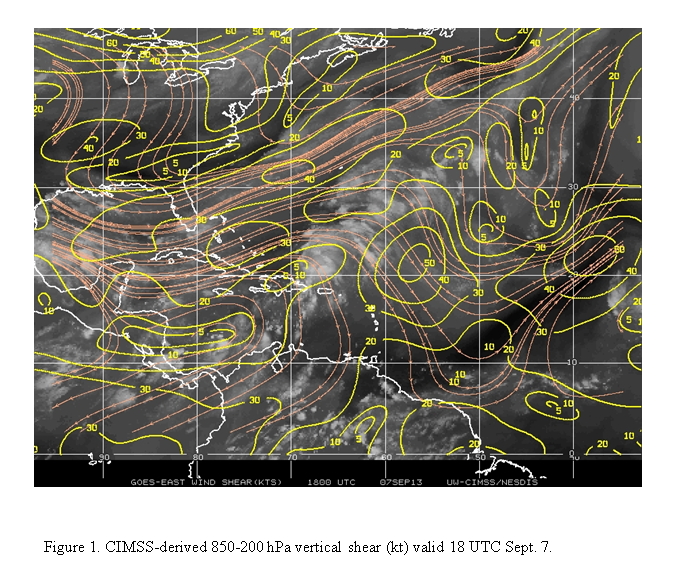
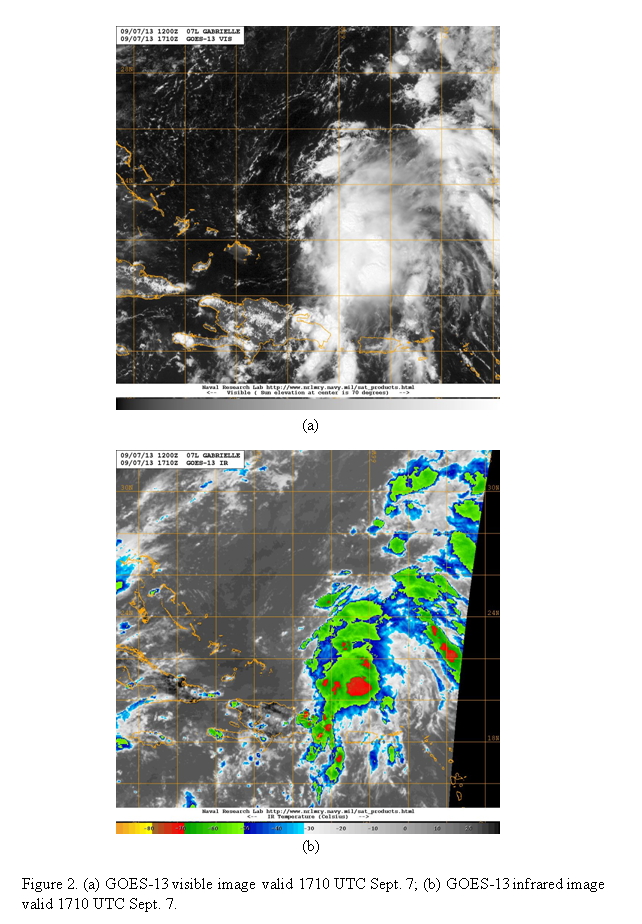
The remnants of Gabrielle were situated in an area of hostile westerly 850-200 hPa vertical shear of about 25 kt (Fig. 1). Satellite imagery showed that there were areas of deep convection, with cloud top temperatures as low as -70 °C (Fig. 2), but they were displaced significantly to the east and southeast of the low-level center.
The P-3 will leave St. Croix, USVI at 1400 UTC on Sept. 7th and will recover at St. Croix by 2300 UTC on the same day.
Mission Summary :
| Take off | Landing
| St. Croix, USVI | 14:55 UTC
| St. Croix, USVI | 22:33 UTC
| | ||
|
|
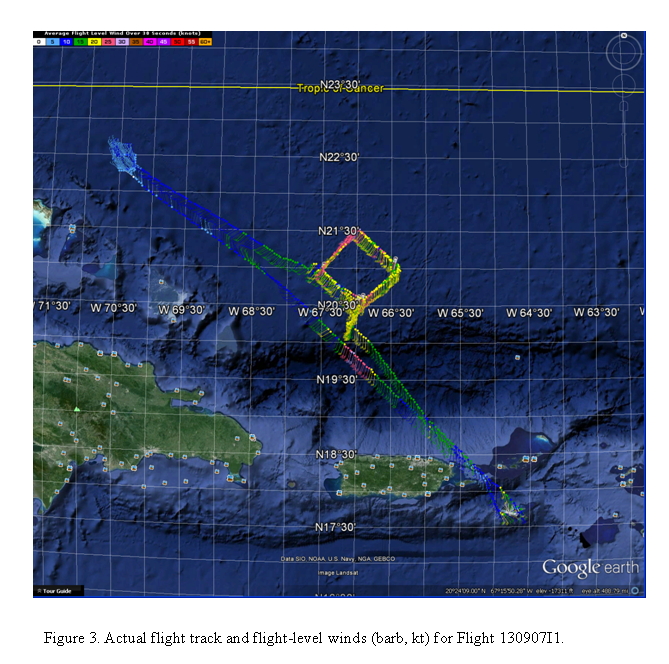
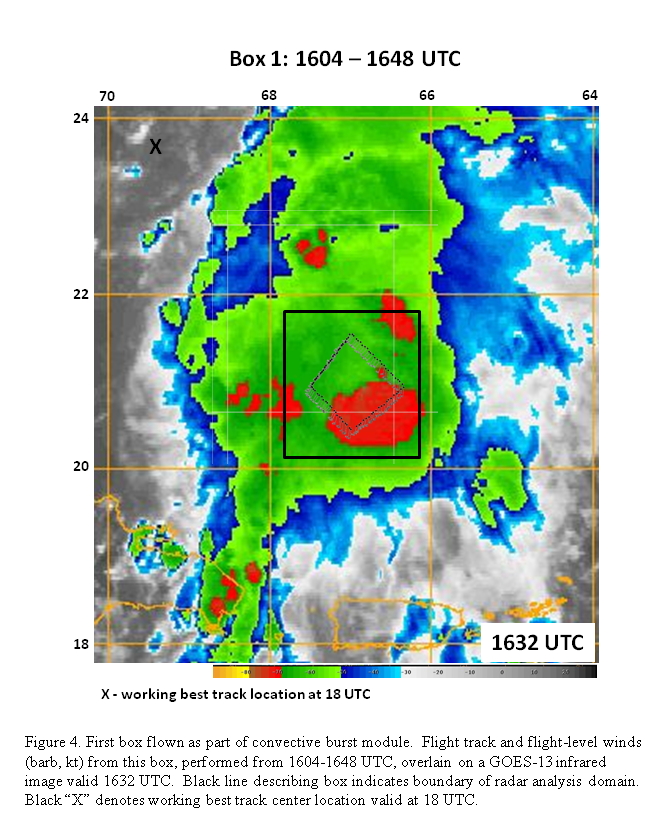
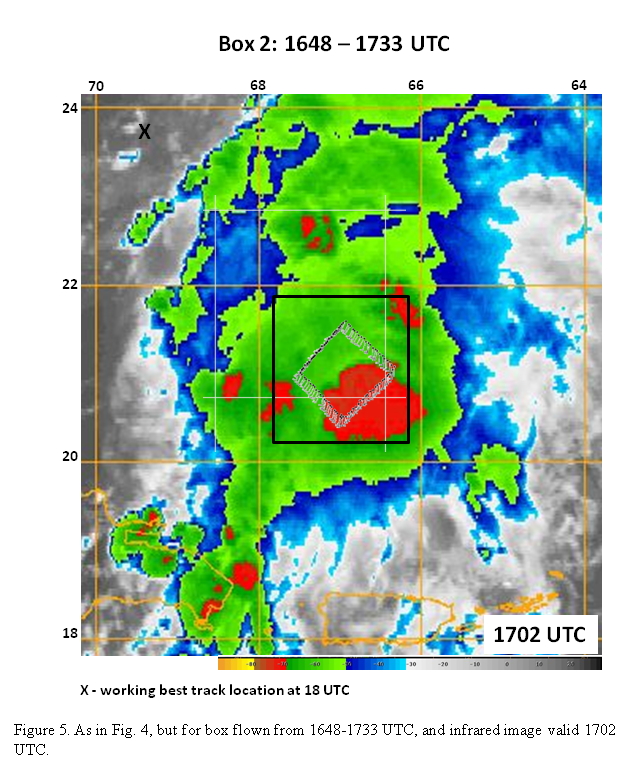
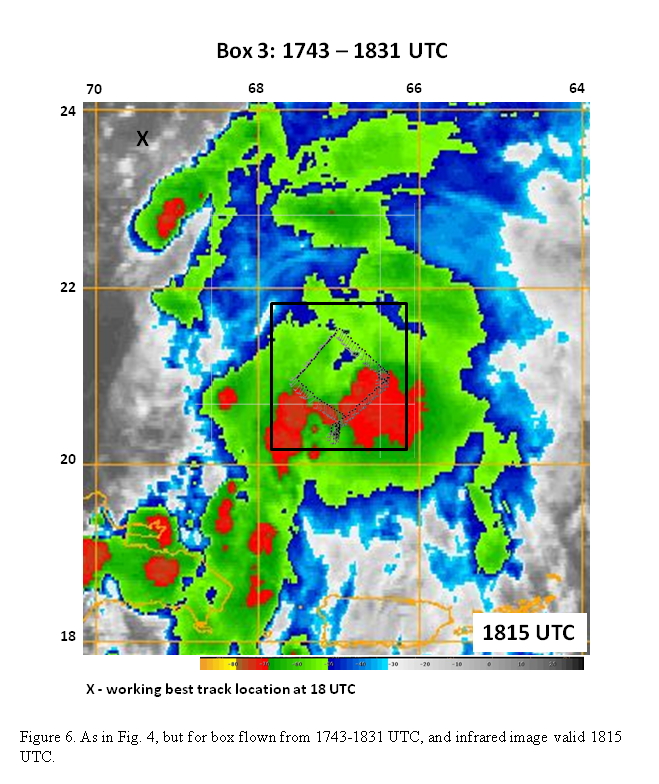
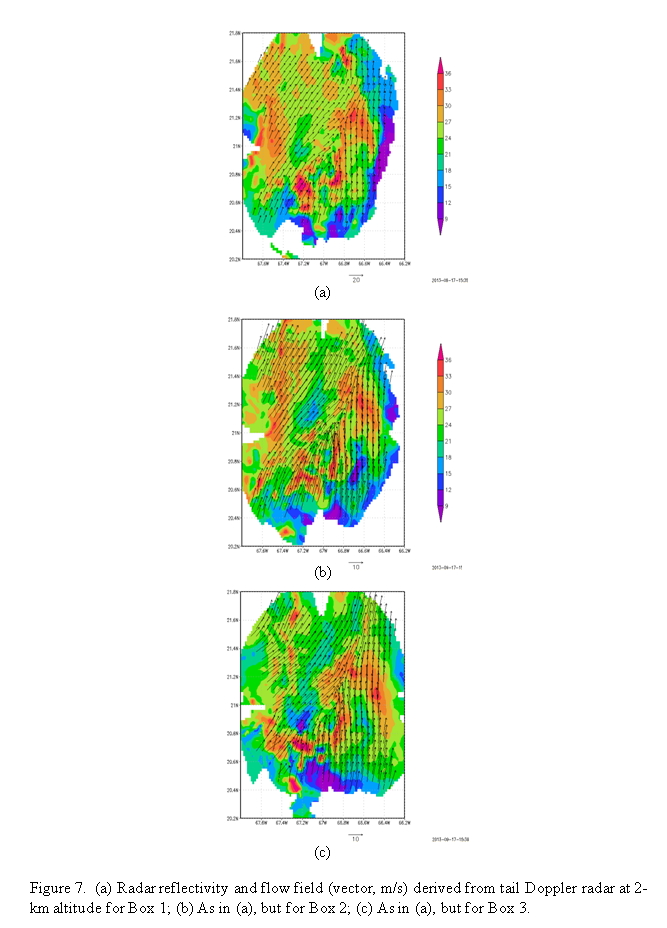
The pattern was flown generally as planned (Fig. 3). Take-off was at 1456 UTC. We flew an area of deep convection southeast of the low-level center for the convective burst module (Figs. 4-6). The box pattern worked well, as we sampled the only real cold cloud shield at the time time. The cold cloud shield may have been near a midlevel center as well. The system that was flown had an area of deep convection with echo tops as high as 18 km, occasional lightning, and a fairly extensive stratiform shield. Analysis of the reflectivity and flow field at 2-km altitude (Fig. 7) showed two main lines of precipitation oriented in a southwest-northeast axis. A core of heavy precipitation is seen at the southern end of the eastern line of precipitation. This eastern line is also associated with a confluence line in the lower troposphere. Moderate reflectivity values (20-25 dBZ) are more widespread throughout the radar analysis domain during the first box, whereas by the time of the third box the coverage of moderate reflectivity had decreased, suggesting the coverage of stratiform precipitation was reduced.
| 
| 
|
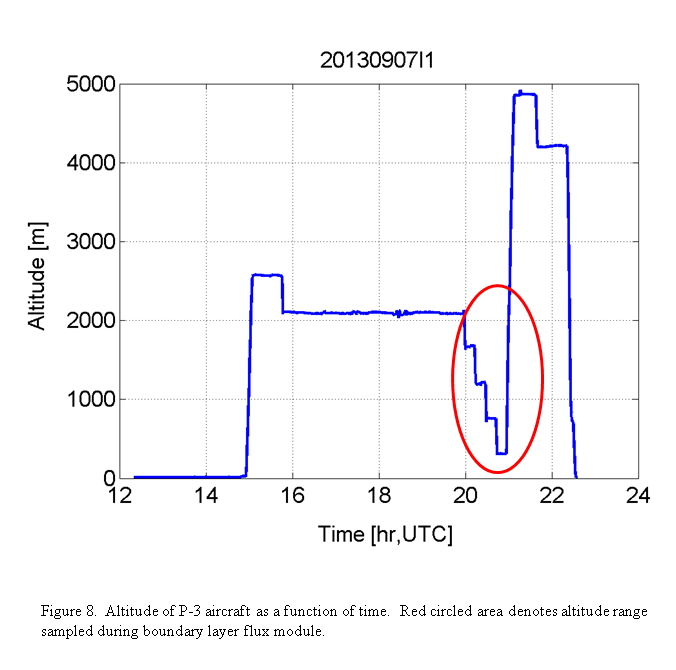
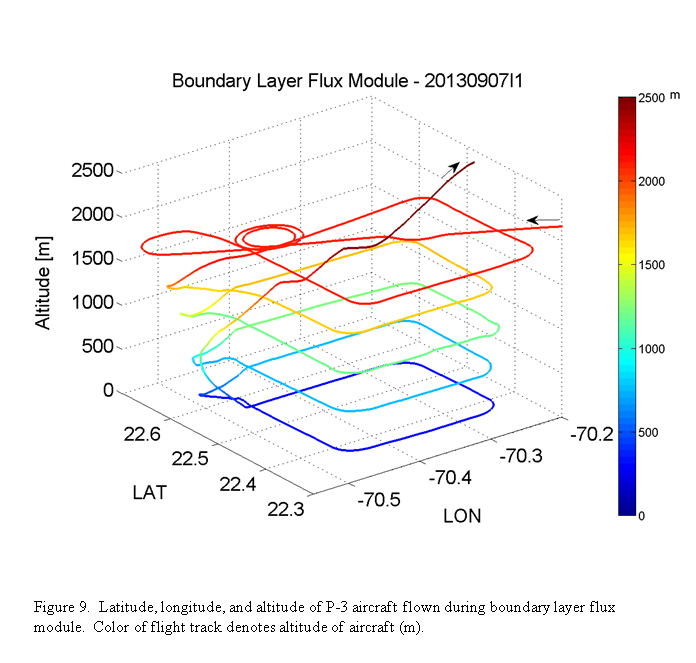
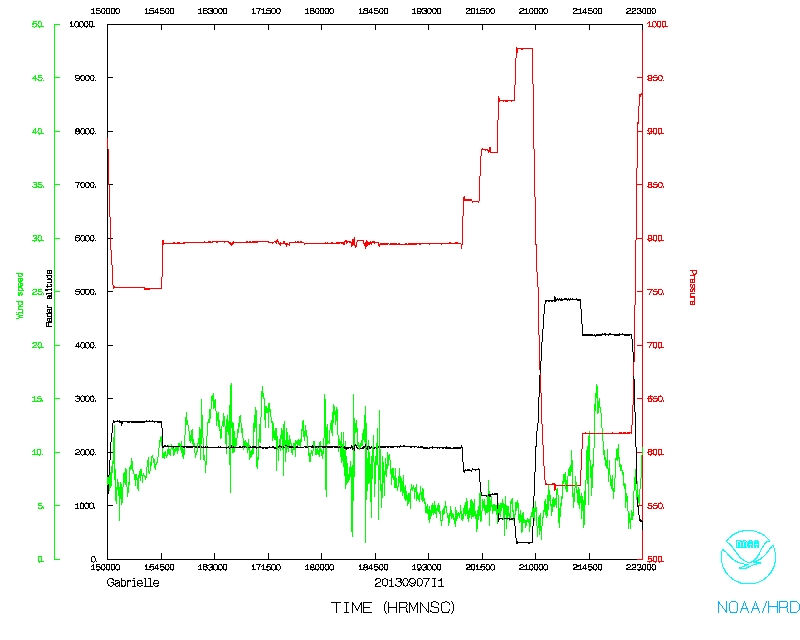
After completion of the convective burst module the aircraft targeted a region to the northwest of the low-level center, in clear air, to perform a box stepped-descent across the presumed top of the boundary layer. Figure 8 shows the altitude of the aircraft as a function of time, indicating that the aircraft successfully flew a set of legs at successively lower altitudes, with the lowest altitude at ~ 300 m (1000 ft). A three-dimensional rendering of this pattern (Fig. 9) shows the box pattern flown, providing measurements both along and across the prevailing wind direction.
The aircraft completed its mission and landed at St. Croix at 2233 UTC.
| 
|
|
Mission Evaluation:
Overall the mission did meet its objectives. We got a good sample of a convective system in three successive box patterns, with good coverage by the radar. The PBL profile was less successful, only because the winds were so weak. To get us to strong enough flow in clear air would have taken too long for the fuel remaining. The system was still in an unfavorable environment for strengthening, with strong shear, very dry air in the mid-upper levels, and an exposed low-level circulation. There was deep convection, though that was displaced to the east and southeast. The burst module flown here likely sampled convection that was downshear of a midlevel circulation.
Problems :
There were no major problems except for some failures in the sondes (3-4 sondes). A total of 23 GPS sondes and 8 AXBT's were dropped.
Rob Rogers
Sept. 19, 2013
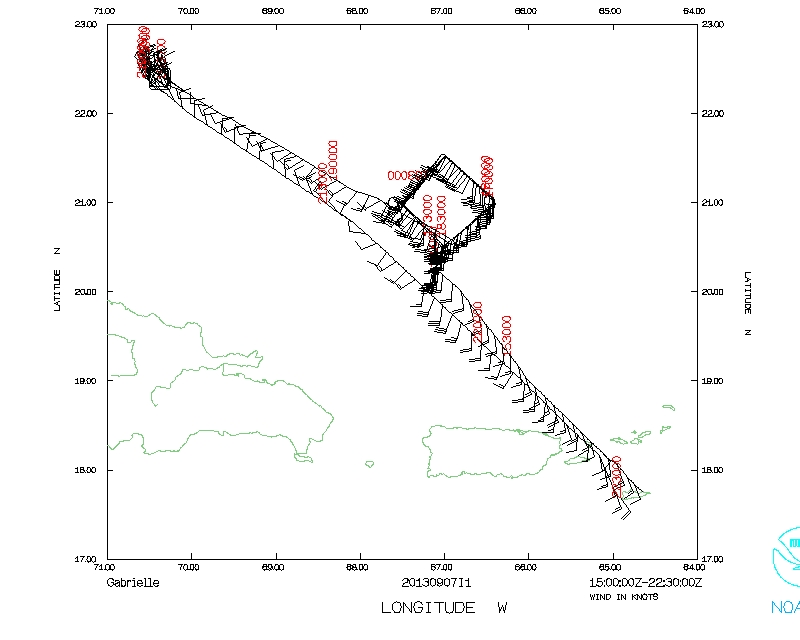 Flight track |
 Temperature and Moisture |
 Wind and Atlitude |