|
|
| Aircraft Commander | Justin Kibby |
| Co-pilot | Nate Kahn |
| Co-pilot | John Rossi |
| Flight Engineer | Ken Darby |
| Flight Engineer | Josh Sanchez |
| Navigator | Pete Freeman |
| Flight Director | Mike Holmes |
| System Engineer | Steven Paul |
| Data Technician | Dana Naeher |
| Dropsonde Operator | Todd Richards |
| LPS | Rob Rogers | HRD |
| Dropsonde | Lisa Bucci | HRD |
| Radar | Gus Alaka | HRD |
| Ocean Winds | Joe Sapp | UMass |
| Ocean Winds | Mark Romer | NESDIS |
| Guest | Patrick Wooten | Lakeland SWAT |
| Guest | Eric Harper | Lakeland SWAT |
| Radar | John Gamache | HRD |
|
|
|
Mission Plan :
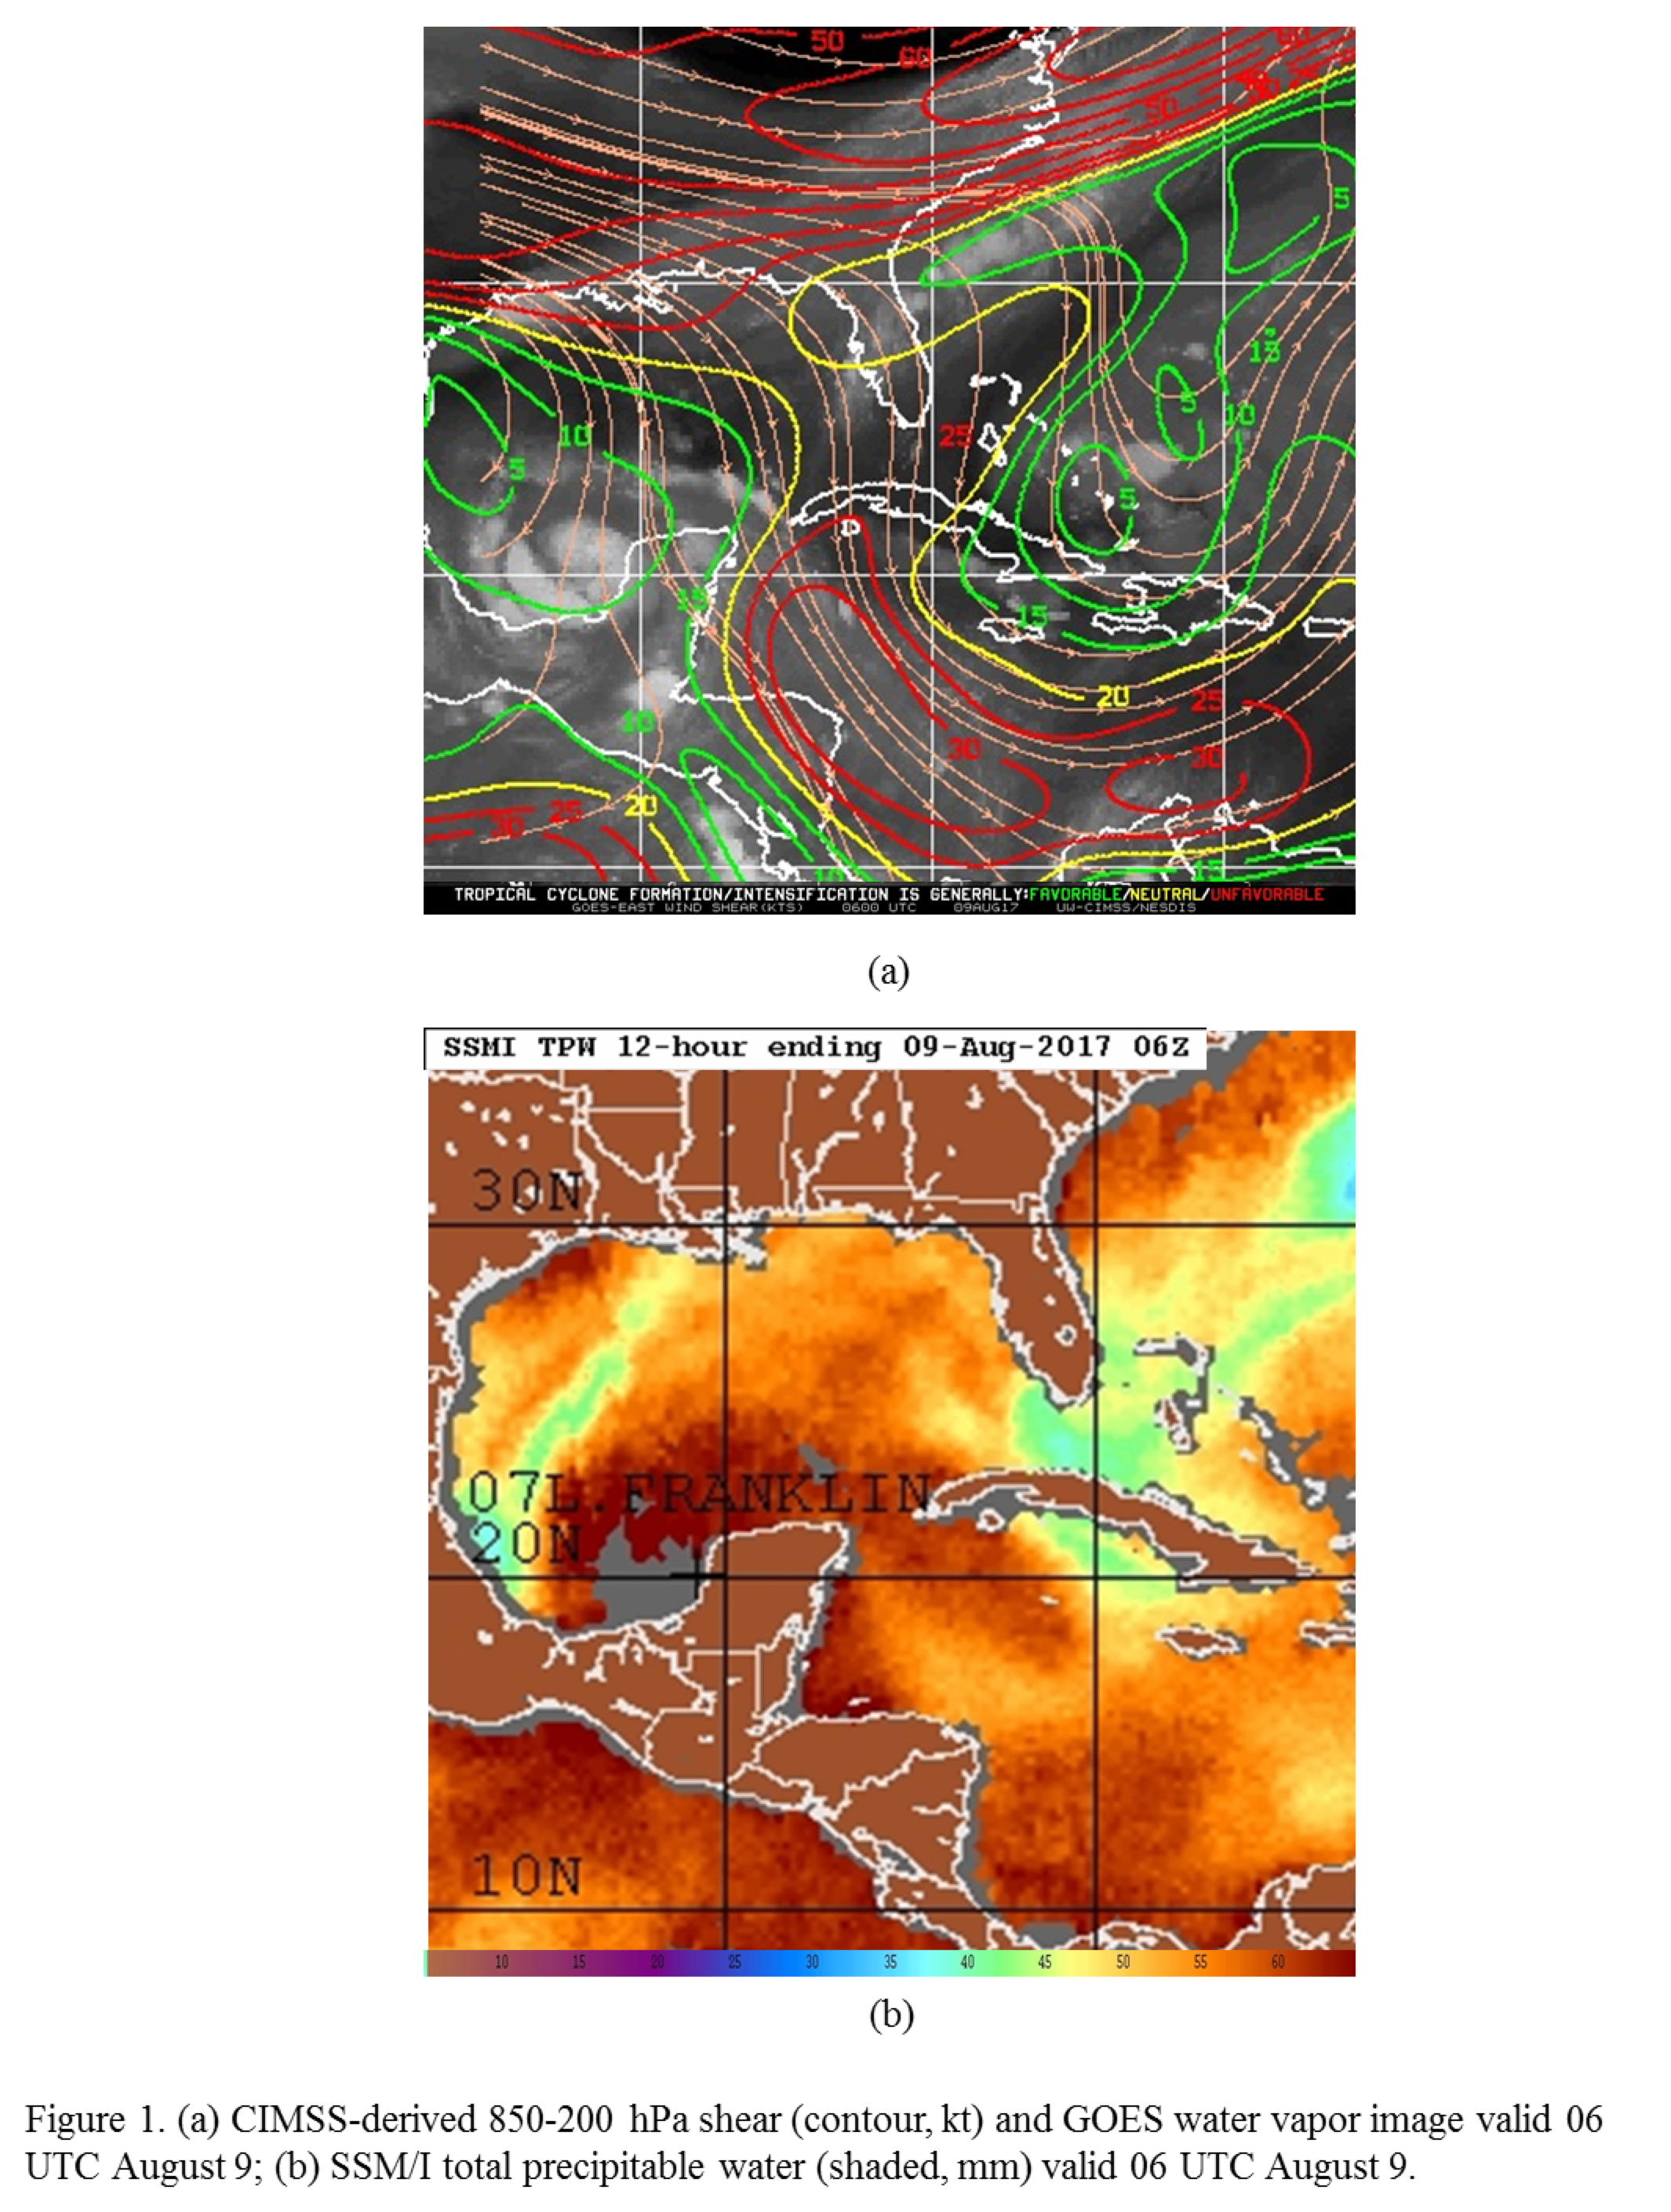
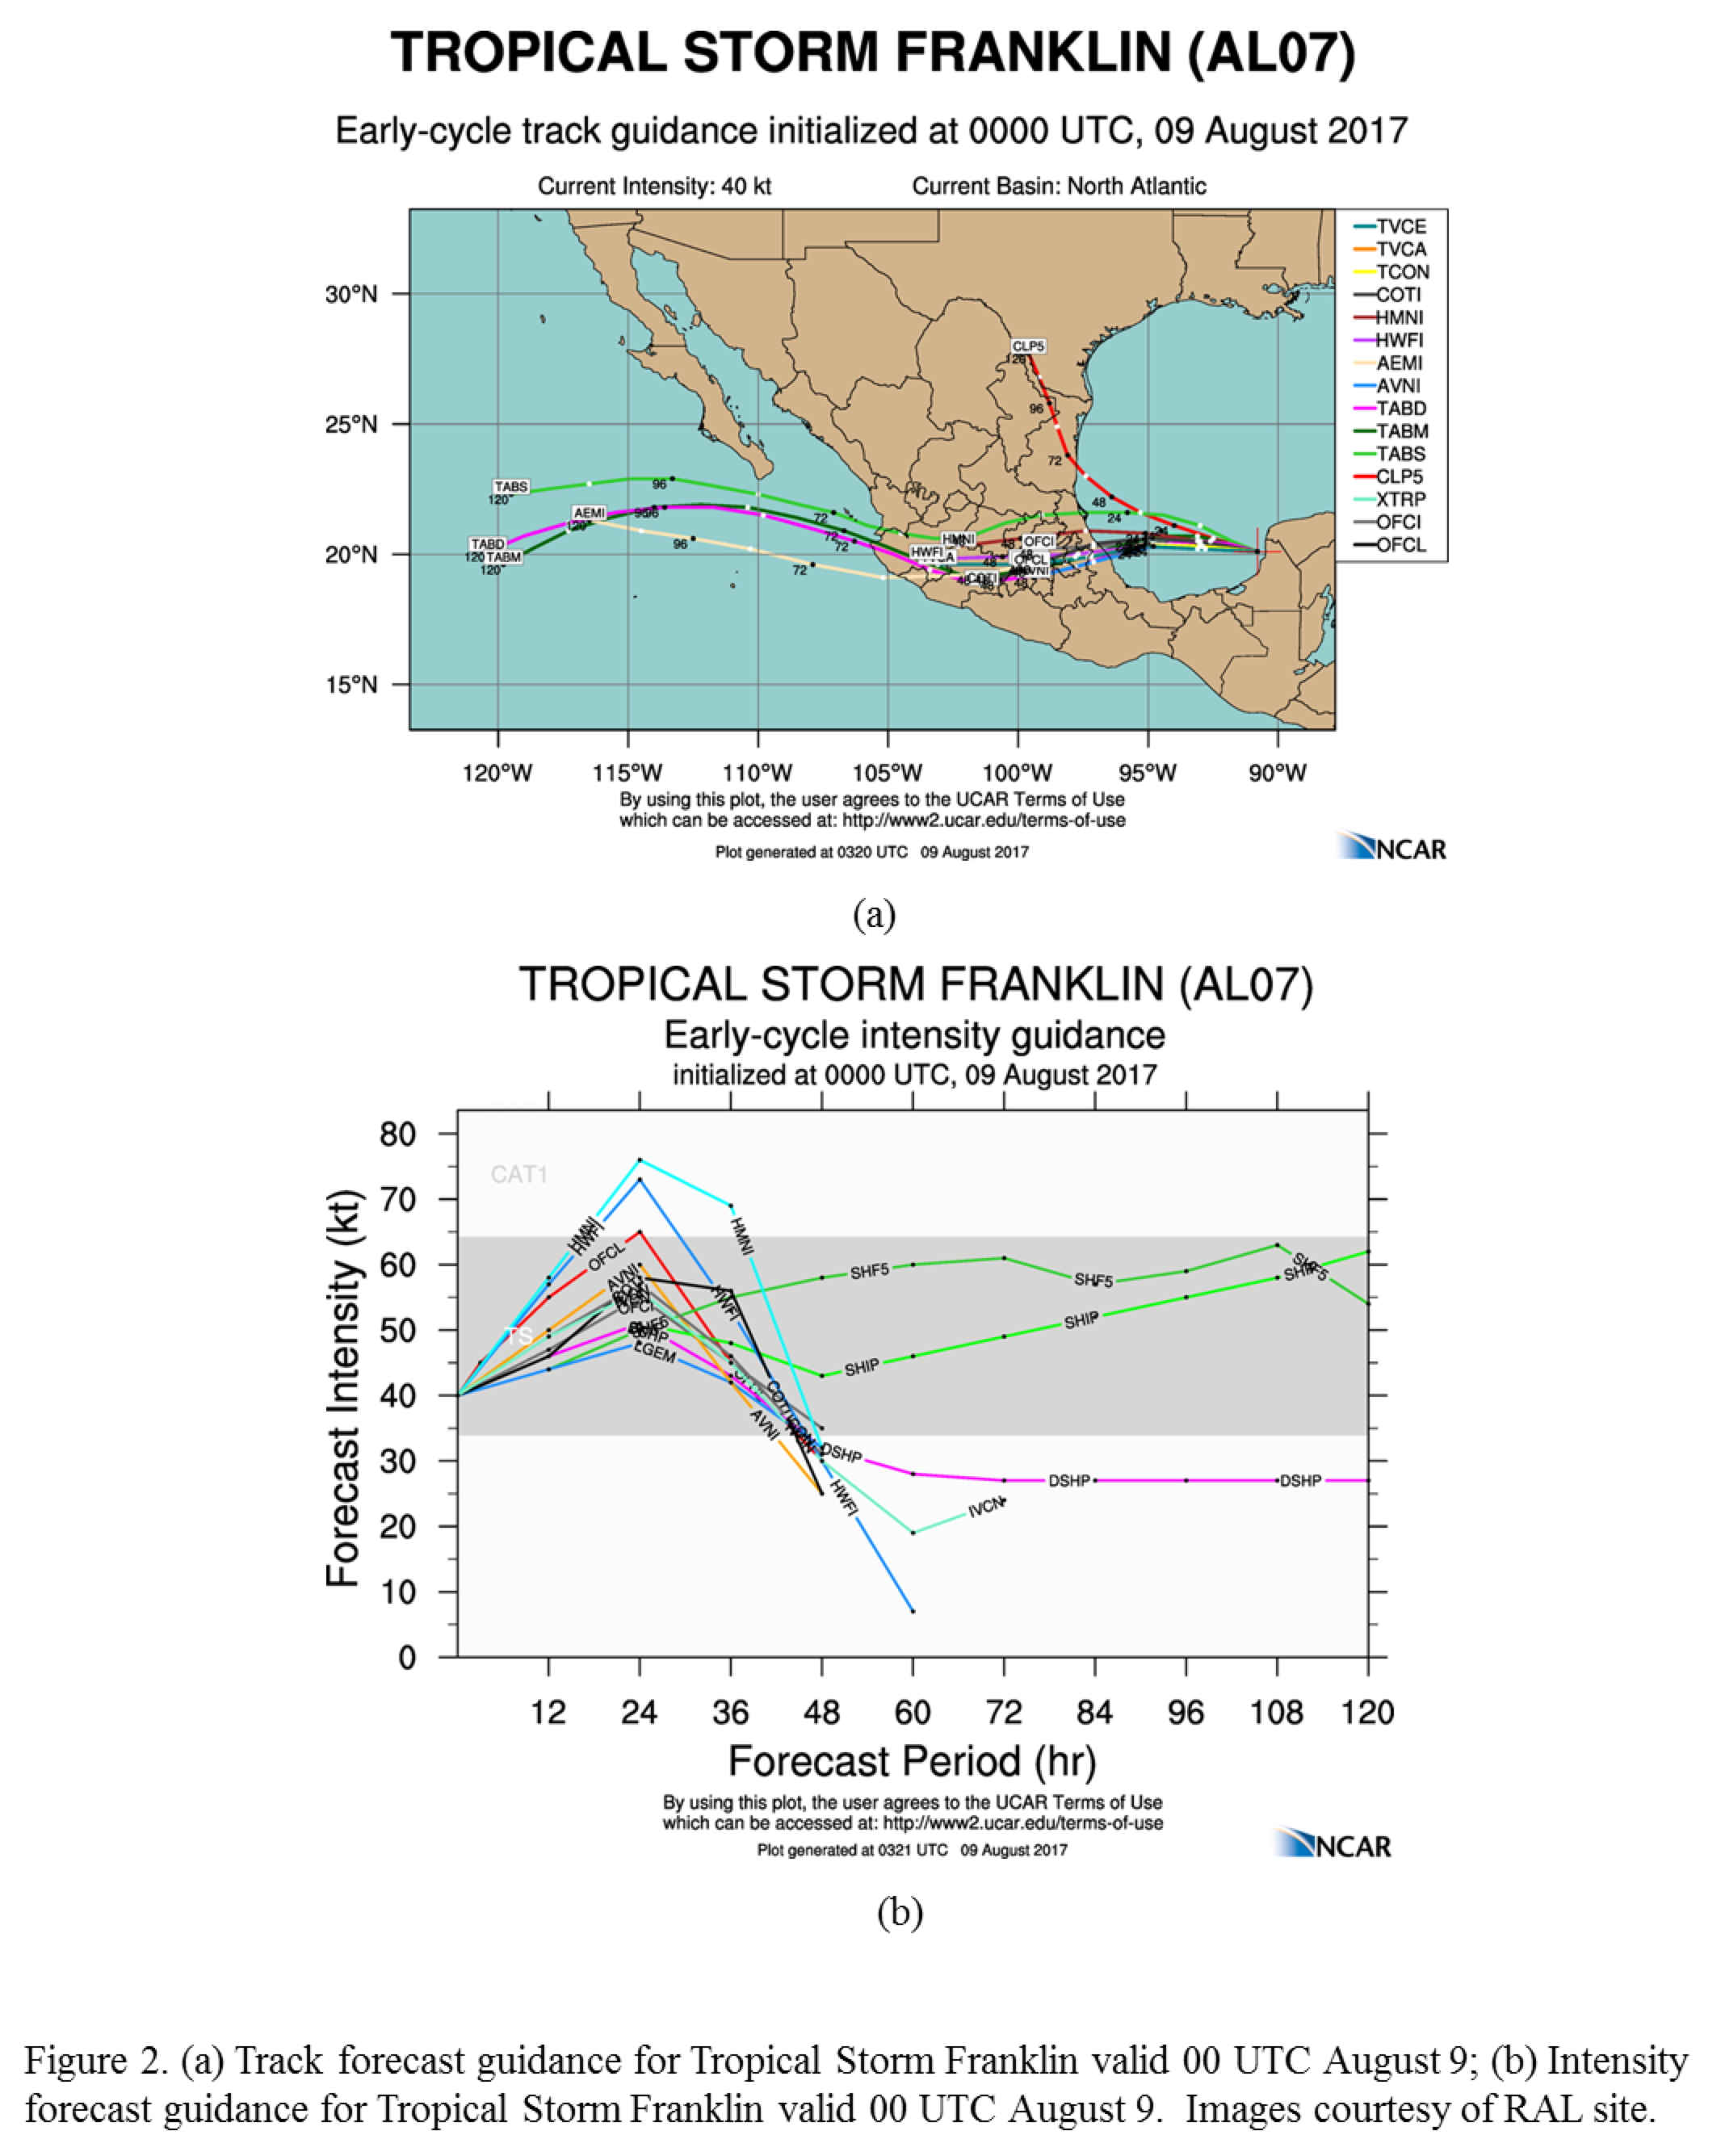
Perform a TDR mission in Tropical Storm Franklin, a 55-kt storm in the Bay of Campeche. Franklin has emerged from the Yucatan, in an environment characterized by weak north-northeasterly shear, with warm sea surface temperatures and an apparent moist lower troposphere (Fig. 1) -- a favorable environment for intensification. Forecast guidance in the hours leading up to takeoff (Fig. 2) suggested close agreement that the storm would track westward, making a second landfall in Mexico in about 36 h. Intensity forecast guidance generally intensified the storm, with some guidance (e.g., HWRF) rapidly intensifying Franklin to a 70-kt hurricane within 24 h. The official forecast was not as aggressive, but did predict Franklin would reach hurricane strength within 24 h.
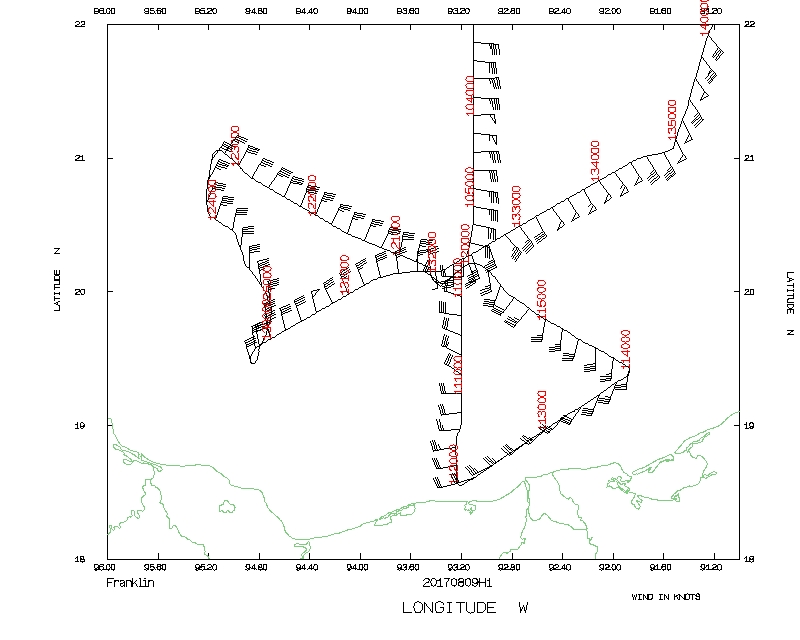
 Figure 3. Proposed NOAA 42 track |
Fly a butterfly pattern, with 105 nm legs, and an IP on the north side (Fig. 3). Perform a center fix for NHC on the first pass. Fly at 10,000 ft. Only drop a sonde at the center on the first pass, and four AXBTs on the north and west turn points. Coordinate the leg with the Global Hawk on the first north-south pass.
|
Prepared by the Hurricane Research Division August 07, 2017 Aircraft: N42RF Proposed takeoff: 09/0800Z
DROP LOCATION TABLE
| #
| LAT
| LON
| RAD/AZM
| Time
|
| deg min
| deg min
| n mi/deg
| hr:min
| 1S | 21 57 | 91 52 | 105/020 | 2:00
| 2S | 18 39 | 93 08 | 105/200 | 2:53
| 3S | 18 58 | 91 19 | 105/140 | 3:20
| 4S | 21 39 | 93 42 | 105/320 | 4:13
| 5S | 20 00 | 94 20 | 105/260 | 4:40
| 6S | 20 36 | 90 40 | 105/080 | 5:33
| | ||||||||||||||
Mission Summary :
| Take off | Landing
| Linder-Lakeland Airport, FL
| 08:08 UTC
| Linder-Lakeland Airport, FL
| 16:08 UTC
| Penetrations
| 3
| | ||||
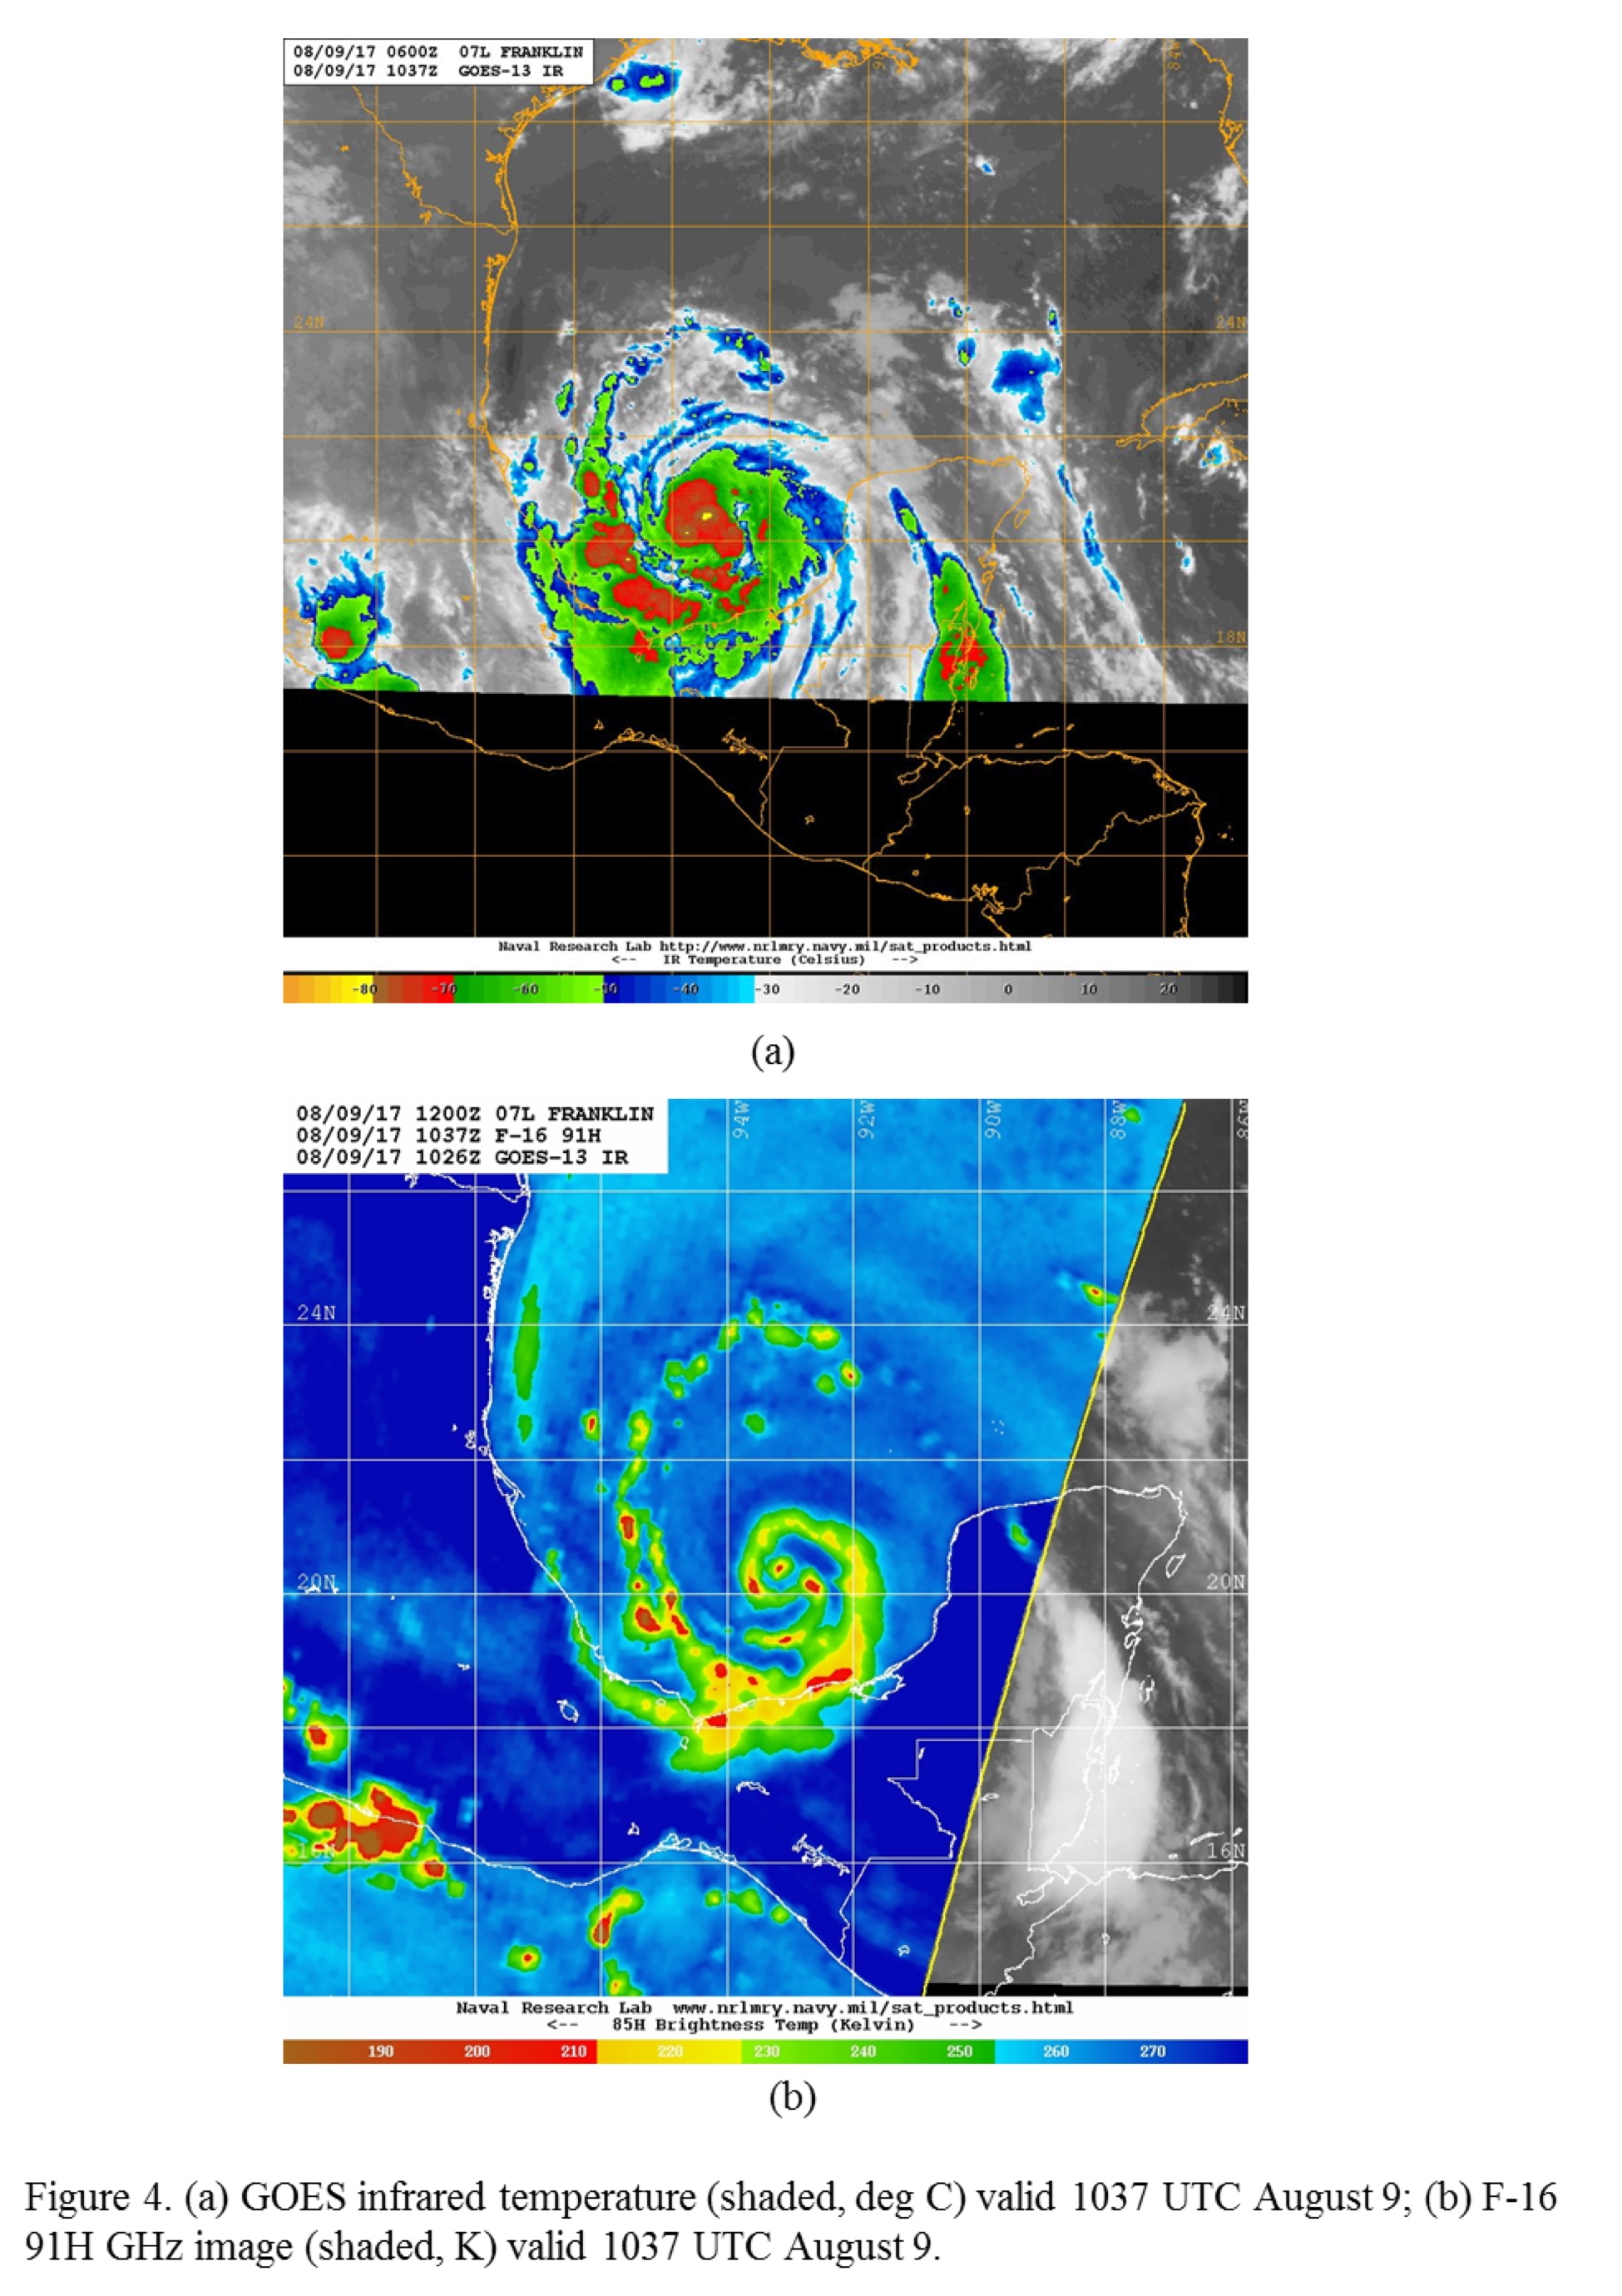
The satellite presentation of Franklin at the beginning of the mission (Fig. 4) showed that relatively cold cloud tops were symmetrically-distributed around Franklin, with a small area of cloud tops < -80 C located north of the center. Passive microwave imagery showed a clear spiral pattern, with a maximum coverage of ice scattering on the south side (downshear). Several localized areas of significant ice scattering, indicative of deep convection, were located at all locations around the storm.
|
|
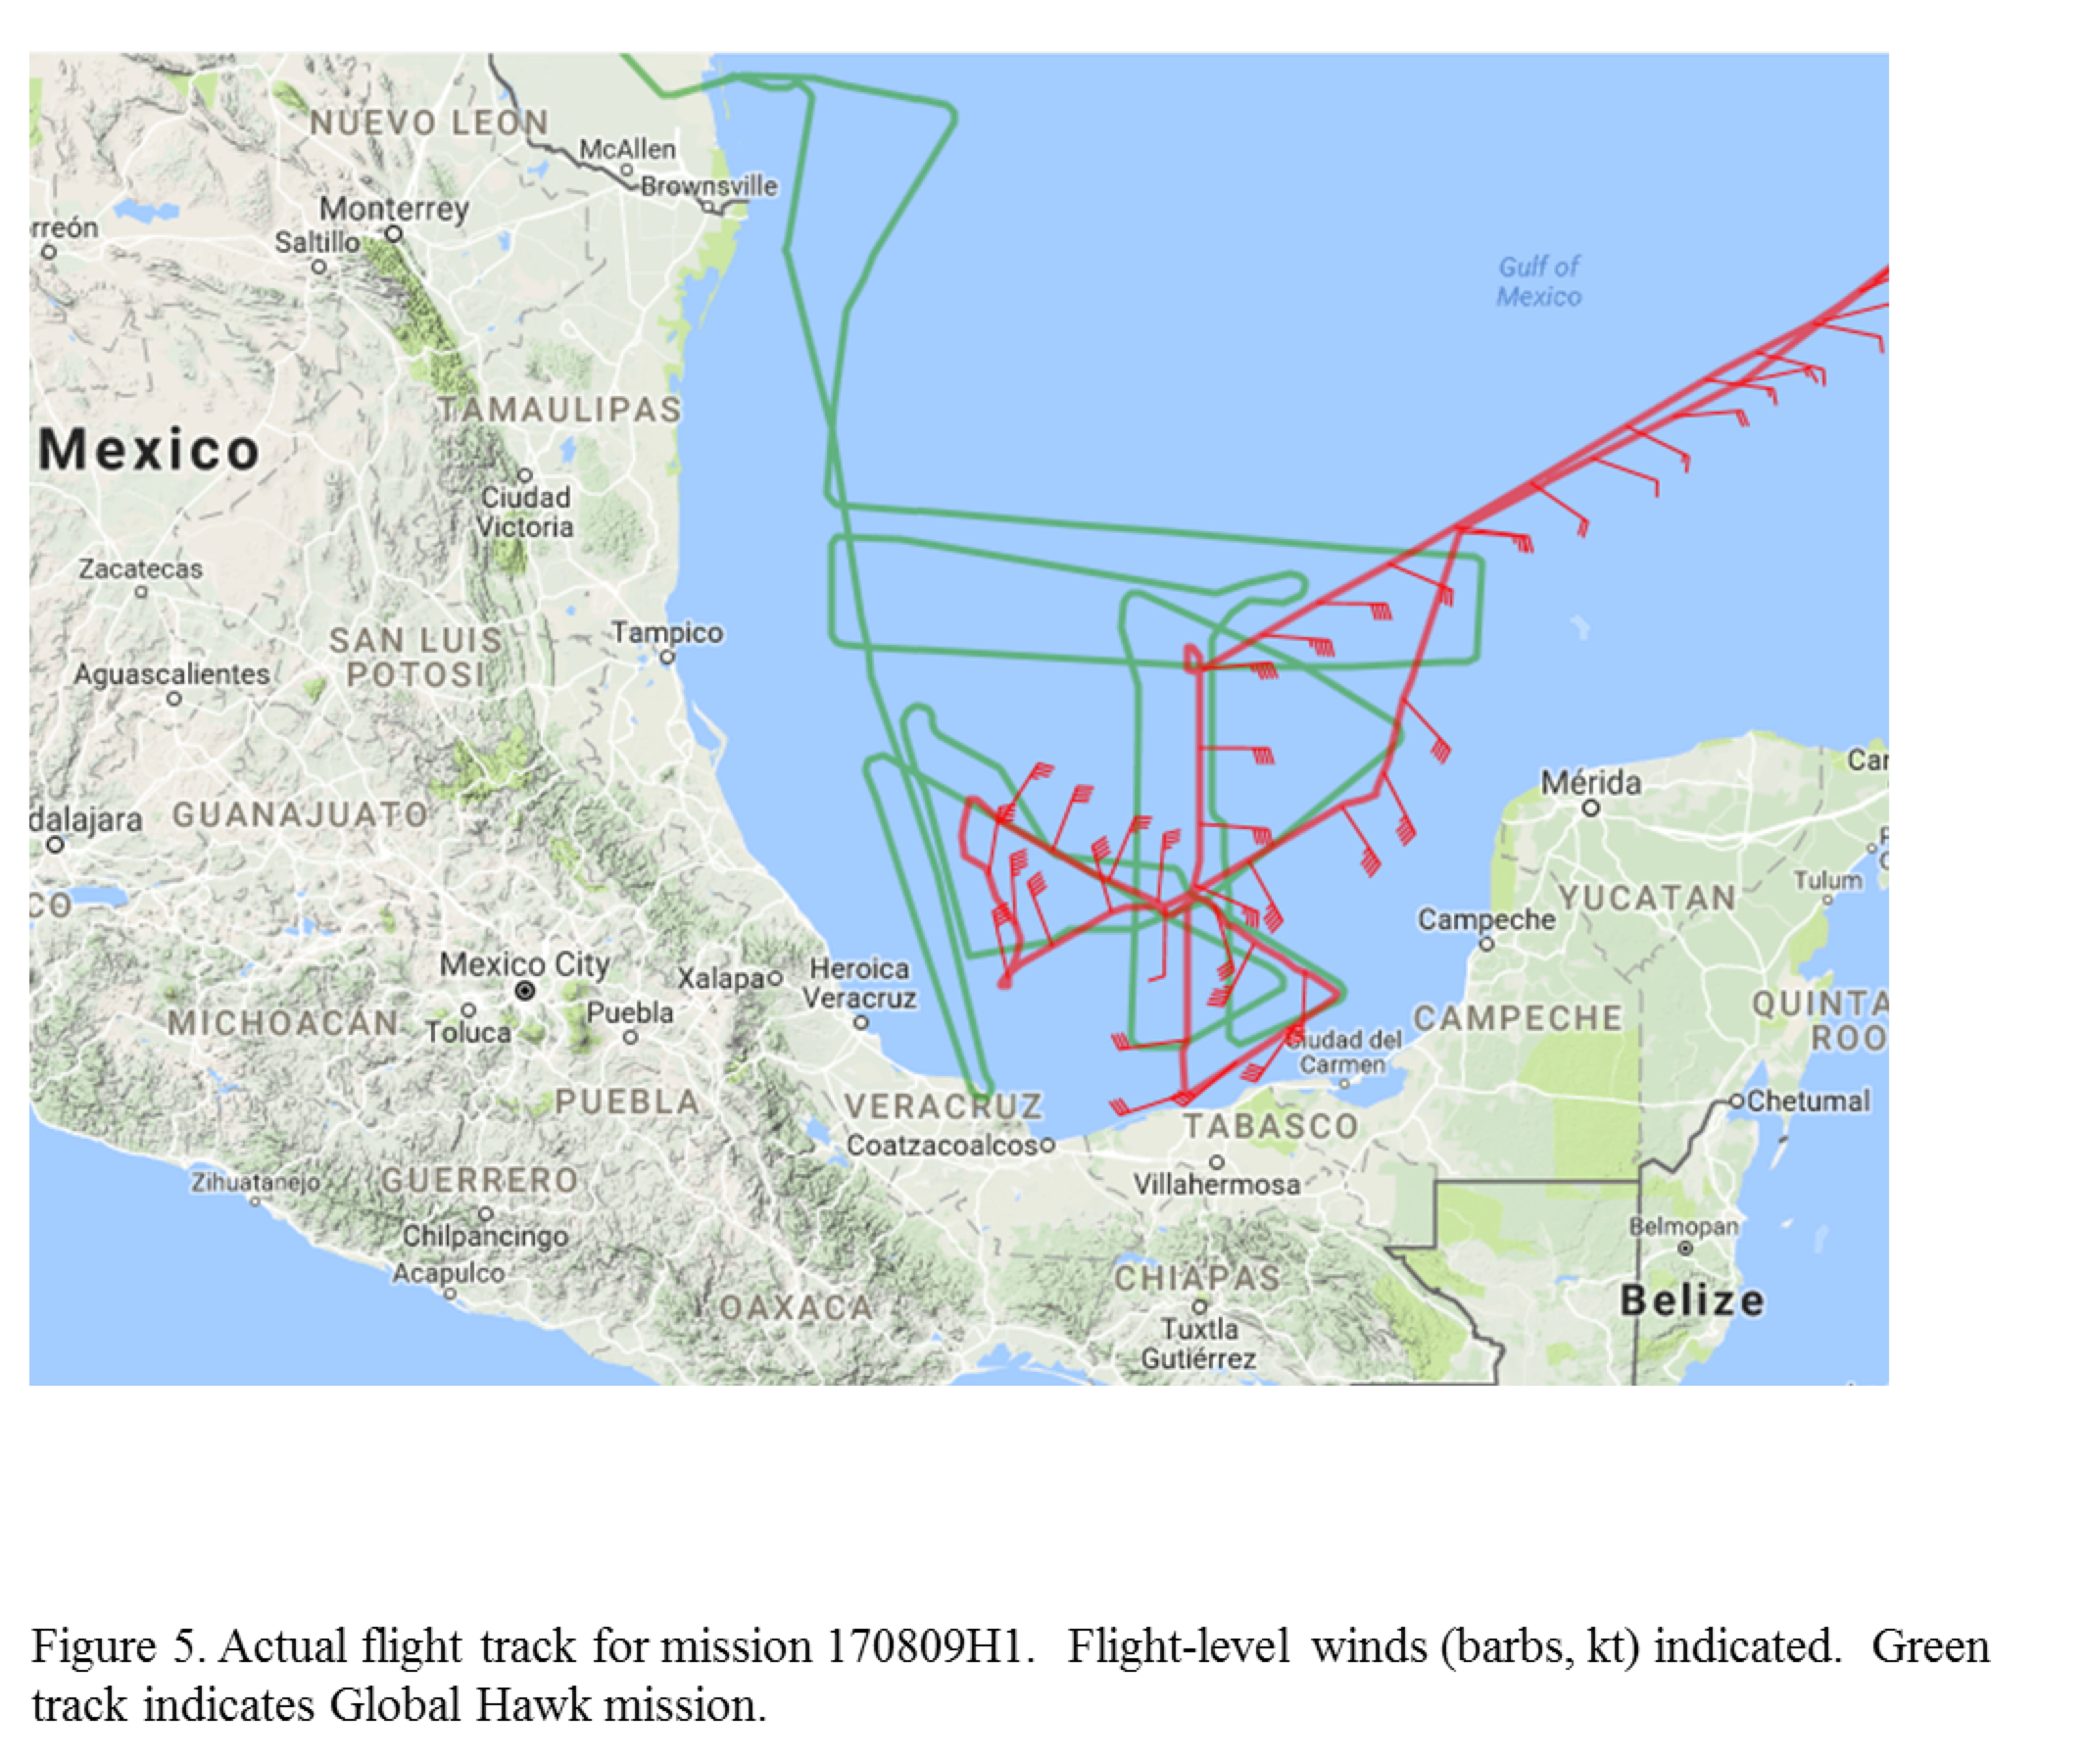
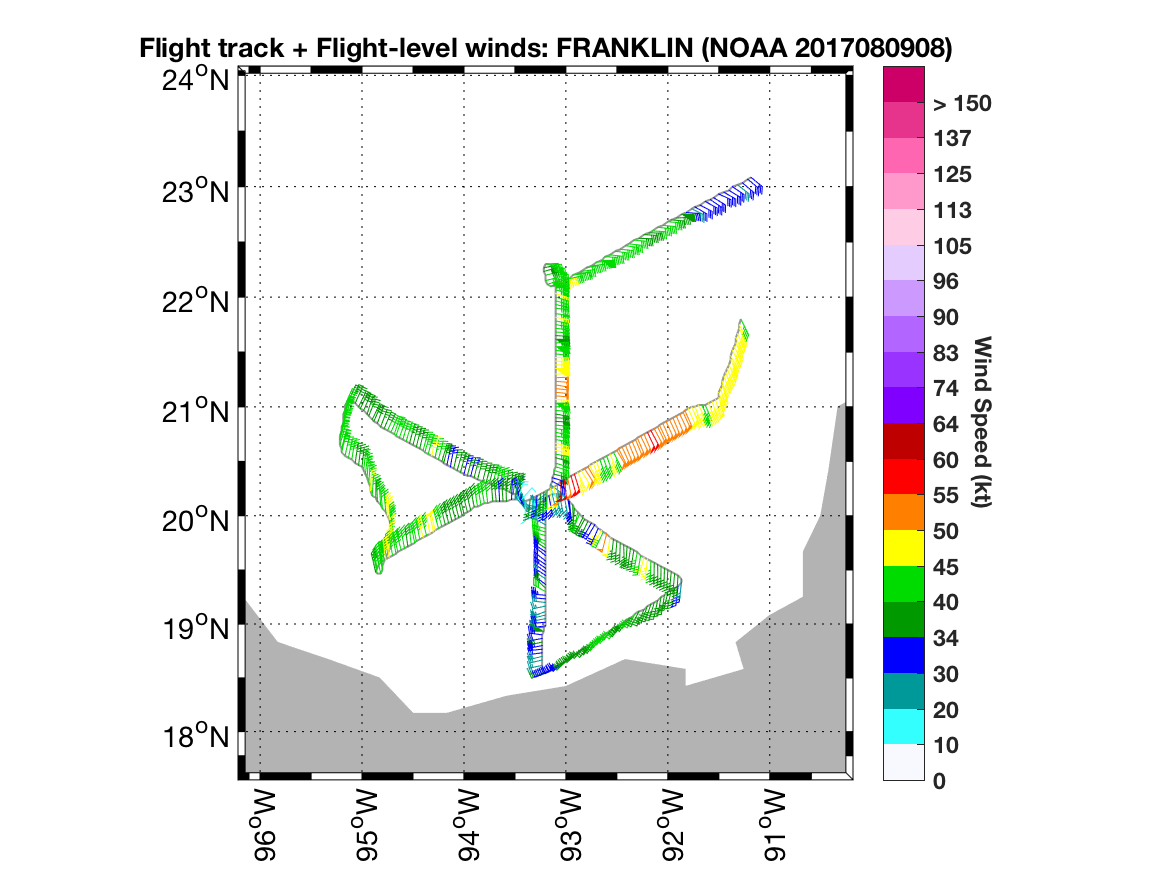
The actual flight track in shown in Fig. 5. Takeoff was at 0809 UTC from Lakeland, FL. The mission accomplished the intended flight pattern. In addition, the first inbound leg, coming in from the IP on the north side of the storm, was well-coordinated with the Global Hawk (see green track in Fig. 5) for much of the leg. The Global Hawk did have to deviate a small distance to the east to avoid deep convection, but the two aircraft were still in relatively close proximity (~20 km separation or less) for most of this leg.
Radar analyses from the flight (Fig. 6) show that reflectivity was symmetrically distributed around the storm. The streamlines at 2 and 5 km altitude show that the circulation centers are nearly aligned. However, there is an indication that the streamlines cross one another at larger radii, suggesting that the circulations may be displaced from one another at these radii. A quantitative calculation of vortex tilt, based on a maximization of tangential wind in an annulus surrounding the radius of maximum wind, indicates that the vortex was tilted 17.5 km toward the southwest, even though the streamlines at the center appear aligned. These discrepancies suggest a complicated tilt structure. Wind speeds were maximized at 2 km in the northeast quadrant, to the right of the storm motion and in the USL quadrant, just downwind of most of the precipitation (cf. Fig. 6a).

|
|
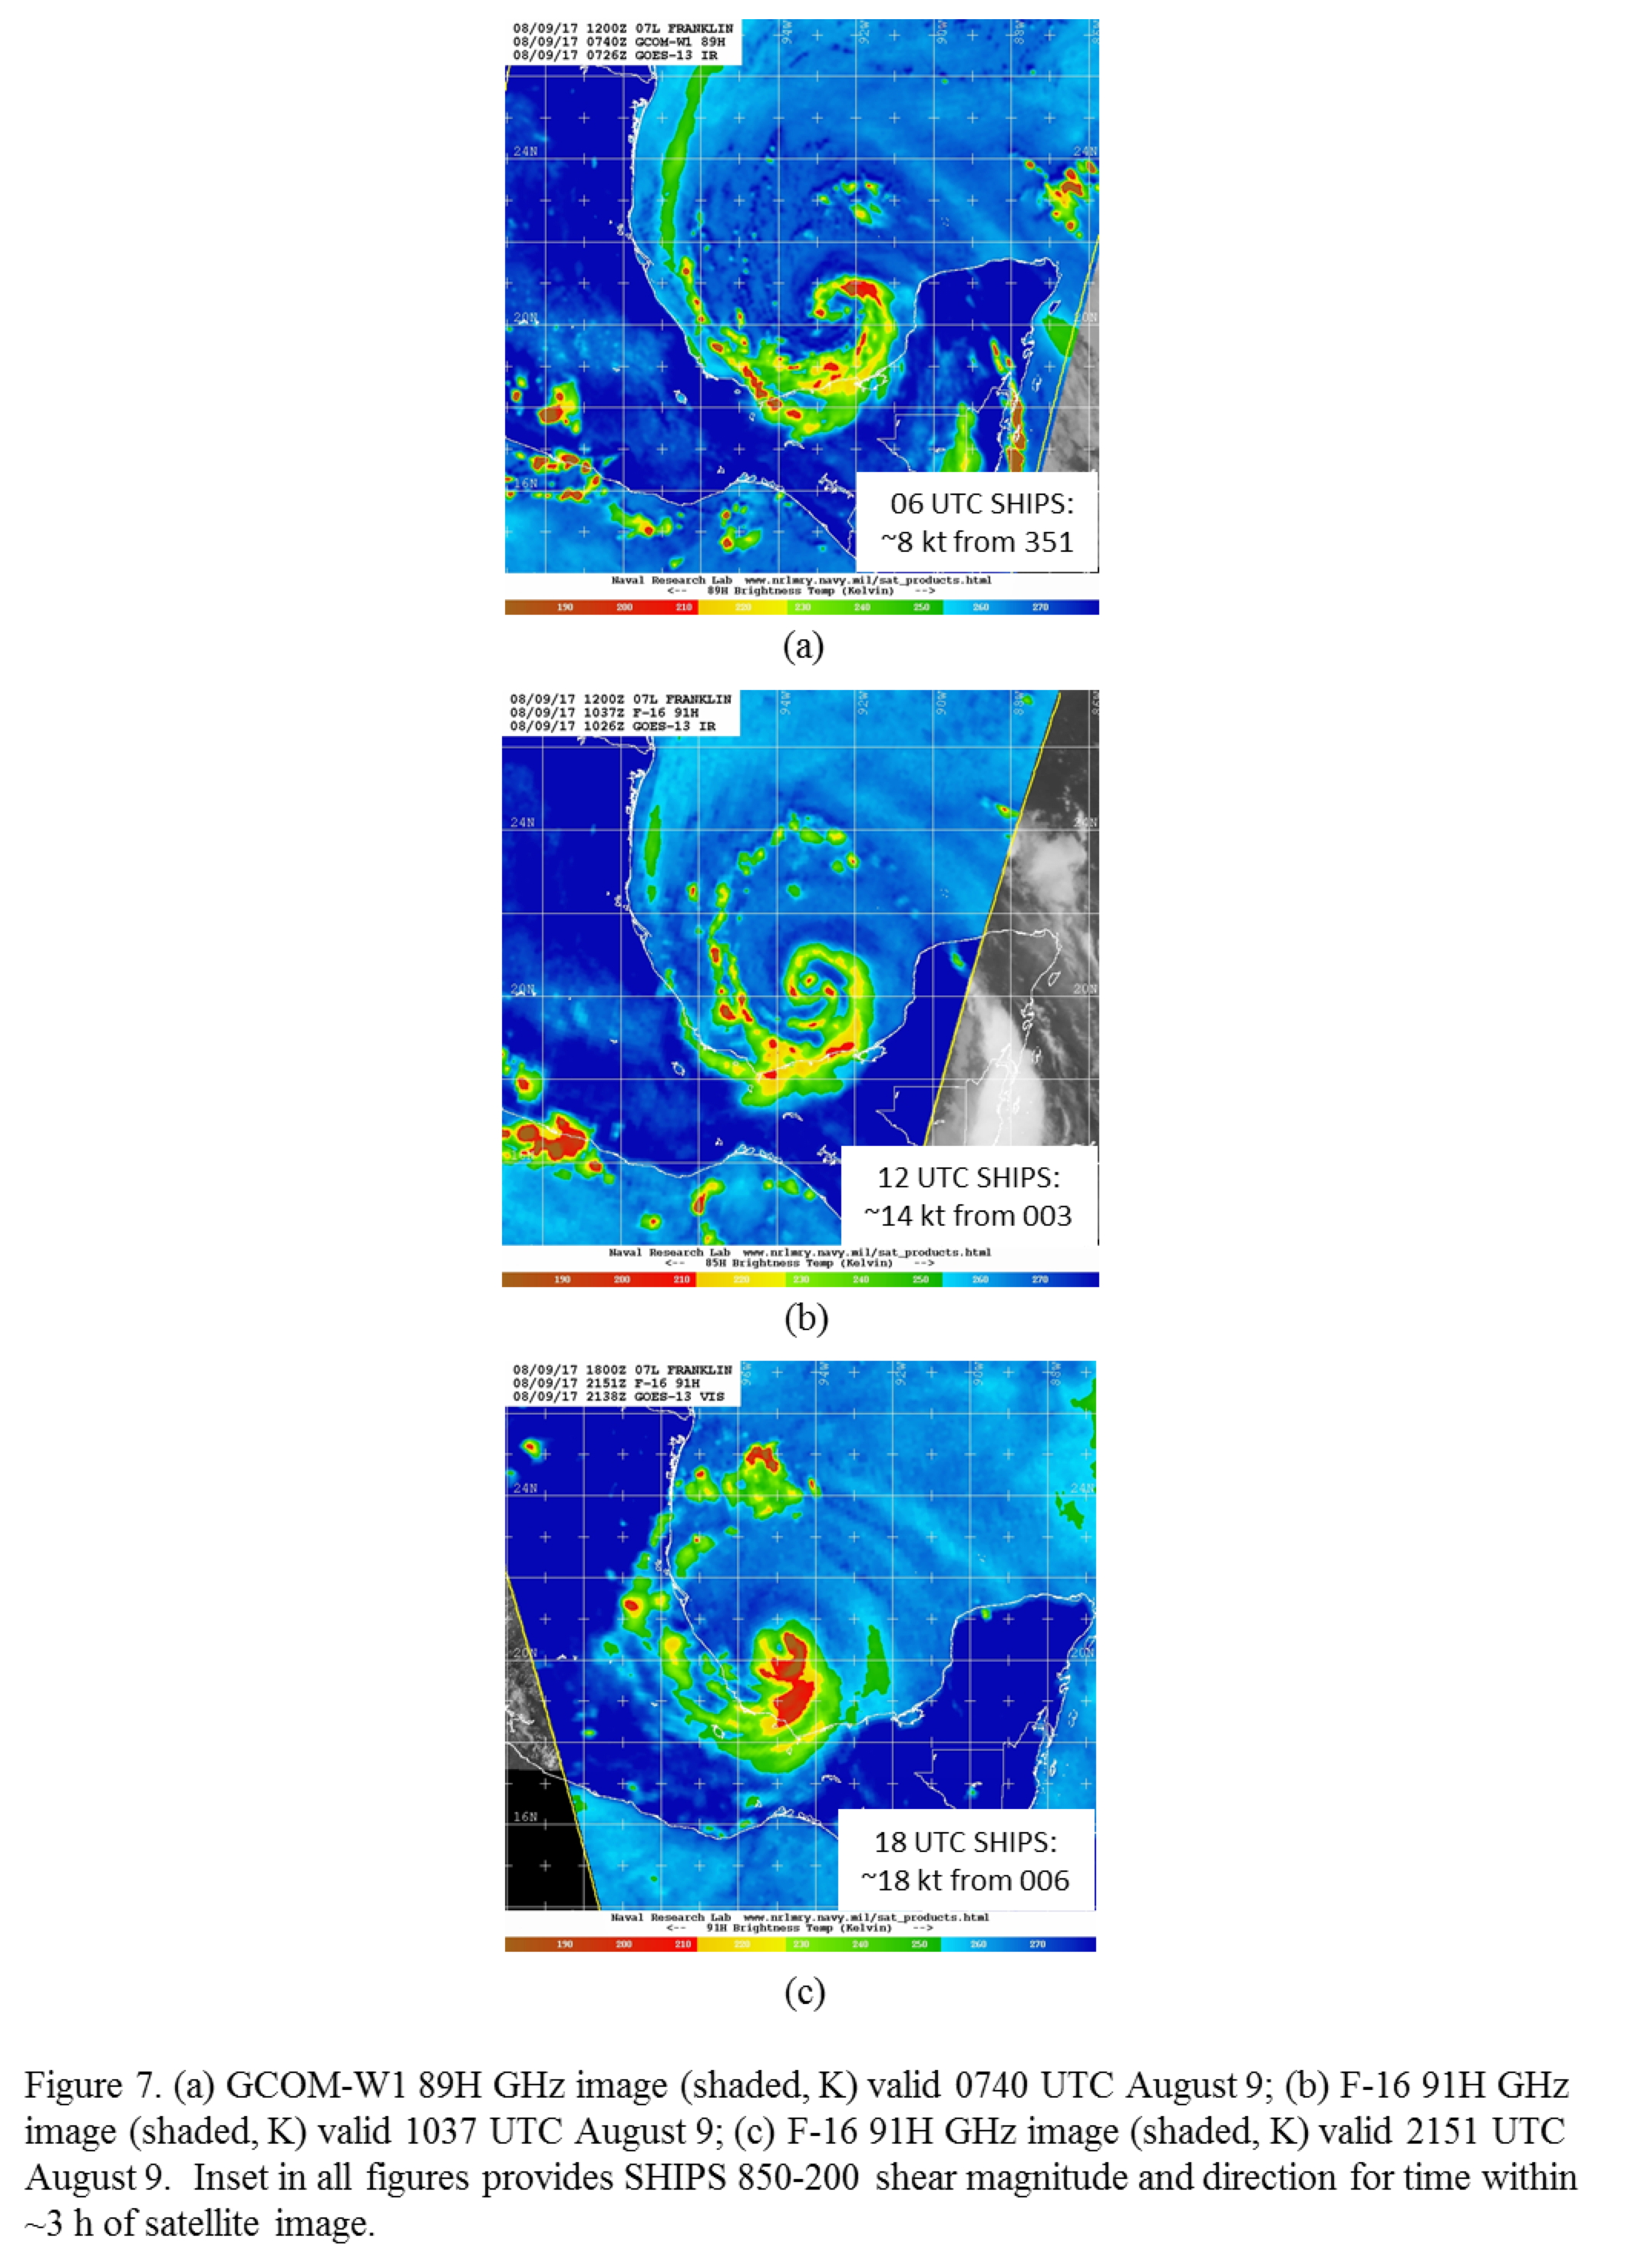
A series of 89-91 GHz passive microwave images during the mission (Fig. 7) show the evolving precipitation structure. Precipitation was oriented in a pronounced spiral band during the early stages of the mission, when the SHIPS shear was ~8-14 kt. A broad distribution of ice scattering is seen on the south side of the storm (downshear), but there are isolated regions of significant ice scattering, indicative of deep convection, all the way around the storm, in particular in the USL quadrant. Shortly after the mission was over (cf. Fig. 7c), the microwave image takes on more of a wavenumber-1 appearance, which could have been because the shear values (as diagnosed by SHIPS) had increased to ~18 kt. The most significant ice scattering is located DSL, though some does occur USL as well.
|
|
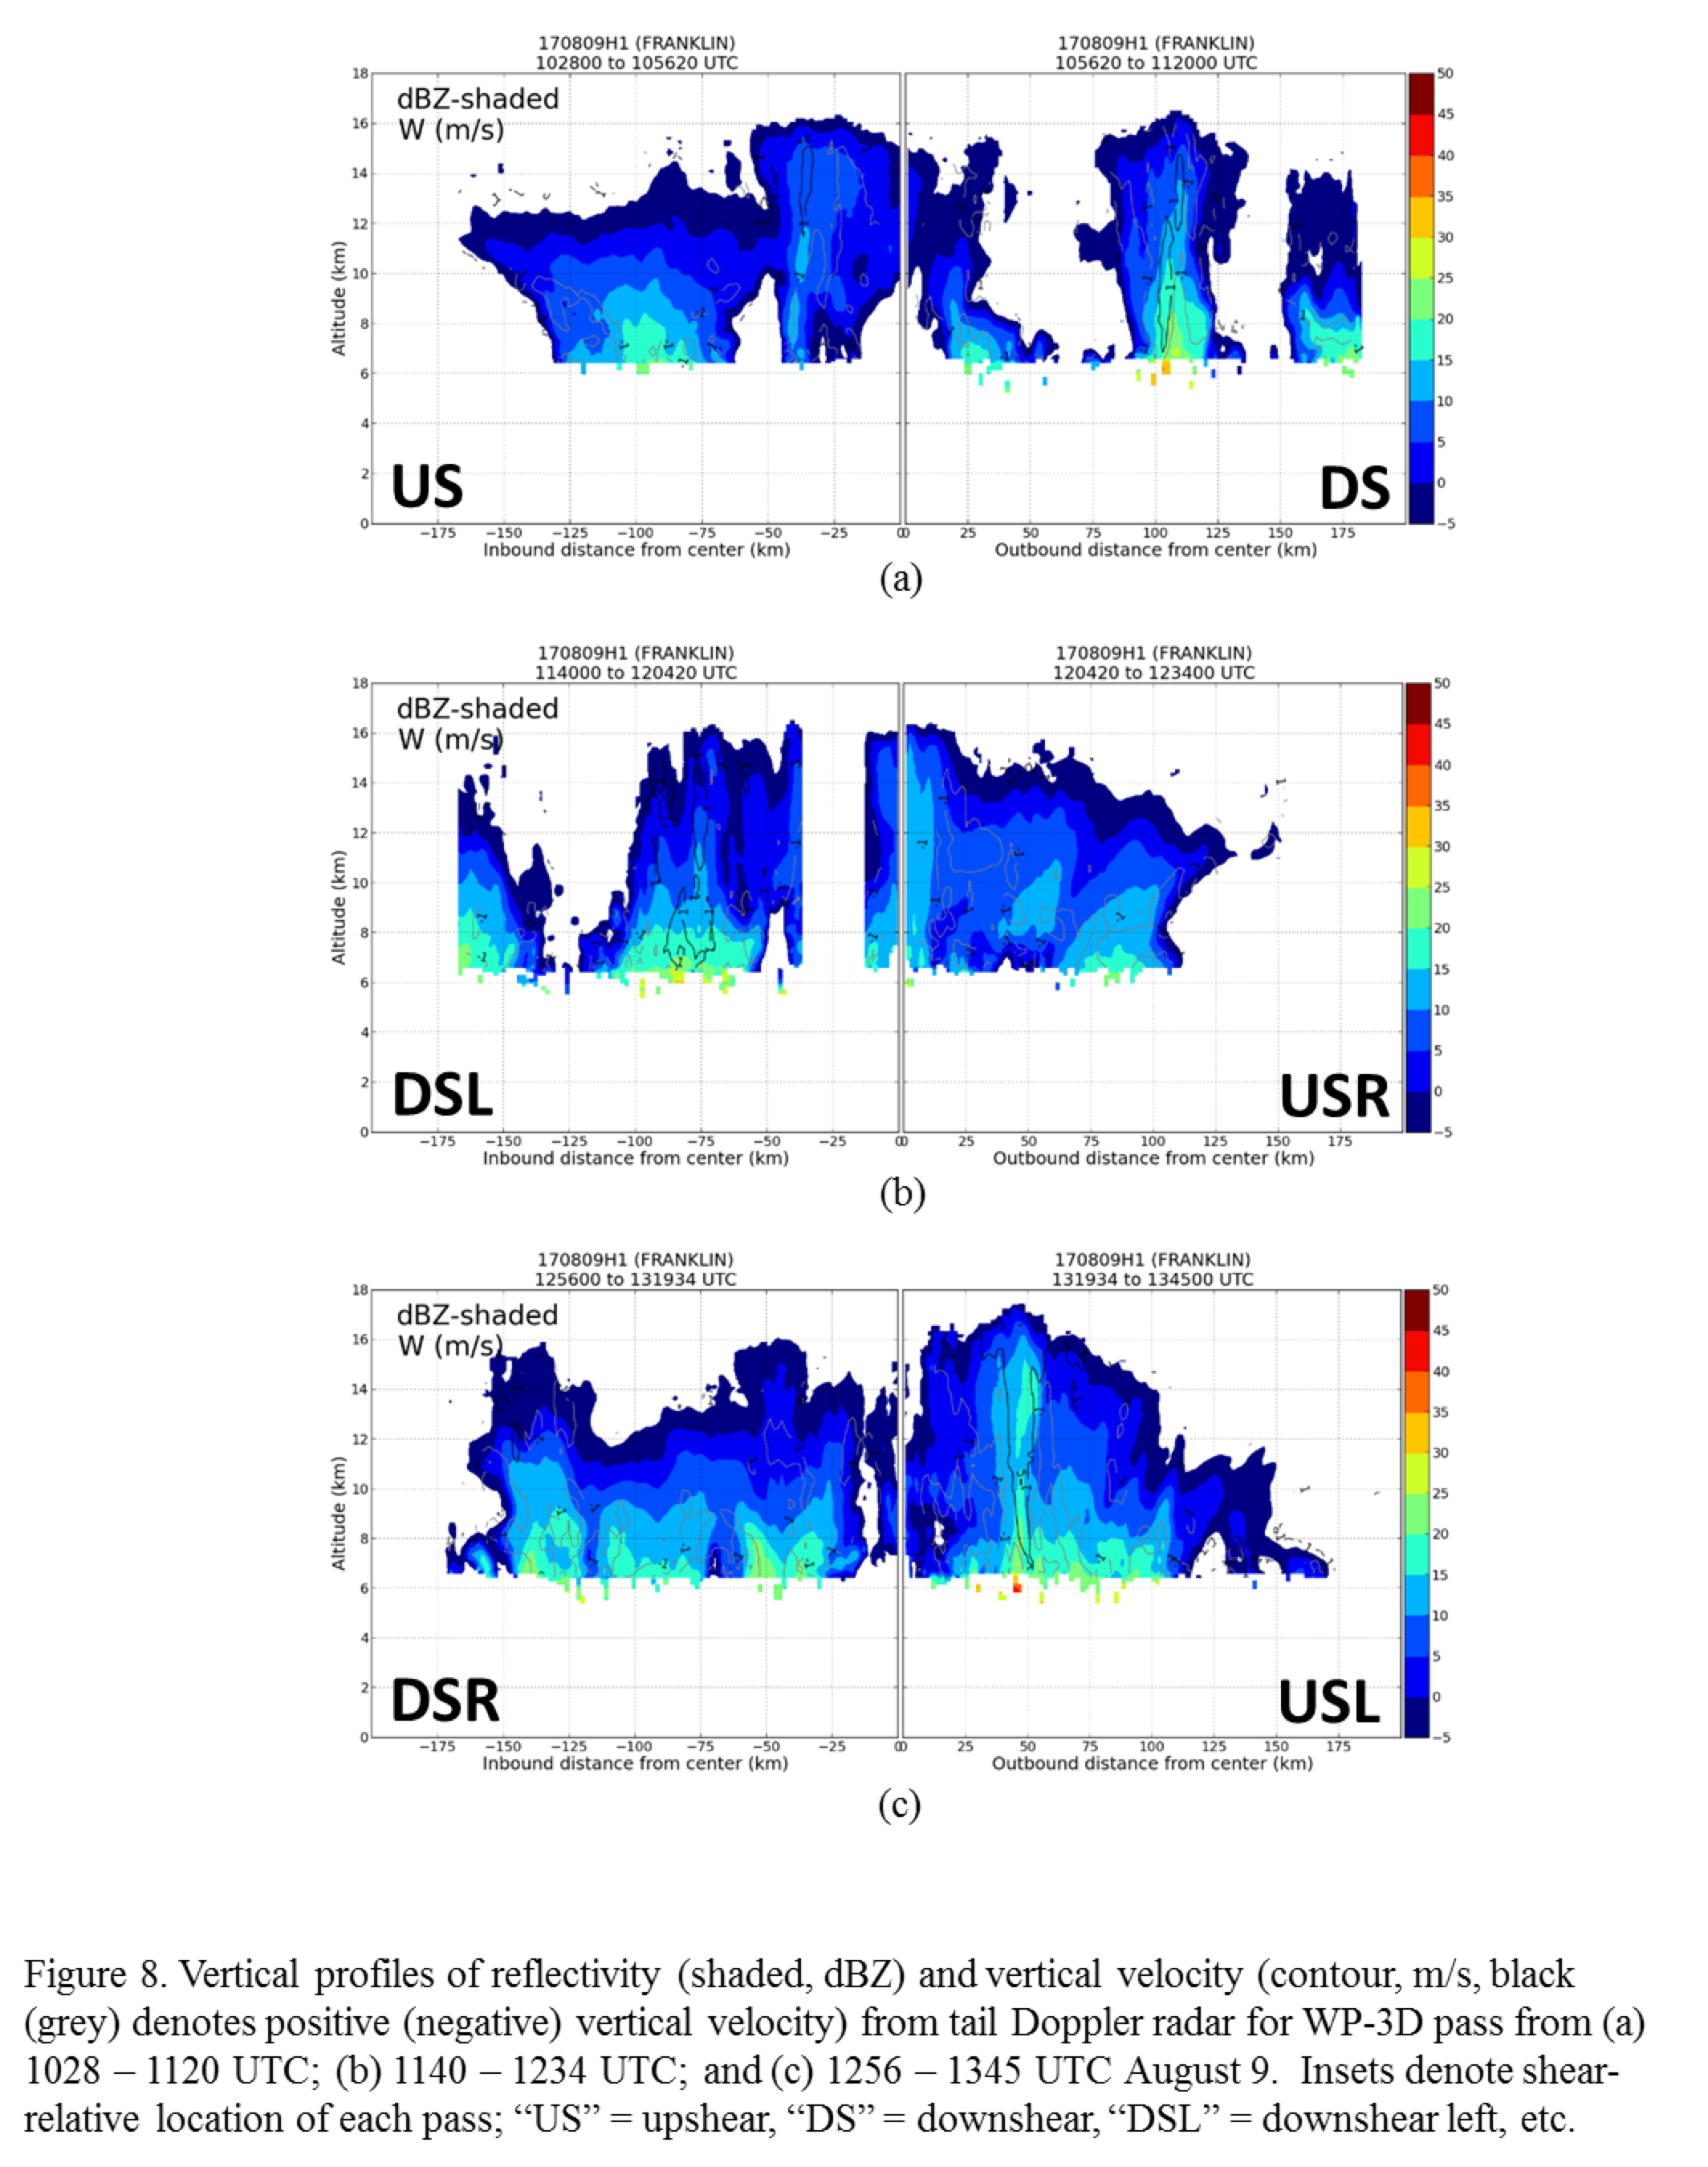
Vertical profiles of reflectivity from the tail Doppler radar (Fig. 8) show precipitation in all quadrants. However, the highest echo top, and strongest upward motion, is seen USL at a radius of ~50 km. Examining the profiles around the storm, starting DS, then DSL, then USL, then US, there appears to be an along-band variation in the structure of the radar echoes which may indicate the spiral nature of the precipitation or a temporal evolution of deep convection. The strongest echoes DS are seen at ~100 km radius, then at ~75 km DSL, then ~50 km USL, and finally ~30 km US. As mentioned previously, the highest echo tops appear to be USL.
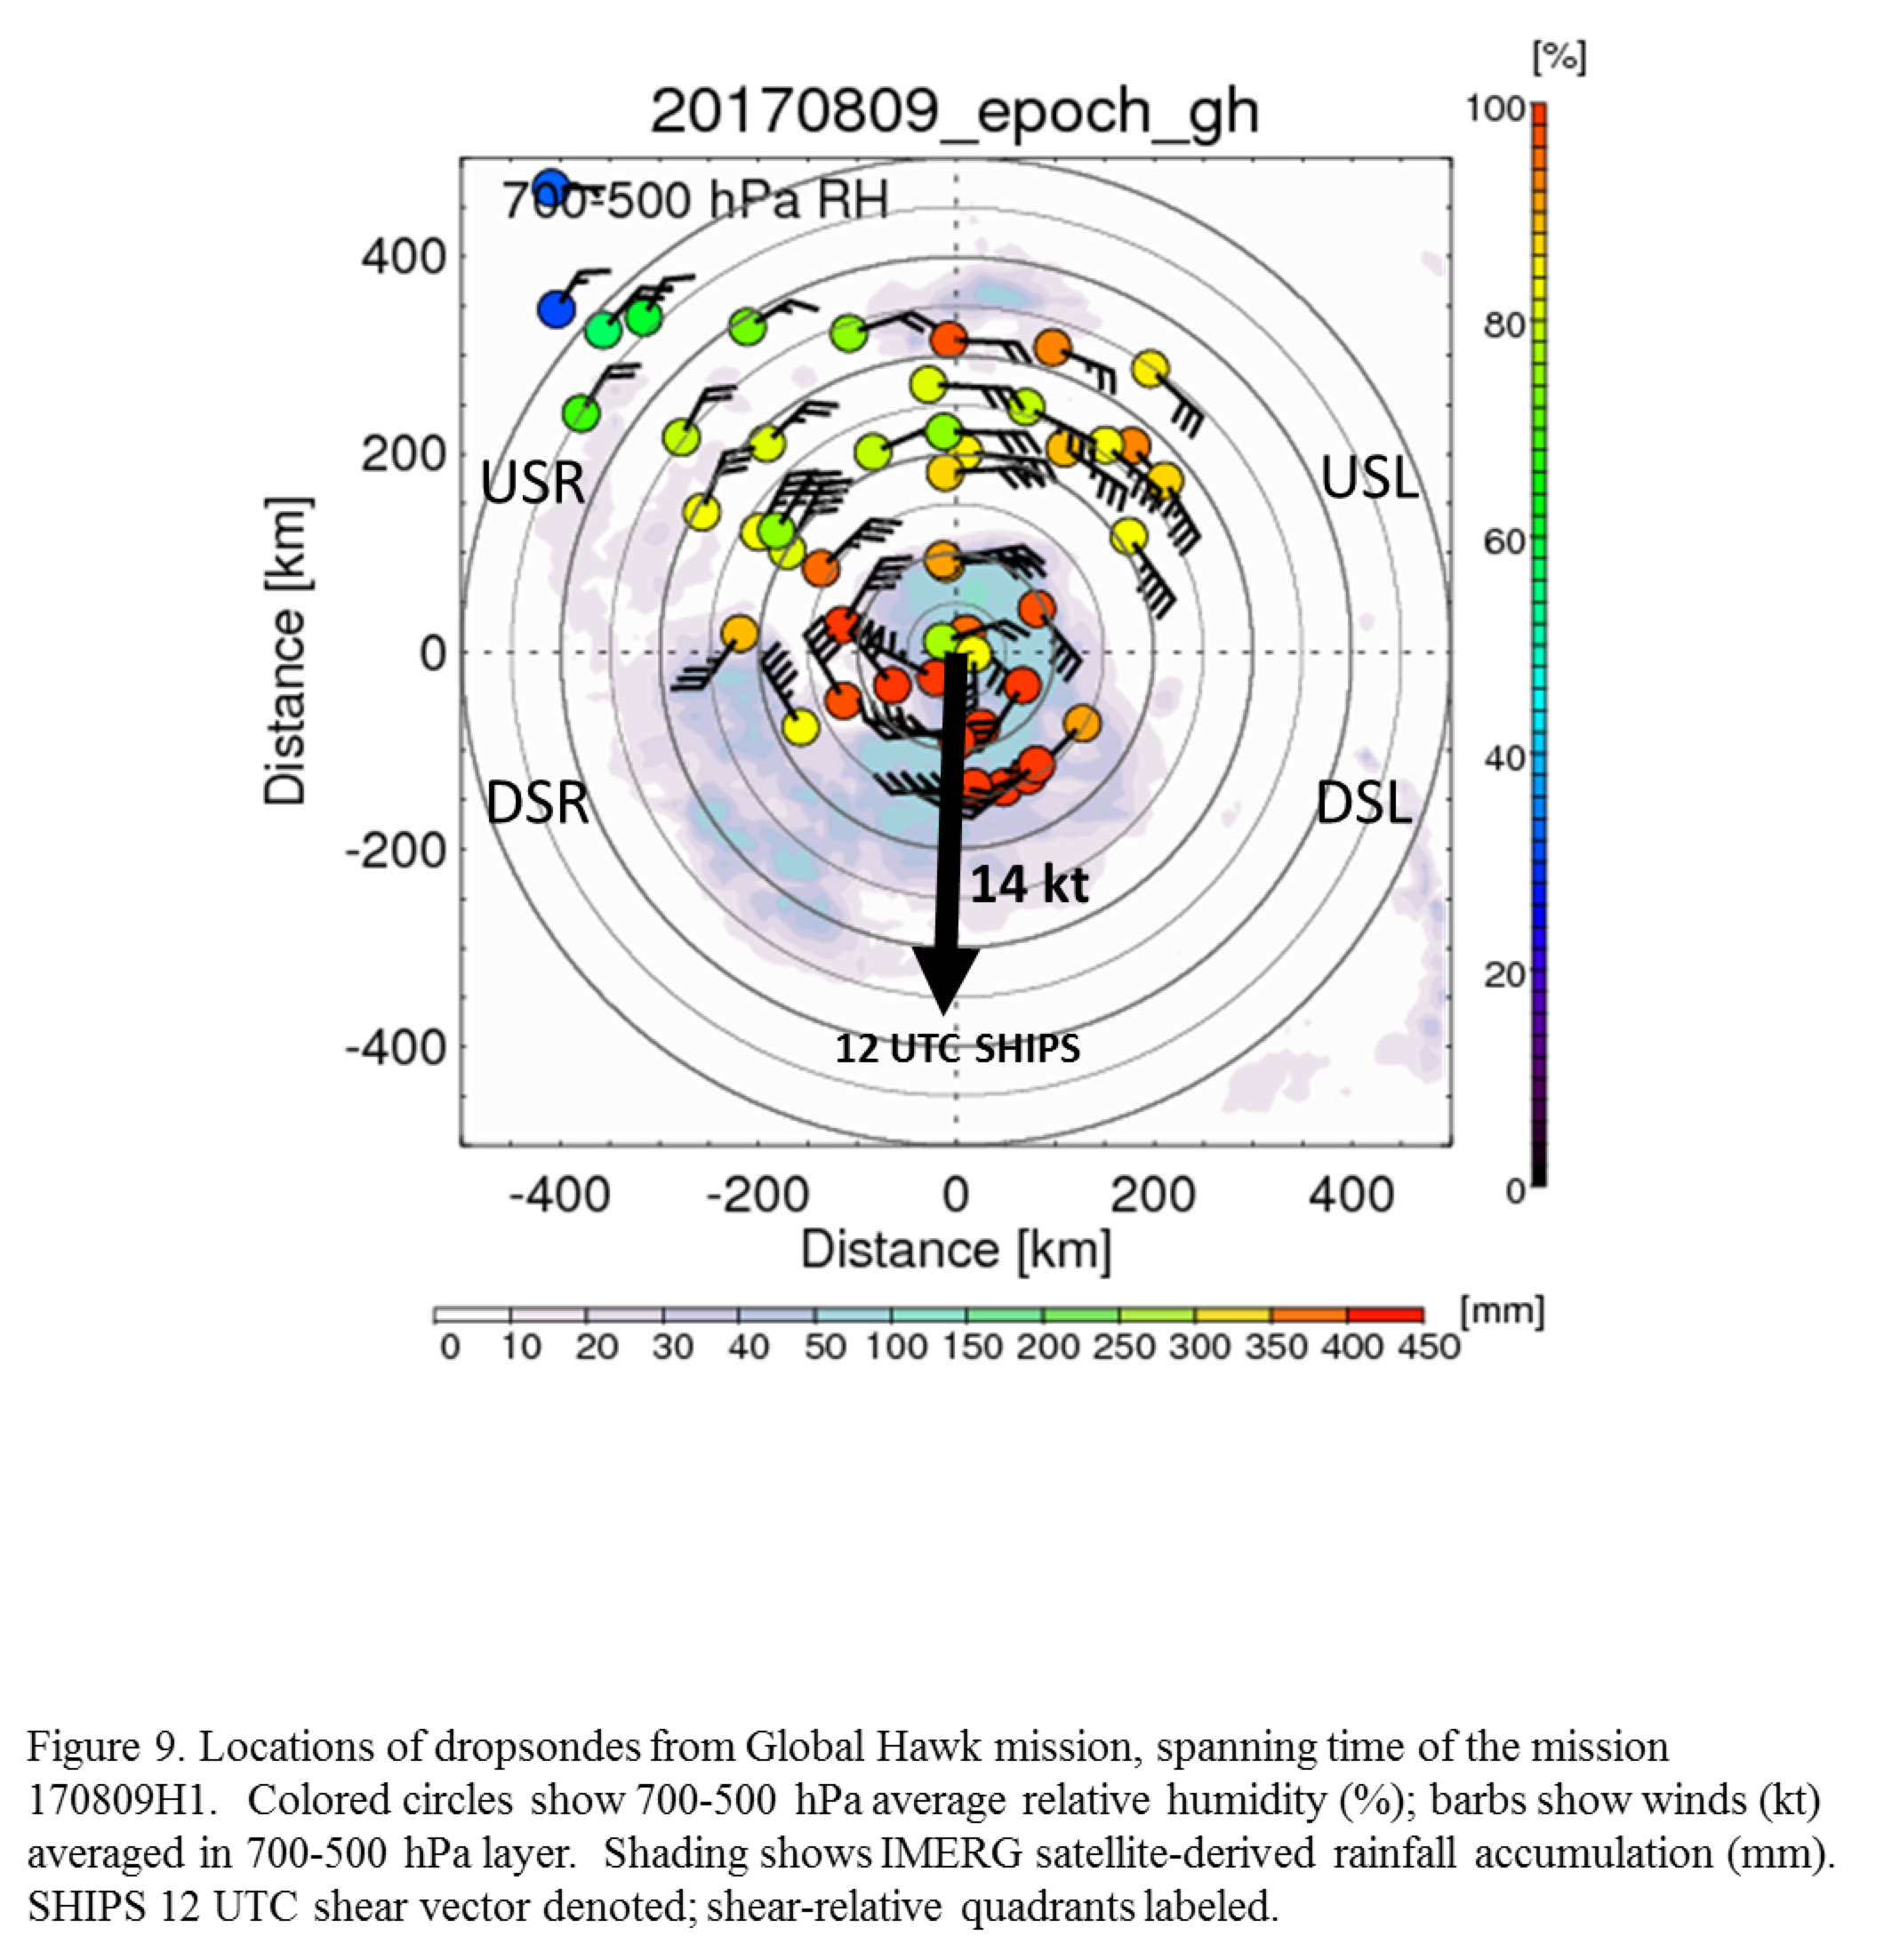
Midlevel relative humidity (RH; Fig. 9) shows high RH values all the way around the storm. Downshear the midlevel air is nearly saturated, but even upshear the RH is generally > 70-80% inside 200 km radius. Outside 200 km the air dries out considerably in the USR quadrant.
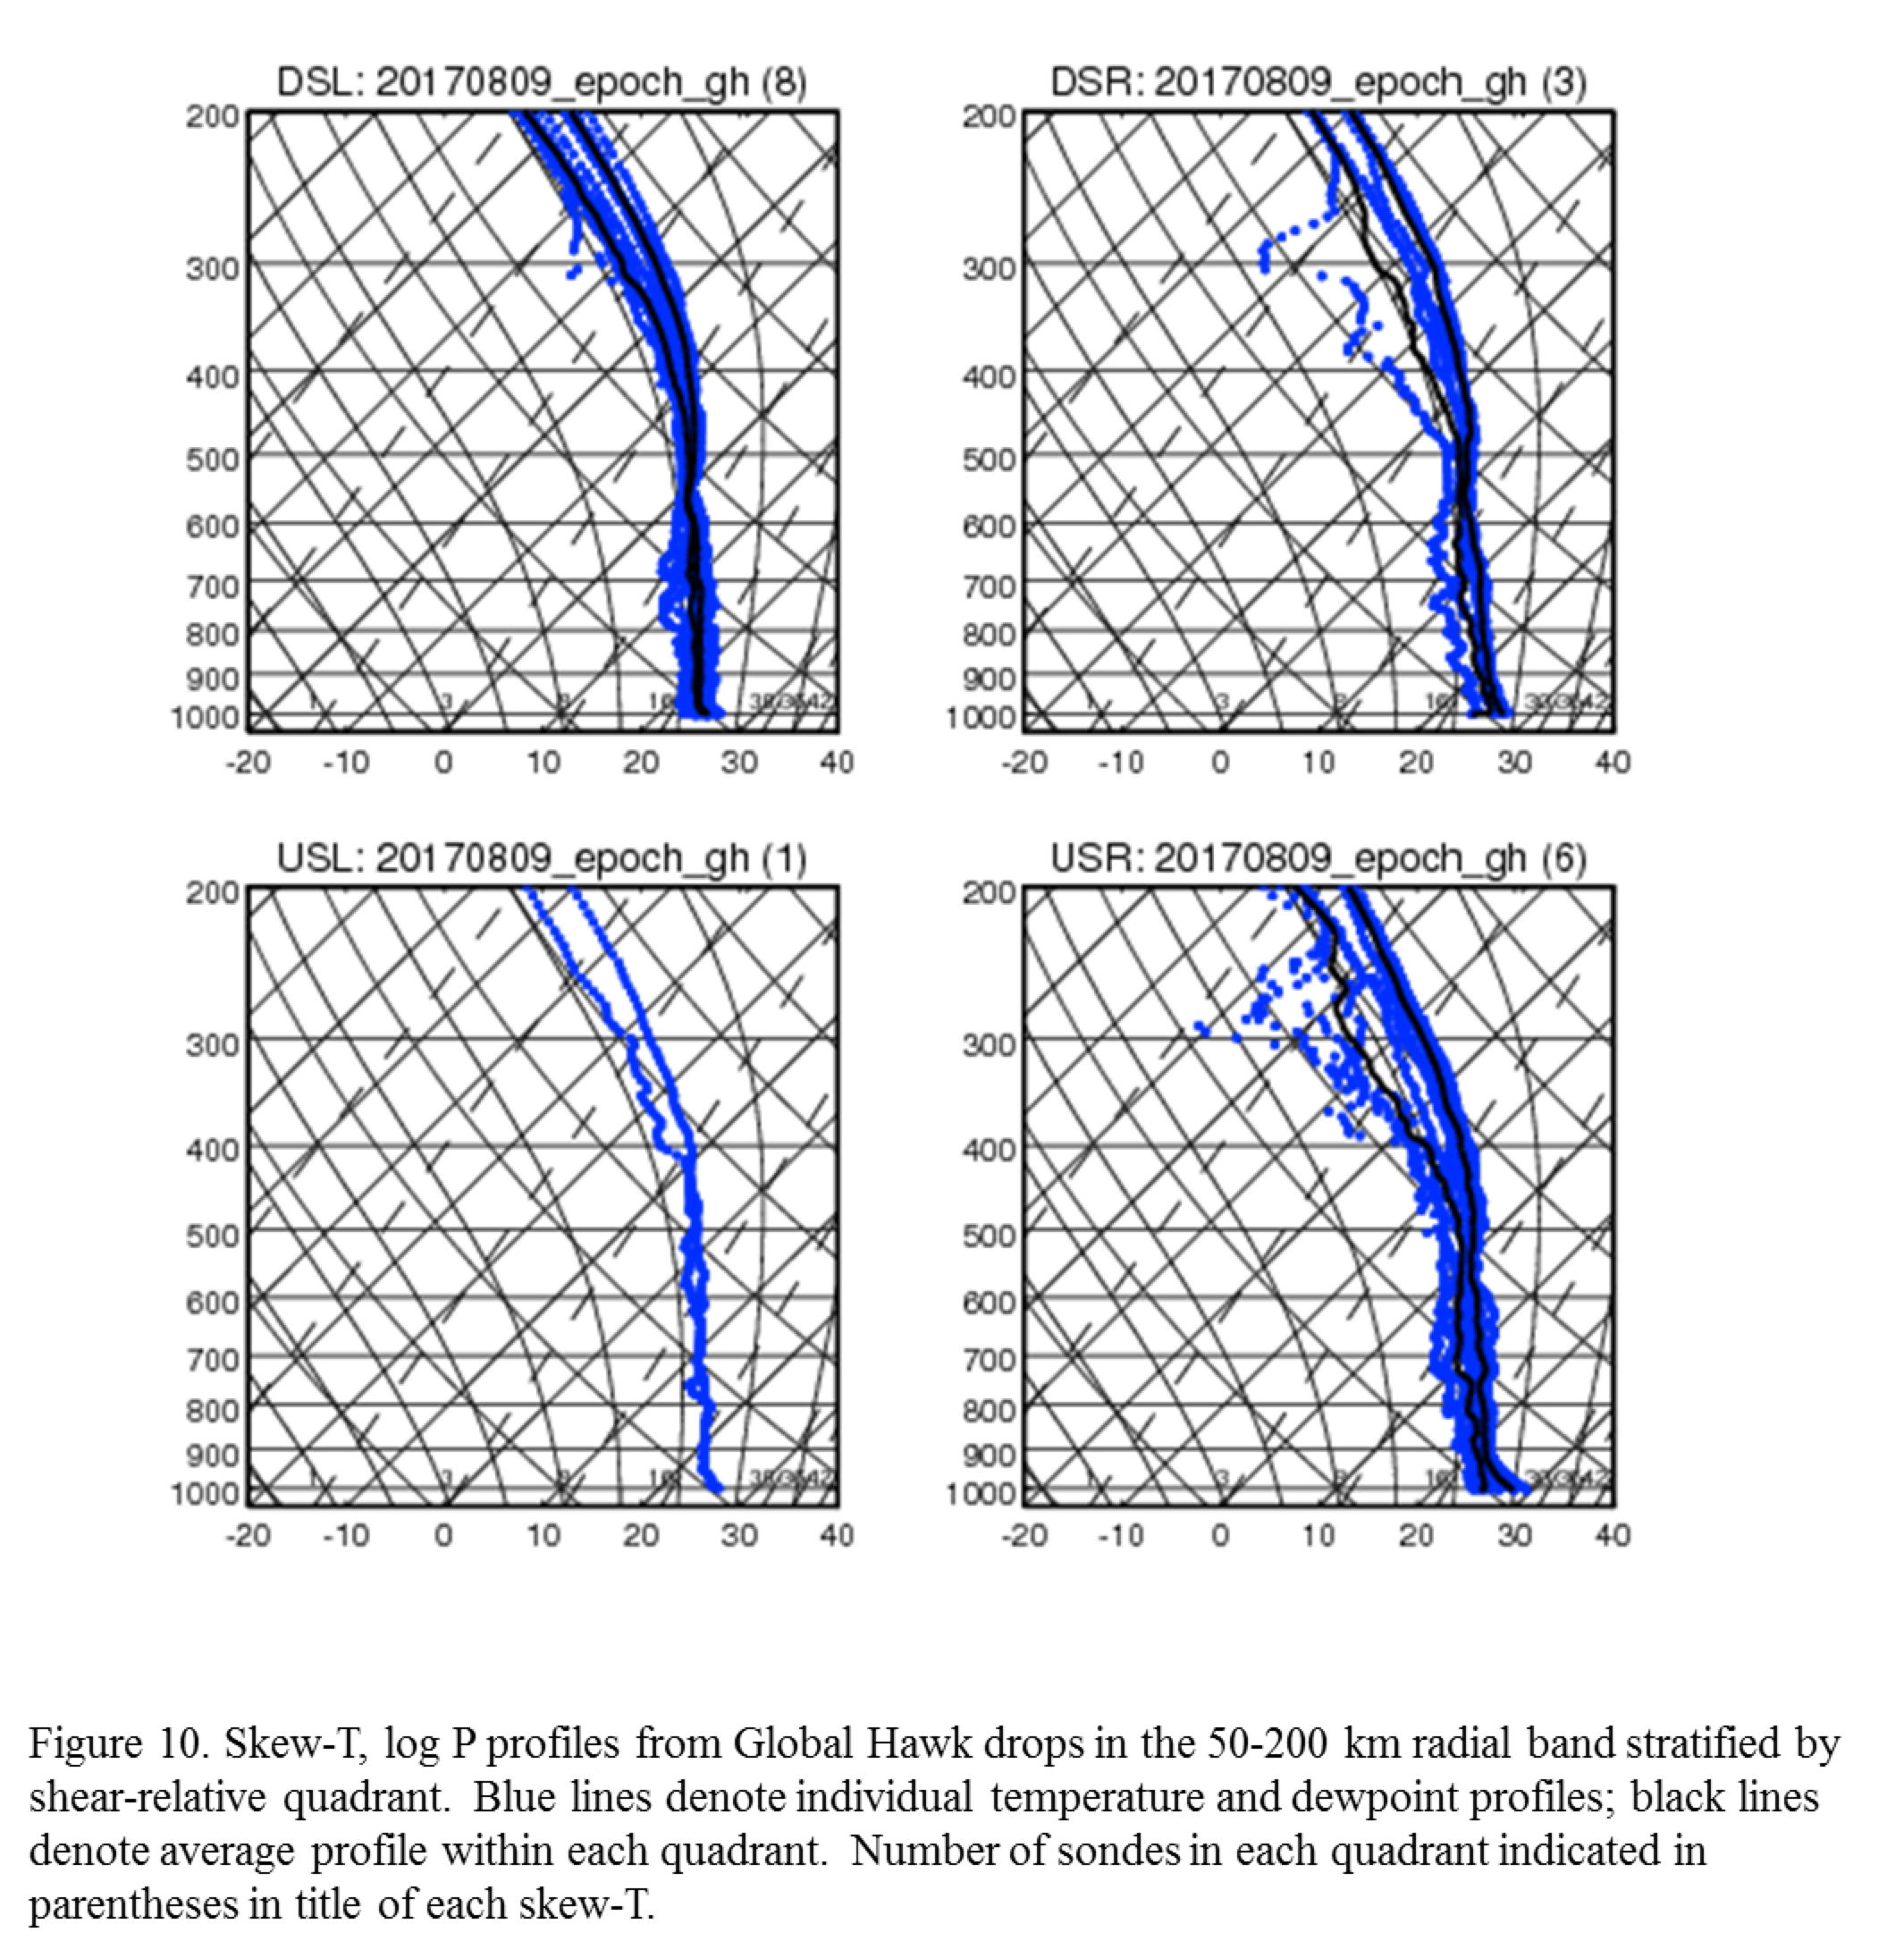
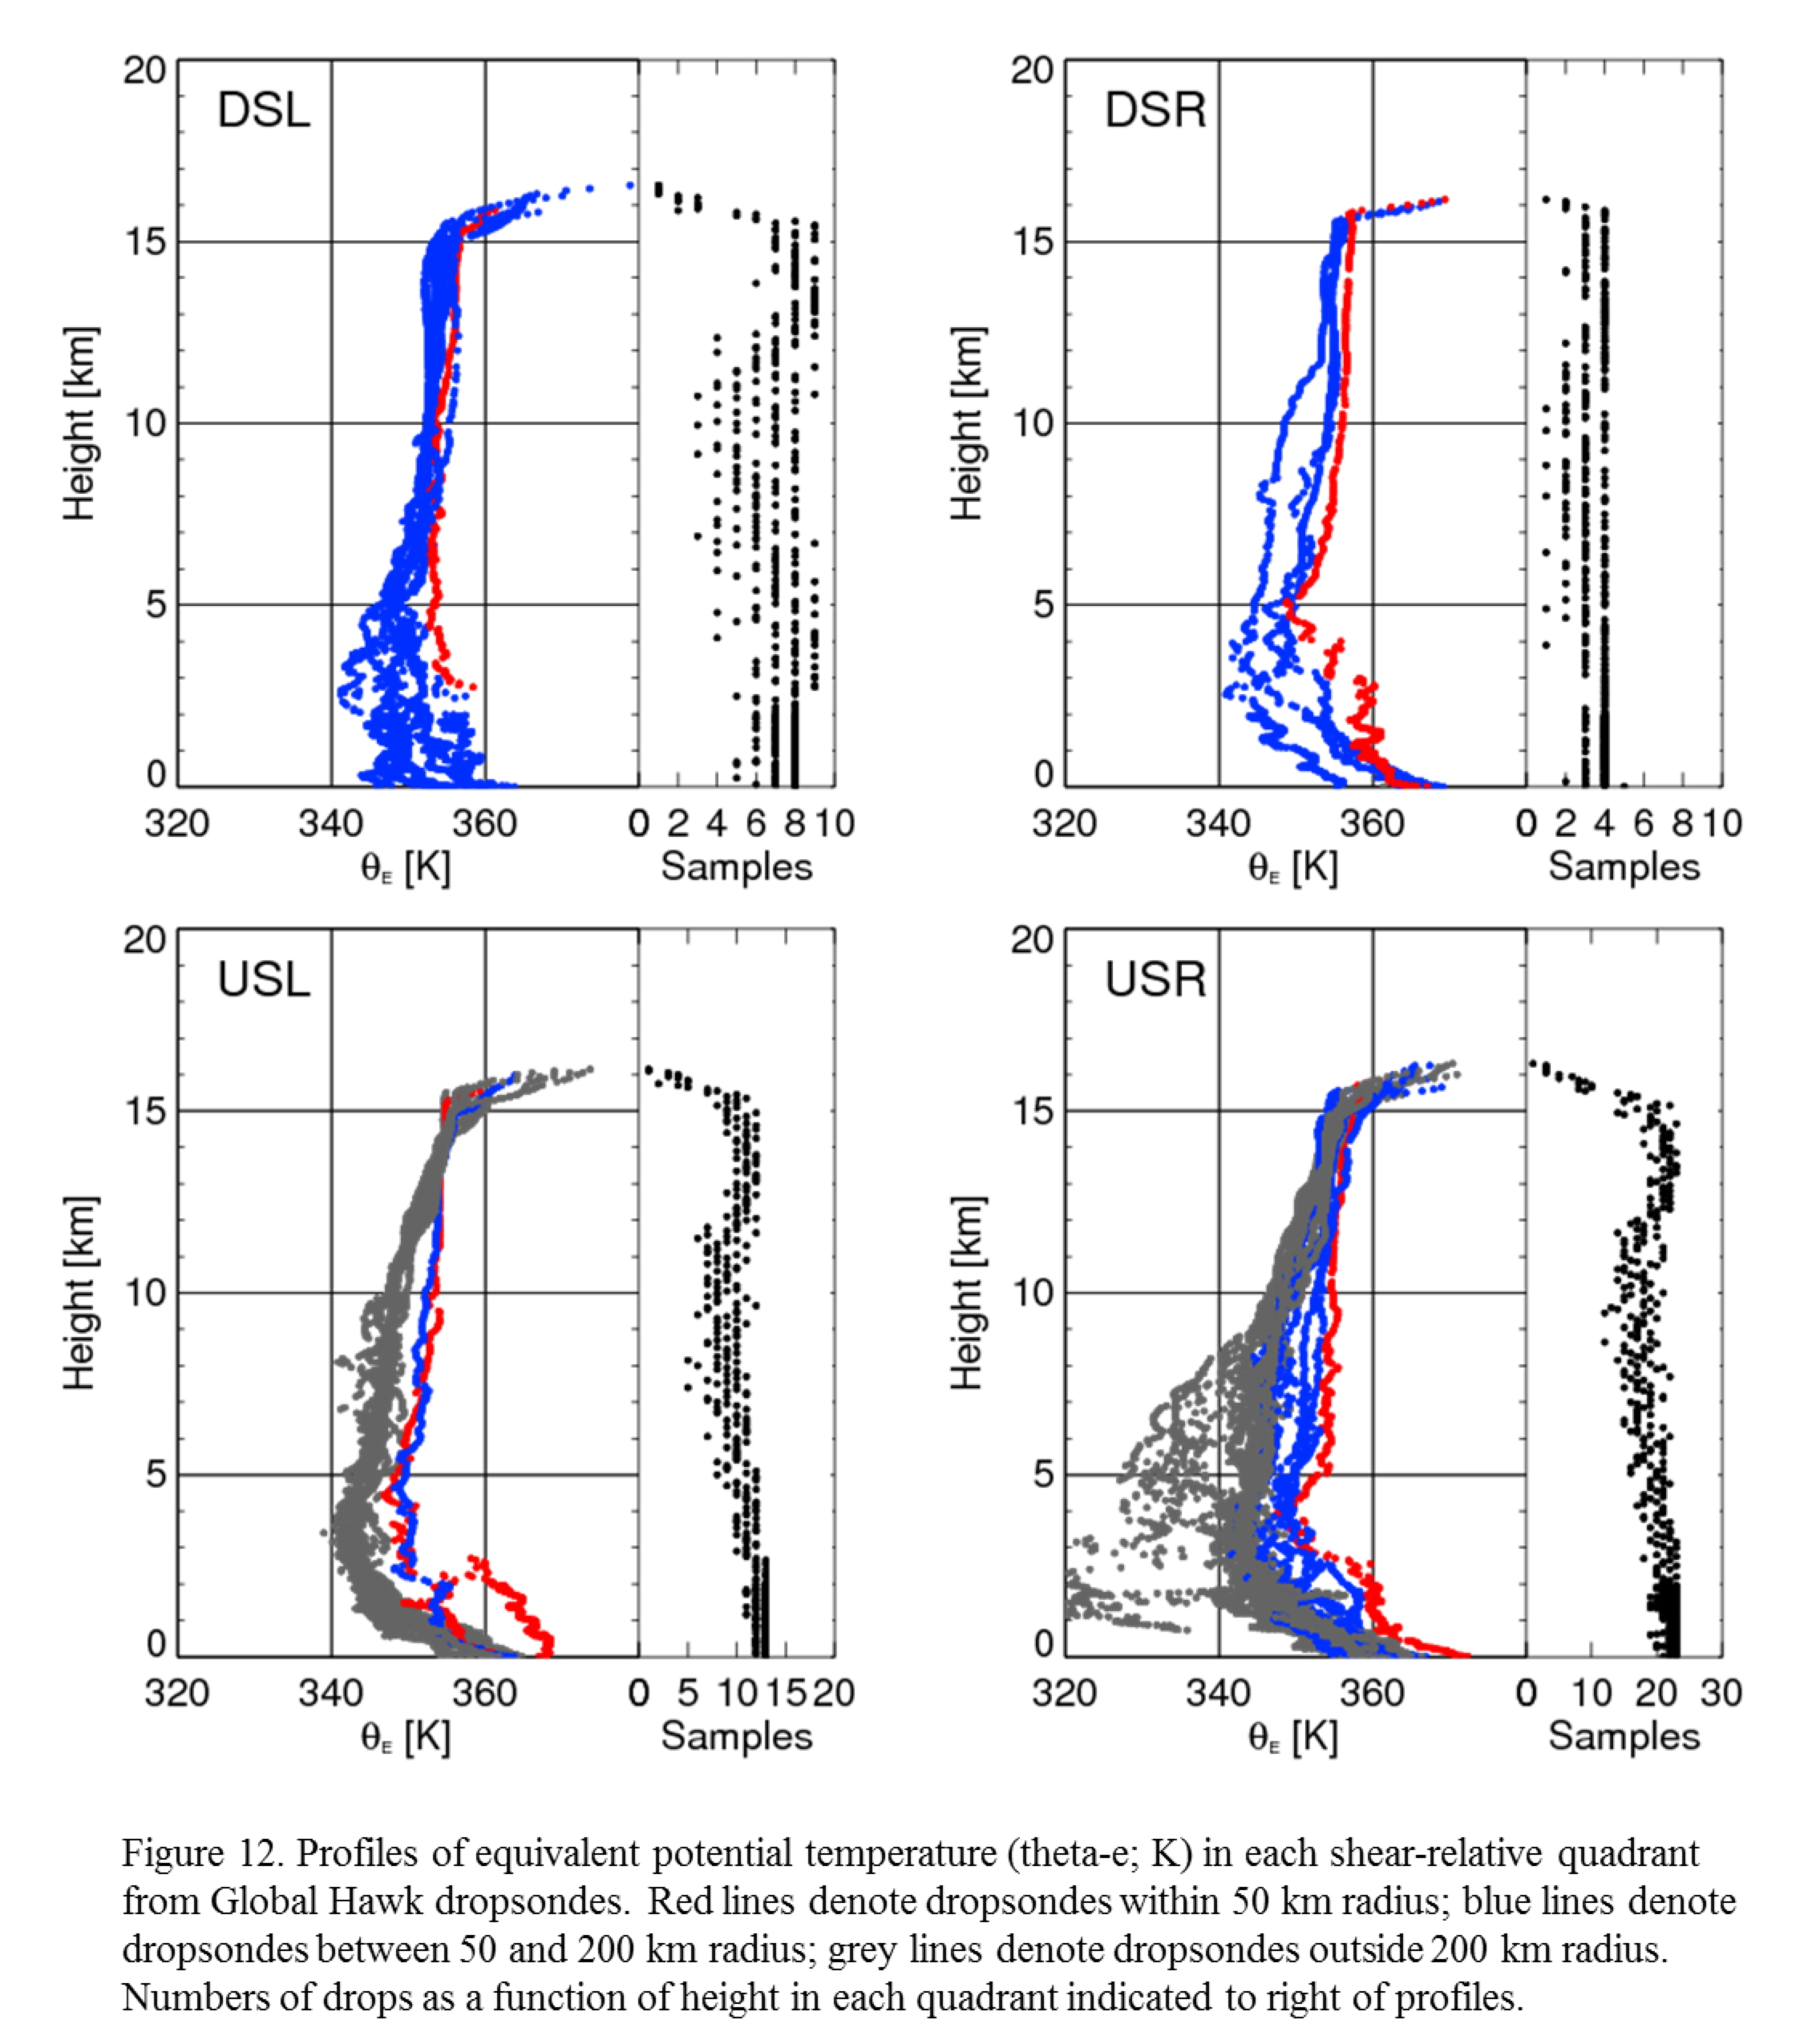
Skew-T, log P diagrams in the near environment (i.e., between 50-200 km radius) in each quadrant (Fig. 10) show that the air was nearly saturated around the storm. The only substantial differences are seen at larger radii (Fig. 11), which show that the air was notably drier USR. Vertical profiles of equivalent potential temperature (Fig. 12) show that, in the near environment, the theta-e values in the lowest 2 km altitude are generally lowest in the DSL quadrant. They are generally highest to the right of shear, i.e., USR and DSR, presumably as the boundary recovers from surface fluxes.
|

|
| |
In general the observations collected here show a tropical storm with a generally symmetric distribution of precipitation and midlevel relative humidity, and deep convection distributed around the storm, particularly upshear. High values of theta-e are seen in the boundary layer in the DSR quadrant. This type of structure is consistent with an intensifying tropical storm, as indicated in recent case studies of Edouard (Zawislak et al. 2016, Rogers et al. 2016) and Bertha and Cristobal (Nguyen et al. 2017).
The aircraft landed at 1609 UTC.
Mission Evaluation :
Three radar analyses were created and transmitted in real time, and 1 dropsonde was released at the center. Four AXBTs were dropped, with two of them providing data. Good coordination was obtained between the WP-3D and Global Hawk during the first inbound leg. In general, this mission was a success.
Problems :
Other than the aforementioned failure of two AXBTs, and some problems in creating radar analyses within 3 km of the aircraft, there were no problems.
Rob Rogers
August 16, 2017
References:
Nguyen, L.T., R.F. Rogers, and P.D. Reasor, 2017: Thermodynamic and kinematic influences on precipitation symmetry in sheared tropical cyclones: Bertha and Cristobal (2014). Mon. Wea. Rev., in press.
Rogers, R.F., J.A. Zhang, J. Zawislak, H. Jiang, G.R. Alvey III, E.J. Zipser, and S.N. Stevenson, 2016: Observations of the structure and evolution of Hurricane Edouard (2014) during intensity change. Part II: Kinematic structure and the distribution of deep convection. Mon. Wea. Rev., 144, 3355-3376.
Zawislak, J., H. Jiang, G.R. Alvey III, E.J. Zipser, R.F. Rogers, J.A. Zhang, and S.N. Stevenson, 2016: Observations of the structure and evolution of Hurricane Edouard (2014) during intensity change. Part I: Relationship between the thermodynamic structure and precipitation. Mon. Wea. Rev., 144, 3333-3354.
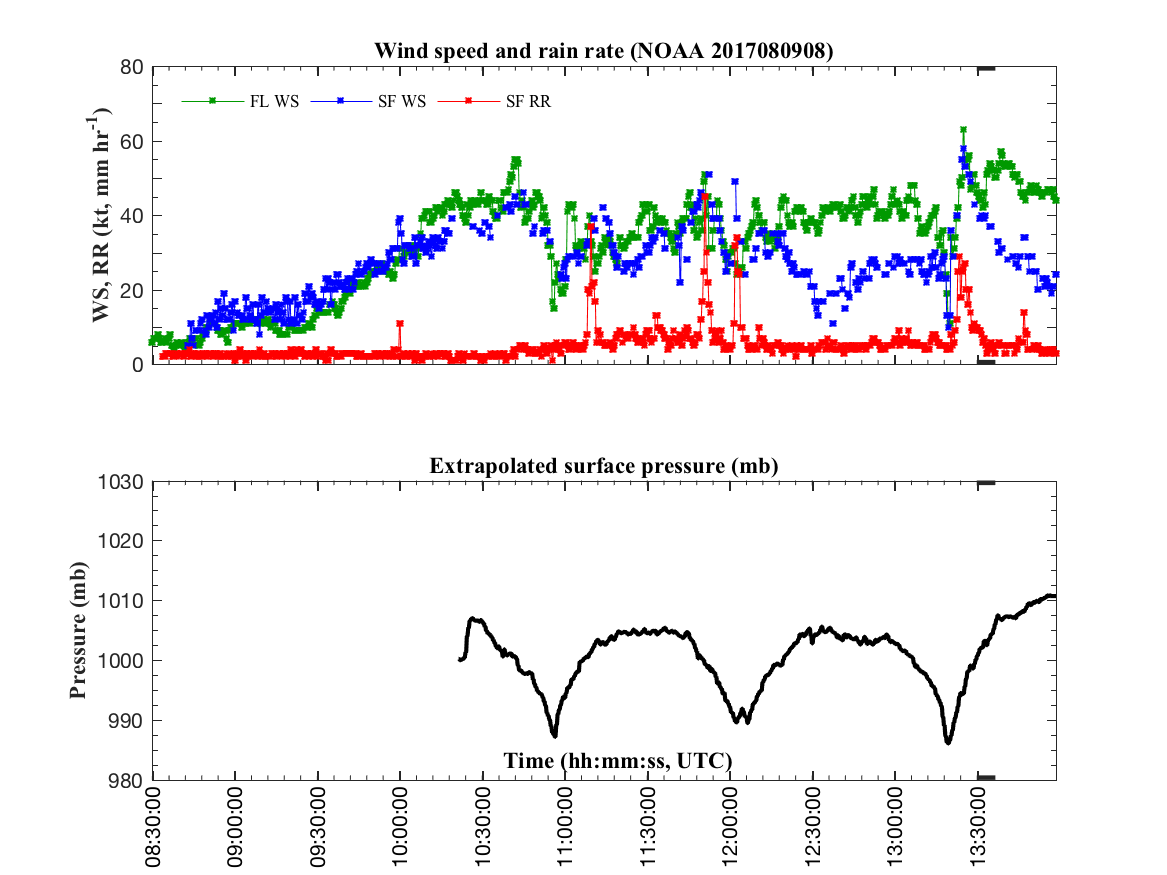
Timeseries wind plots |
|
Flt lvl wind plots |

SFMR wind plots |
 Flight track |
 Temperature and Moisture |
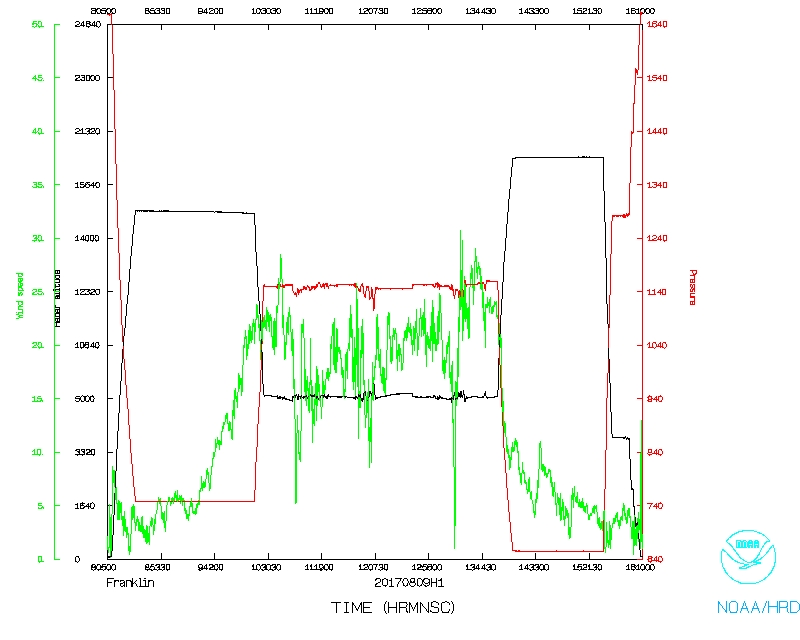 Wind and Atlitude |
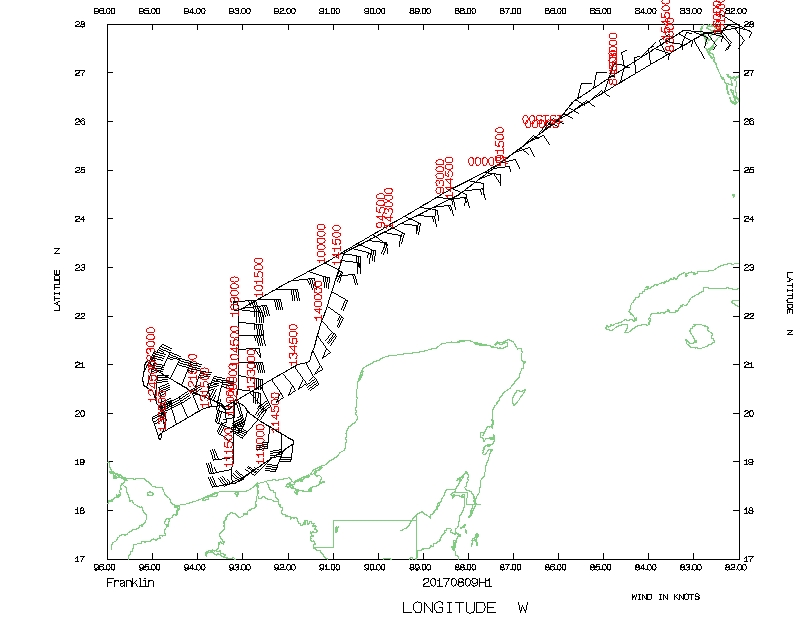
 Flight track detail |
Flight Director's log
Flight Director's manifest |
SFMR data |
NetCDF data |
LPS log | Radar log | Drop log
Radar jobfile Leg #1 10:56:20 Z | Radar jobfile Leg #2 12:04:20 Z | Radar jobfile Leg #3 13:19:34 Z