Mission Summary
20170808H1 Aircraft 42RF
Tropical Storm Franklin (AL07)
Tail Doppler Radar
Aircraft Crew (42RF)
| Aircraft Commander | Scott Price
|
| Co-pilot | Robert Mitchell
|
| Co-pilot | Adam Ruckman
|
| Flight Engineer | Ken Heystek
|
| Flight Engineer | Richard Souza
|
| Navigator | Tim Gallagher
|
| Navigator | Sam Urato
|
| Flight Director | Jack Parrish
|
| Flight Director | Brian Belson
|
| System Engineer | Mike Mascaro
|
| Data Technician | Bobby Peek
|
| Dropsonde Operator | Mac McAlister
|
Scientific Crew (42RF)
| LPS | Jon Zawislak | HRD
|
| Dropsonde | Kathryn Sellwood | HRD
|
| Radar | Jun Zhang | HRD
|
| Guest | Adam Lund | Lakeland Airport
|
Scientific Crew (Ground)
| Radar | Paul Reasor | HRD
|
Mission Plan :
This will be the first tropical cyclone flight from the new AOC facility in
Lakeland, FL. NOAA 42RF (N42) will conduct an EMC-tasked tail Doppler radar
(TDR) mission into Tropical Storm Franklin as it emerges into the Bay of
Campeche after approximately 18 h over the Yucatan Peninsula. N42 will conduct
an abbreviated (due to the Mexican coastline) butterfly pattern at 10 kft.
Dropsondes will be launched at each endpoint in the pattern, as well as the
center (NHC). SHIPS shear as of 1800 UTC: 356°/ 8 kt. The NHC advisory at
5 pm EDT / 2100 UTC: Motion, 290°/ 10 kt; Intensity, 35 kt (40 mph), 1001
mb; Position, 20.0°N / 90.3°W.
TDR MISSION PLAN: Franklin
Prepared by the Hurricane Research Division
August 07, 2017
Aircraft: N42RF
Proposed takeoff: 08/2000Z
|
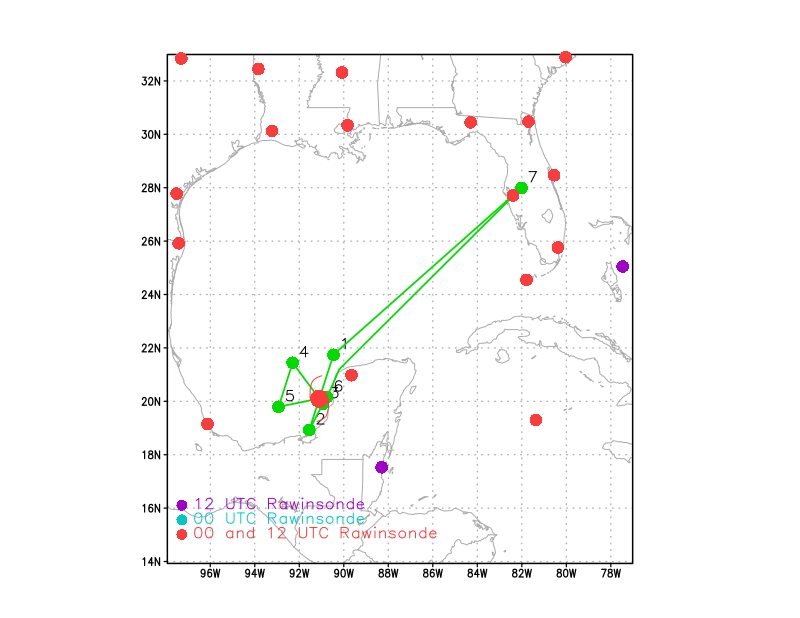
DROP LOCATION TABLE
|
| #
| LAT
| LON
| RAD/AZM
| Time
|
|
| deg min
| deg min
| n mi/deg
| hr:min
| | 1S | 21 45 | 90 28 | 105/020 | 1:50
| | 2S | 18 56 | 91 33 | 75/200 | 2:36
| | 3S | 19 55 | 90 56 | 15/140 | 2:54
| | 4S | 21 27 | 92 18 | 105/320 | 3:24
| | 5S | 19 48 | 92 56 | 105/260 | 3:52
| | 6S | 20 09 | 90 45 | 20/080 | 4:23
| |
Mission Summary :
| Take off
| Landing
| Linder-Lakeland Airport, FL
| 22:00 UTC
| Linder-Lakeland Airport, FL
| 04:37 UTC
| | Penetrations
| 3
| |
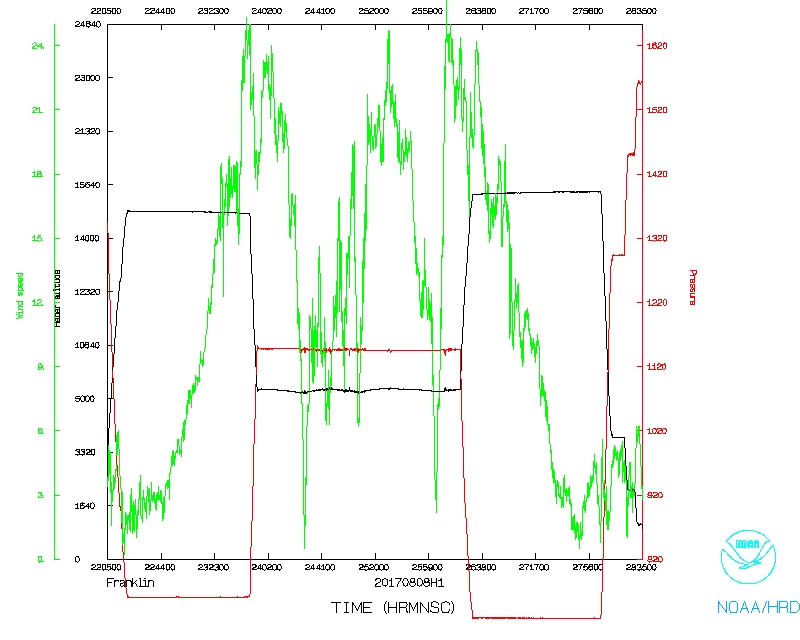
The NHC advisory at 5 pm EDT indicated that TS Franklin was 1001 mb, with a
maximum sustained wind speed of 35 kt, and was moving 290° at 10 kt.
Franklin was over the Yucatan Peninsula during the previous 18 h. The forecast
was for possible rapid intensification, with Franklin reaching hurricane
strength in the next 24 h. Some strengthening was expected during the mission
as Franklin proceeded into the Bay of Campeche, given that environment was
quite favorable for intensification: warm SSTs, near 30°C, and relatively
low 850-200 hPa deep-layer vertical wind shear (8 kt / 356°),
according to SHIPS.
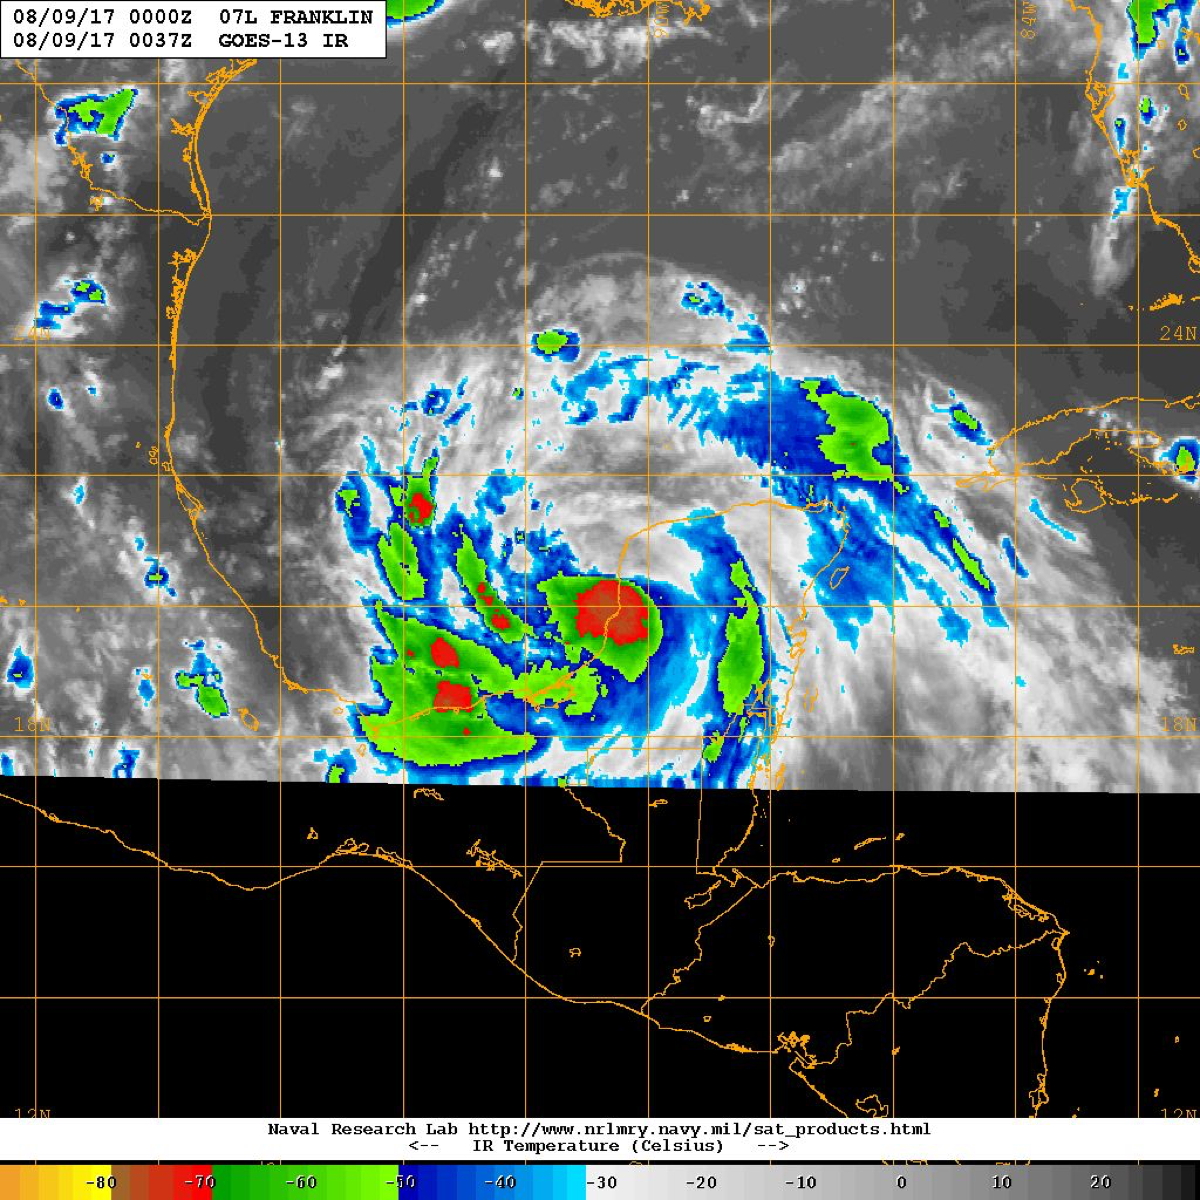
Figure 1. GOES IR imagery at 9 September 0037 UTC.
|
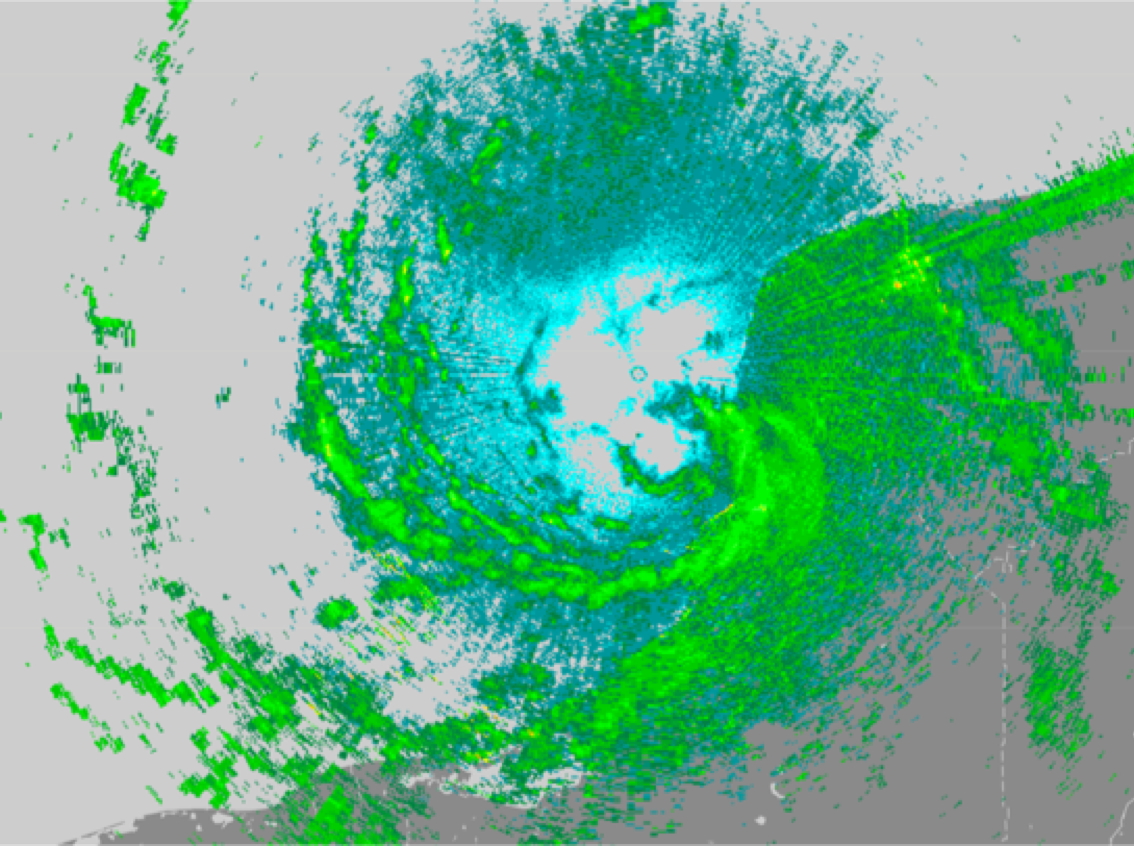
Figure 2. LF imagery at 0022 UTC.
|
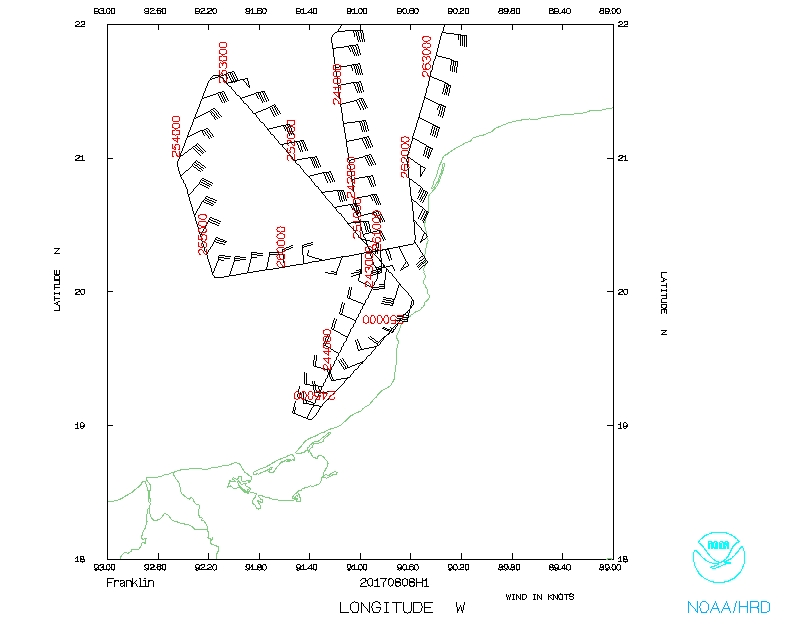
On the transit, we were informed that WP #5 might not be possible given its
location within a military warning area. Although we developed an alternative
plan for that possibility, AOC was later able to get us clearance into that
area and we were able to proceed as originally planned. Upon reaching the IP
(at around 0003 UTC), the estimated position from the 2330 UTC fix from the
USAF was 20.06°N / 90.82°W. This position placed the center of TS
Franklin just off the coast of the Yucatan Peninsula, slightly east of the
estimated position in the plan. The IR satellite presentation for the first
center pass (Fig. 1, 9 August 0037 UTC) indicated that the inner core
convective/precipitation area was asymmetric with convection predominantly
located in the downshear quadrants. Conditions inbound (from north to south)
from the IP to the center was predominantly clear at flight level with visible
low-level stratus (likely at the top of the marine layer) and some
precipitating anvil above. We proceeded to do a center fix, with a position of
20.11°N / 90.85°W at 0028 UTC. Only moderately deep congestus clouds
(~ 6 km) were observed near the center to the north, with little precipitation
present (LF image, Fig. 2). We exited to the southwest (downshear), where we
encountered some precipitation and echo tops above 14 km (20-dBZ echo top was
closer to 11 km) between the center and WP #2 (reached around 0046 UTC). This
completed the first TDR analysis (Fig. 3), and there were 3 drops (IP, center,
and WP #2) and 2 AXBTs (IP, WP #2). The AXBT at the IP did not report data
until 150 m and the one at WP #2 was not responsive.
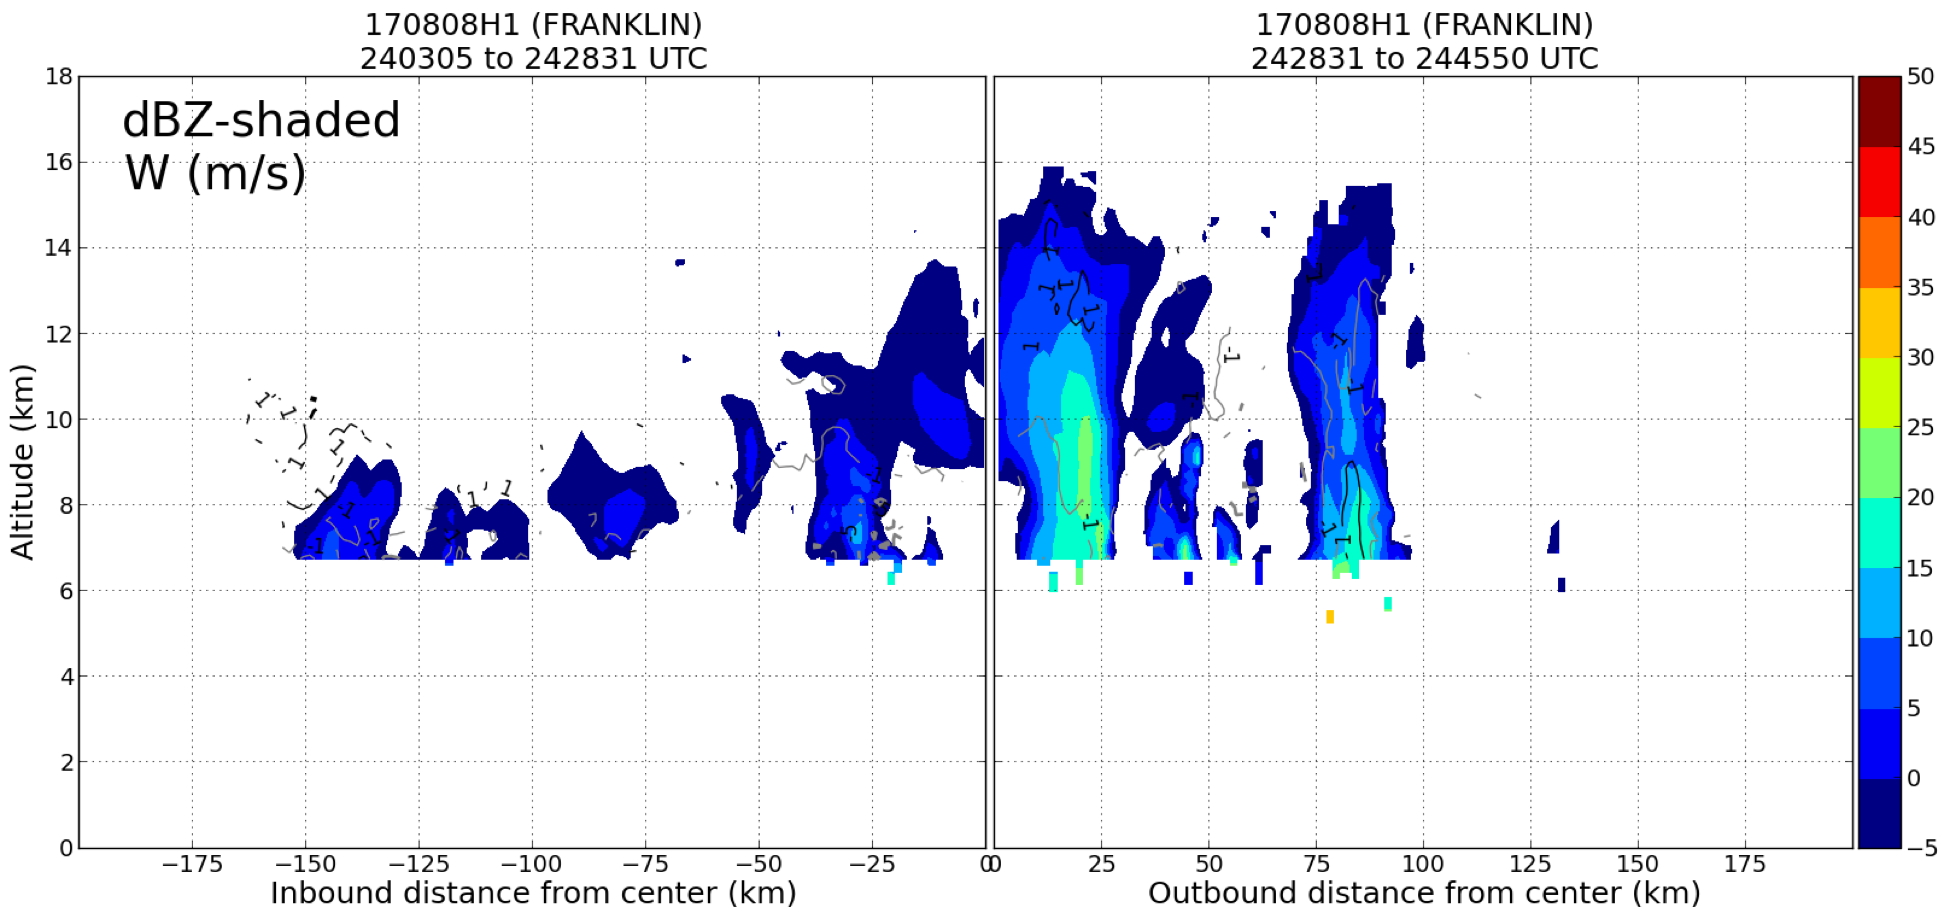
Figure 3. TDR vertical profile analysis of reflectivity (shaded, dBZ) and
vertical velocity (contoured, m s-1) for the first pass (between IP and WP #2),
centered at 0028 UTC.
|
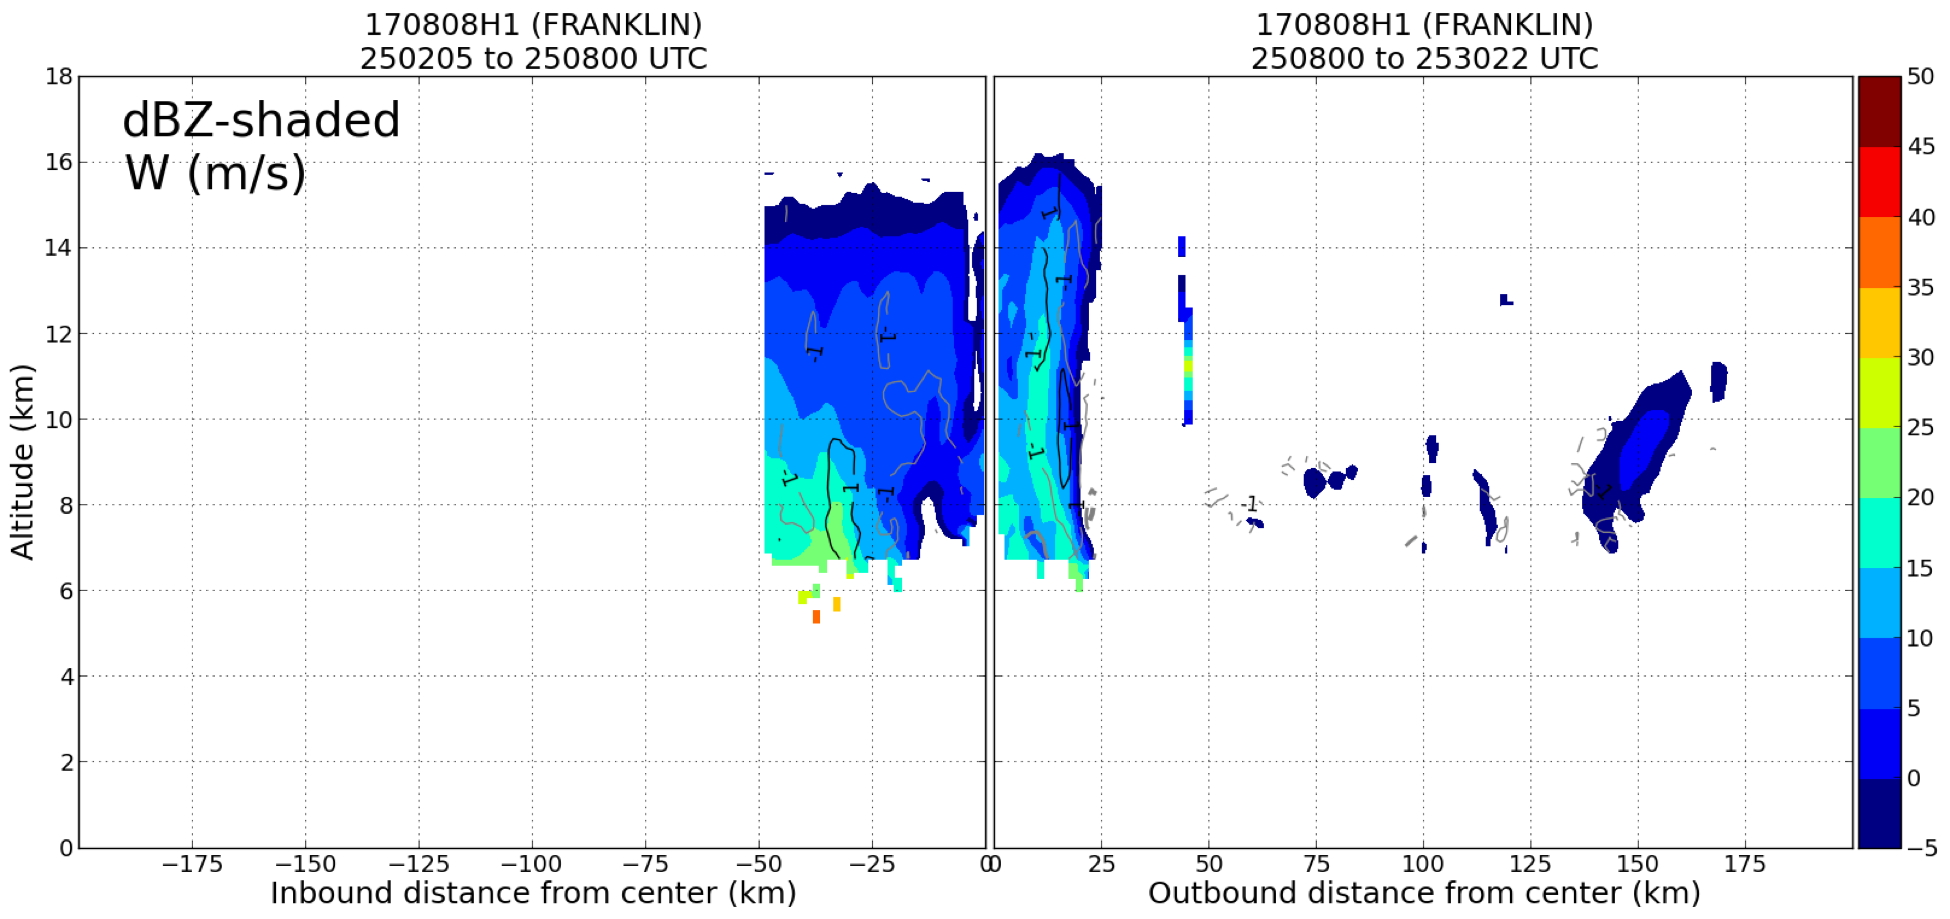
Figure 4. TDR vertical profile analysis of reflectivity (shaded, dBZ) and
vertical velocity (contoured, m s-1) for the second pass (between WP #3 and WP
#4), centered at 0108 UTC.
|
Since we received clearance to enter Mexican airspace, we were able to proceed
on a short downwind (in the downshear left quadrant) along the coast to WP #3
(reached around 0102 UTC) encountering some convection and precipitation. Given
its close proximity to the center, we opted not to drop at the turn at WP #3
and only drop at the center. We were able to proceed on a short inbound along
140° radial to the center, and outbound on 320° for 105 nmi to complete
the second TDR analysis (Fig. 4). We did not do a center fix, but did a close
approach with a center position estimate of 20.30°N / 90.90°W at 0108
UTC. On the outbound (in the upshear right quadrant) to WP #4, there was still
no deep, precipitating cloud. A dropsonde/AXBT combo was launched at WP #4 at
0130 UTC, with good reporting from the BT, unlike the previous two launches.
We proceeded downwind to WP #5 (another good dropsonde/AXBT combo about 0150
UTC); however, we had to deviate eastward for deep convection in an outerband
along the flight track. Numerous convective banding was observed in this region
west of the center (right of shear quadrants). This deviation led us to have a
shortened, approximately 80 nmi, inbound on the 260° radial. We once again
did a close approach of the center (appeared to pass just south), with an
approximate center position of 20.23°N / 91.20°W at 0204 UTC. The
convection on the southern and eastern side of the center (downshear and
upshear left) was noticeably stronger in both the LF (Fig. 5) and TDR (Fig. 6).
The TDR indicated echo tops to 16 km (20-dBZ echo top was as high as 14-15 km).
Between our first pass (0028 UTC) and final pass (0204 UTC), a more intense,
pronounced partial eyewall had developed on the east and south (left of shear)
sides of the center as it proceeded farther over water). A short outbound on
080° (cut off by the Mexican coast) to WP #6 ended the third TDR analysis
and overall pattern (as with WP #3, there was no dropsonde at WP #6 given its
close proximity to the center drop).
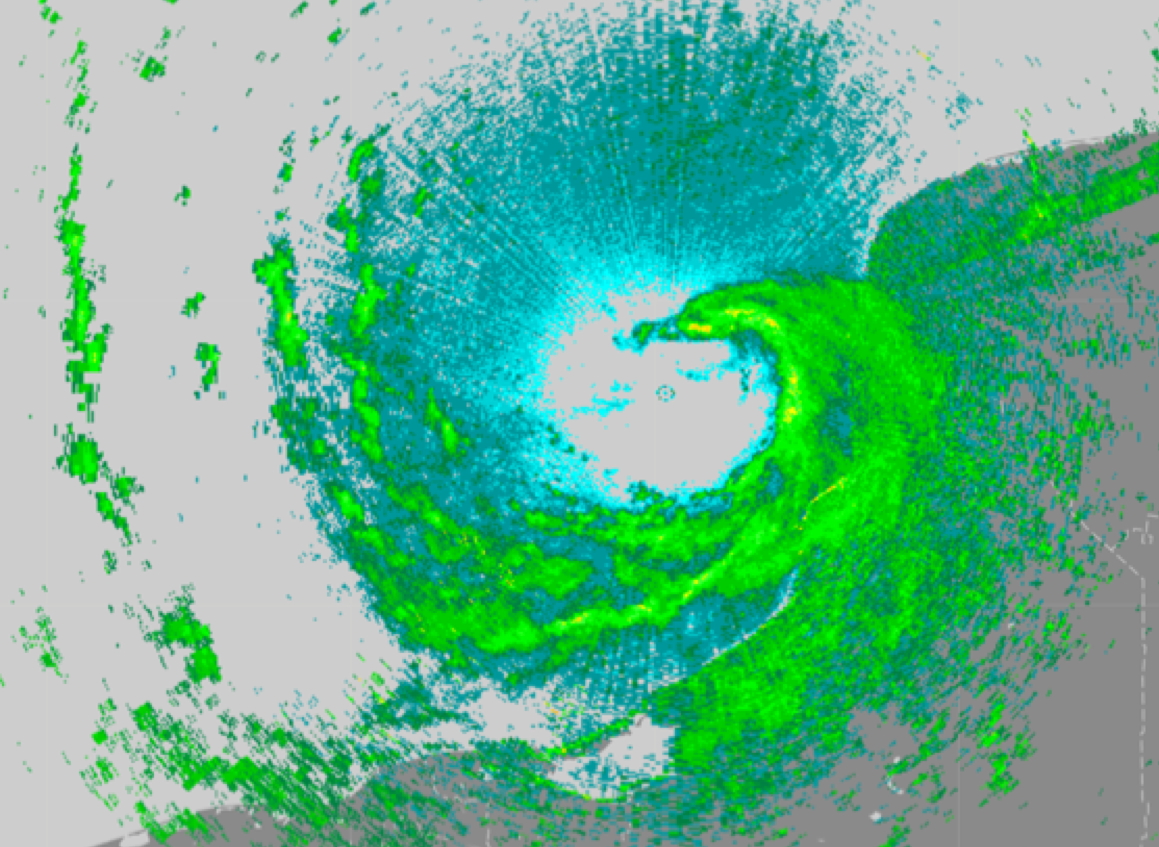
Figure 5. LF imagery at 0203 UTC.
|
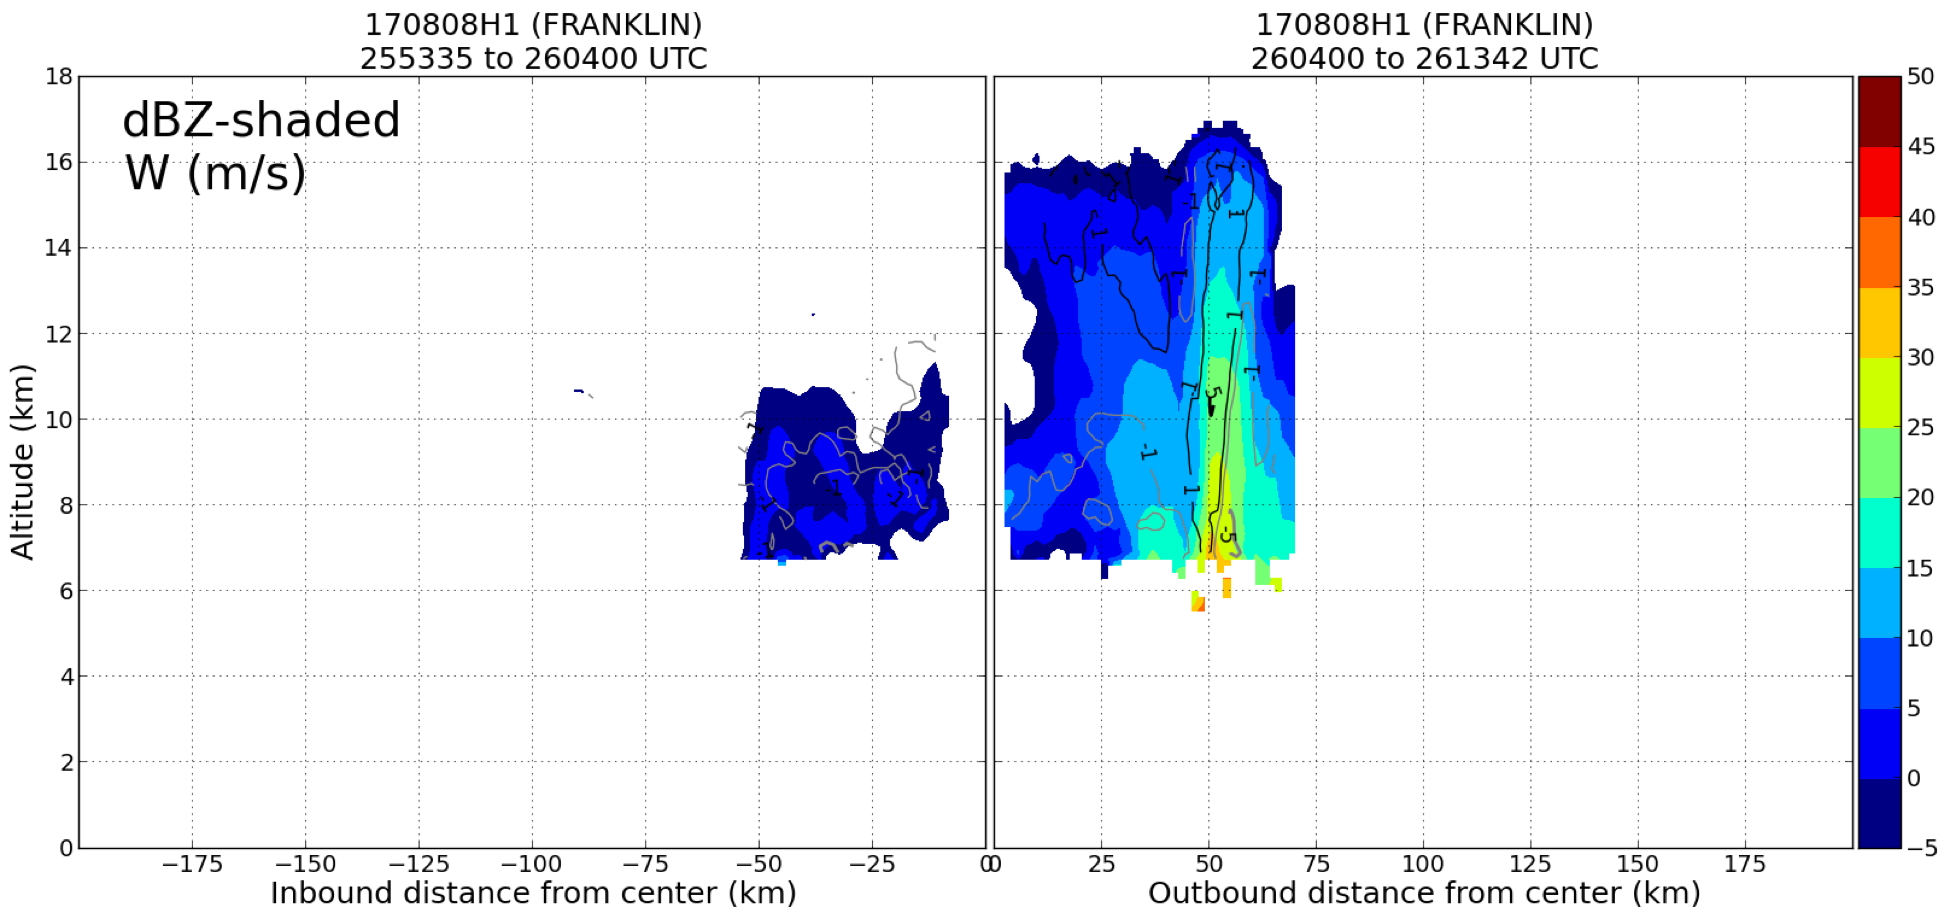
Figure 6. TDR vertical profile analysis of reflectivity (shaded, dBZ) and
vertical velocity (contoured, m s-1)
for the third pass (between WP #5 and WP
#6), centered at 0204 UTC.
|
Upon leaving the storm, the NHC advisory at 11 pm EDT indicated Franklin was
996 mb and 50 kt, so the storm did intensify and all indications were that this
flight could be considered as sampling the onset of a rapid intensification
event in Franklin. The deep-layer vertical wind shear was still somewhat low
(8-10 kt), and deep convection in the inner core was wrapping around upshear
left (so an increase in azimuthal coverage, at least near the center). It
appears that the only inhibitor would be somewhat dry air to the north of
Franklin, as indicated in the soundings at the IP and WP #4 (Figs. 7, 8); both
suggest subsidence at 850 mb.
Expendables: 7 Dropsonde (4 HFIP, 3 NHC), 4 AXBTs
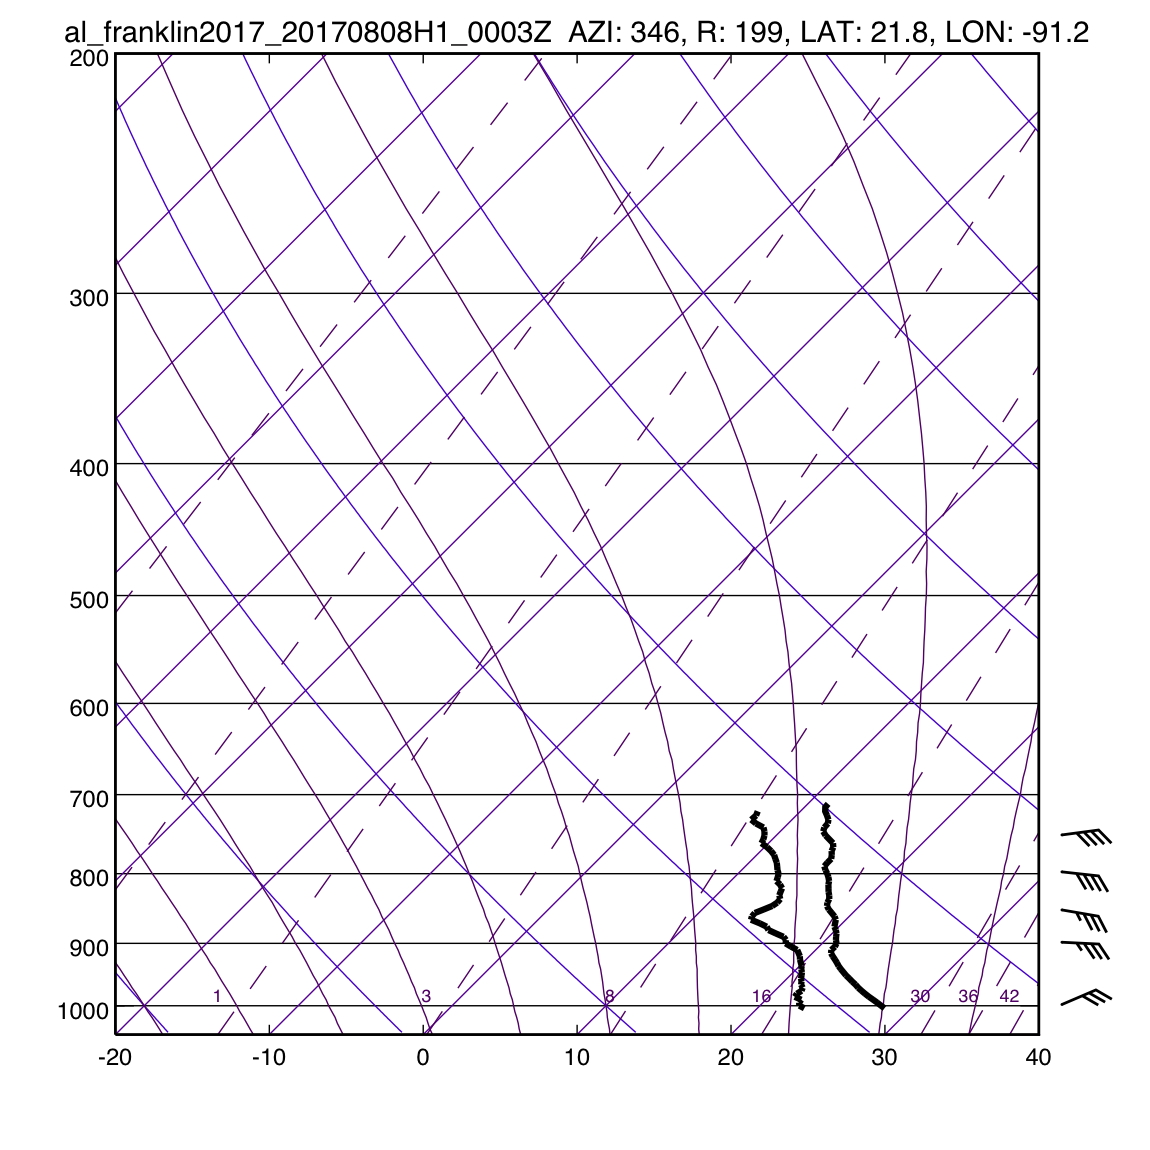
Figure 7. Skew-t diagram for the dropsonde at the IP at 0003 UTC.
|
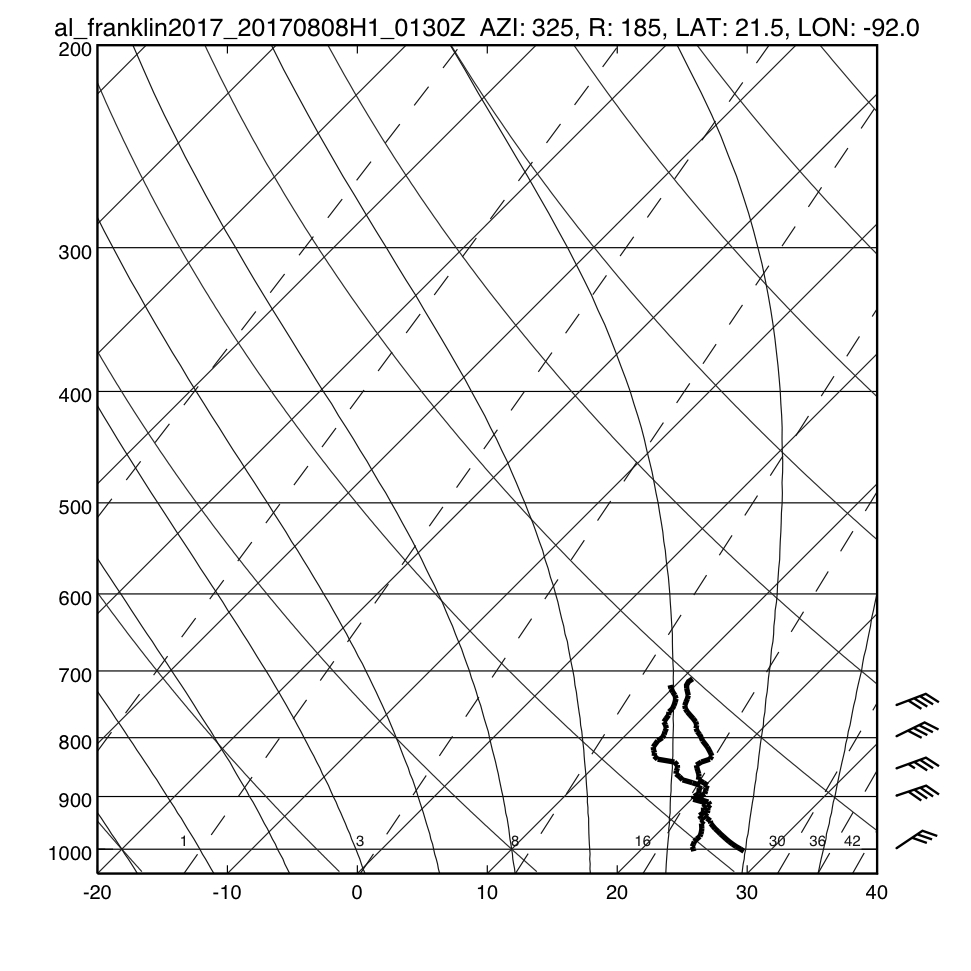
Figure 8. Skew-t diagram for the dropsonde at WP #4 at 0103 UTC.
|
Problems :
There were issues related to missing data in the TDR 3D analyses, such that
there was no data within 3 km of flight level (see Figs. 3, 4, 6). Paul Reasor
was the ground radar scientist, and with help from John Gamache, John Hill, and
Jun, those issues were worked on during and after the mission. TDR data was,
however, still delivered to EMC for the 00Z cycle. 5 out of 7 dropsondes had an
incorrect pressure correction applied (default factory correction was applied)
that led to bad height estimates and, subsequently, too low of surface
pressures (about 5-6 mb lower in the center than fixes from the USAF). In the
future, we should check with the AVAPS operator to ensure that the correct
pressure offsets are applied. Also, 2 out of the 4 AXBTs provide little to no
data, which was blamed on their age.
Jon Zawislak
Aug. 15, 2017
Mission Data :
LPS log |
Radar log |
Drop log |
Flight Director's log |
Flight Director's manifest
NetCDF data |
serial data |
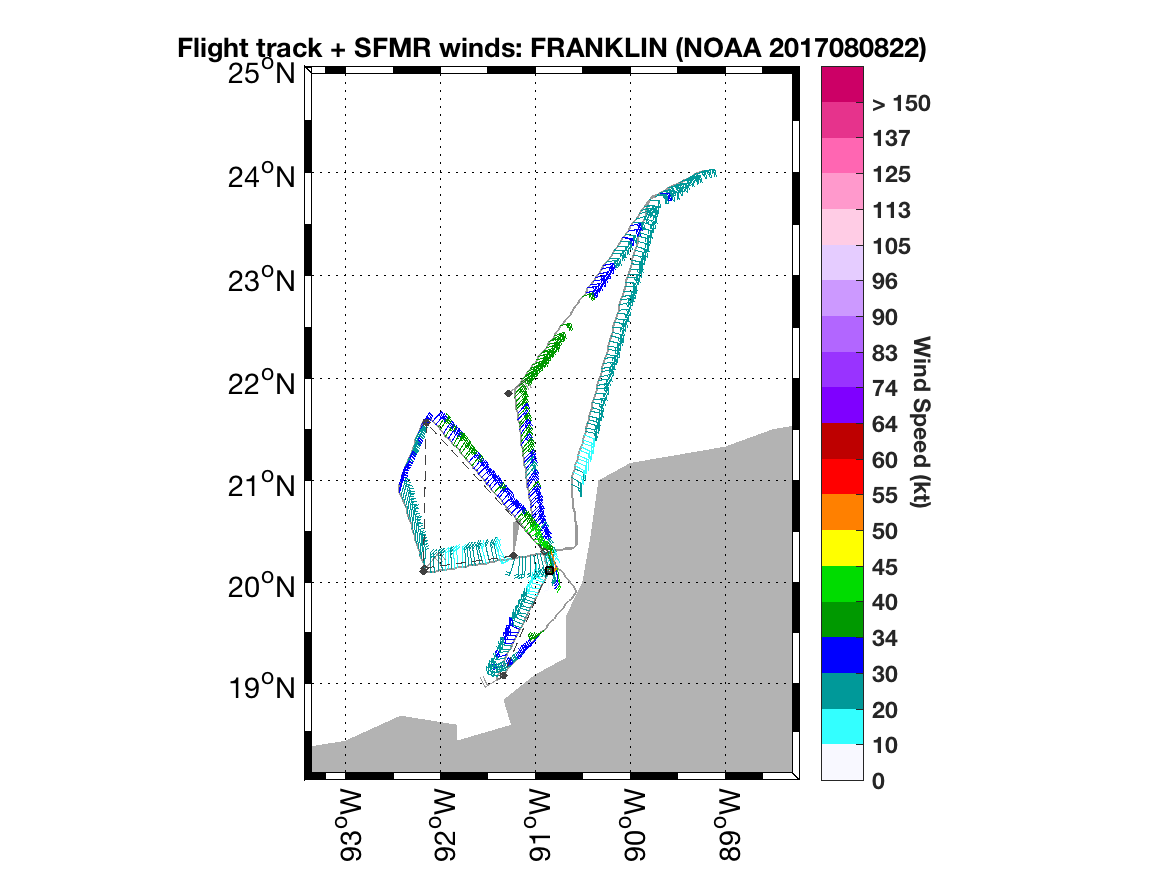
SFMR data
Radar jobfile Leg #1 24:28:31 Z |
Radar jobfile Leg #2 25:08:00 Z |
Radar jobfile Leg #3 26:04:00 Z
Page last updated Oct. 30, 2017
Return to Mission page.