Figure 1. Proposed combination Figure-4/box-spiral pattern for 070901H. Black circles denote GPS dropsonde locations.
| LPS/Doppler/dropsonde Scientist | Rob Rogers |
| Doppler/dropsonde Scientist | Sim Aberson |
| Pilots | Tom Strong Carl Newman |
| Flight Director | Tom Shepherd |
| Navigator | Tim Gallagher |
| Flt. Eng. | |
| Data Tech | Sean McMillan |
| Elec. Tech | Bill Olney John Hill |
Mission Plan :
This was a single-plane NCEP-tasked 3-D Doppler winds mission into Hurricane Felix, which was a strong tropical storm at takeoff. The plan for collecting Doppler radar in all quadrants of the developing hurricane to be used for the development of Doppler radar assimilation techniques for the HWRF model. The aircraft was to sample the core for the 00 UTC synoptic time. As a part of this effort, we decided to test different flight sampling strategies to try to determine optimal sampling patterns for Doppler winds. To this end, the pattern called for an initial Figure-4 pattern, with an IP 85 nm from the center (Fig. 1). The Figure-4 pattern would end on the southwest side of the storm. From that point N42 would track inbound and set up 28 nm southeast of the center. From there the aircraft would fly a box pattern around the inner core. The box would have equal sides of 40 nm length, centered on the storm. At the end of this box, on the southeast side, the aircraft would continue tracking 090 to a point 60 nm from the corner of the inner box. It would then fly another box pattern, with a box size of 120 nm, centered on the storm. Sondes would be dropped every 40 nm along both boxes, and at the center points during the two passes of the Figure-4. The aircraft would fly at 8000 ft.
Mission Summary :
Takeoff from St. Croix was at 1955 UTC. Felix was located about 100 nm north of the coast of Venezuela at the time of takeoff. It was moving just north of due west with a translational speed of about 16 kt. The storm had continued to slowly become better organized throughout the day. Infrared imagery (Fig. 2) shows cold cloud tops (< -70 C) near the circulation center,
while 85 GHz TRMM microwave imagery (Fig. 3) shows low brightness temperatures, indicative of ice scattering and deep convection, primarily on the south and east side of the storm. The large-scale environment was favorable for continued intensification , with weak 850-200 hPa vertical shear (< 10 kt) in an anticyclonic pattern displaced just to the west of the storm (Fig. 4).
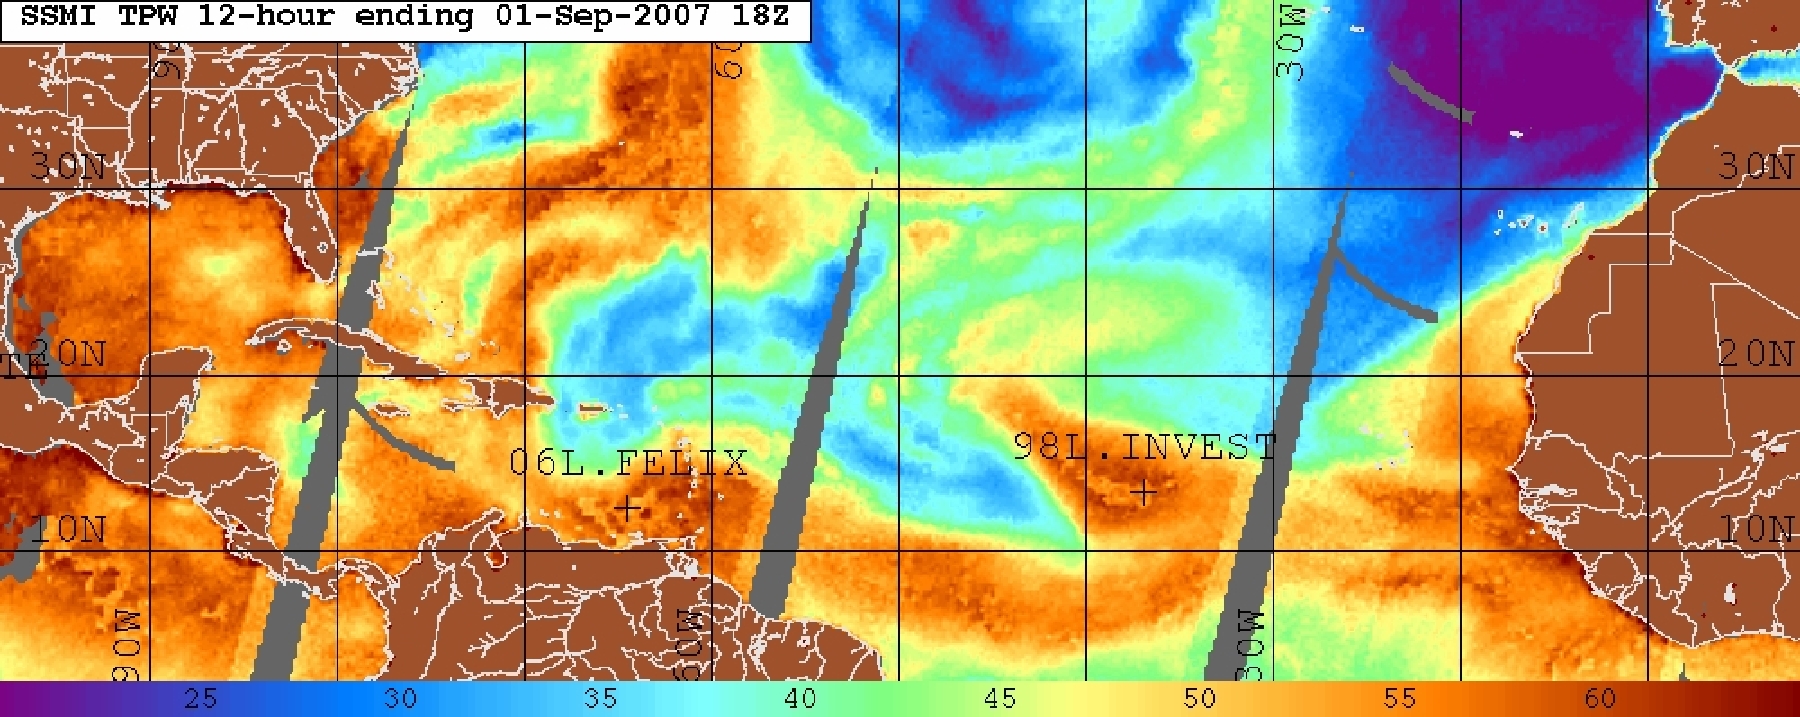
Total precipitable water (TPW) fields (Fig. 5) showed that, while there was a region of low TPW extending along the north and northwest side of Felix, the environment to the west of Felix was moist. This indicates that there would be ample moisture for Felix as it continued to track generally toward the west.
Upon reaching the IP on the northwest side, it was clear that there was no real banding features in this quadrant. However, a well-defined inner core was evident on the lower fuselage (LF) imagery. As the aircraft approached the eye, the LF showed a band of solid 40 dBZ reflectivity on the southwest side of the center. For the first pass, the peak flight-level winds were 60 (50) kt, while the peak surface winds were 40 (50) kt on the northwest (southeast) side, indicating an azimuthal asymmetry and a rotation of the asymmetry with altitude . The central pressure from the sonde was 996.2 hPa, though that was with 30 kt winds at the surface. The strong winds at the surface, with very light winds at flight level, also indicates a system that is tilted in the vertical. These observations suggest that Felix may have been experiencing stronger vertical shear than was being indicated by the large-scale analyses (cf. Fig. 4).
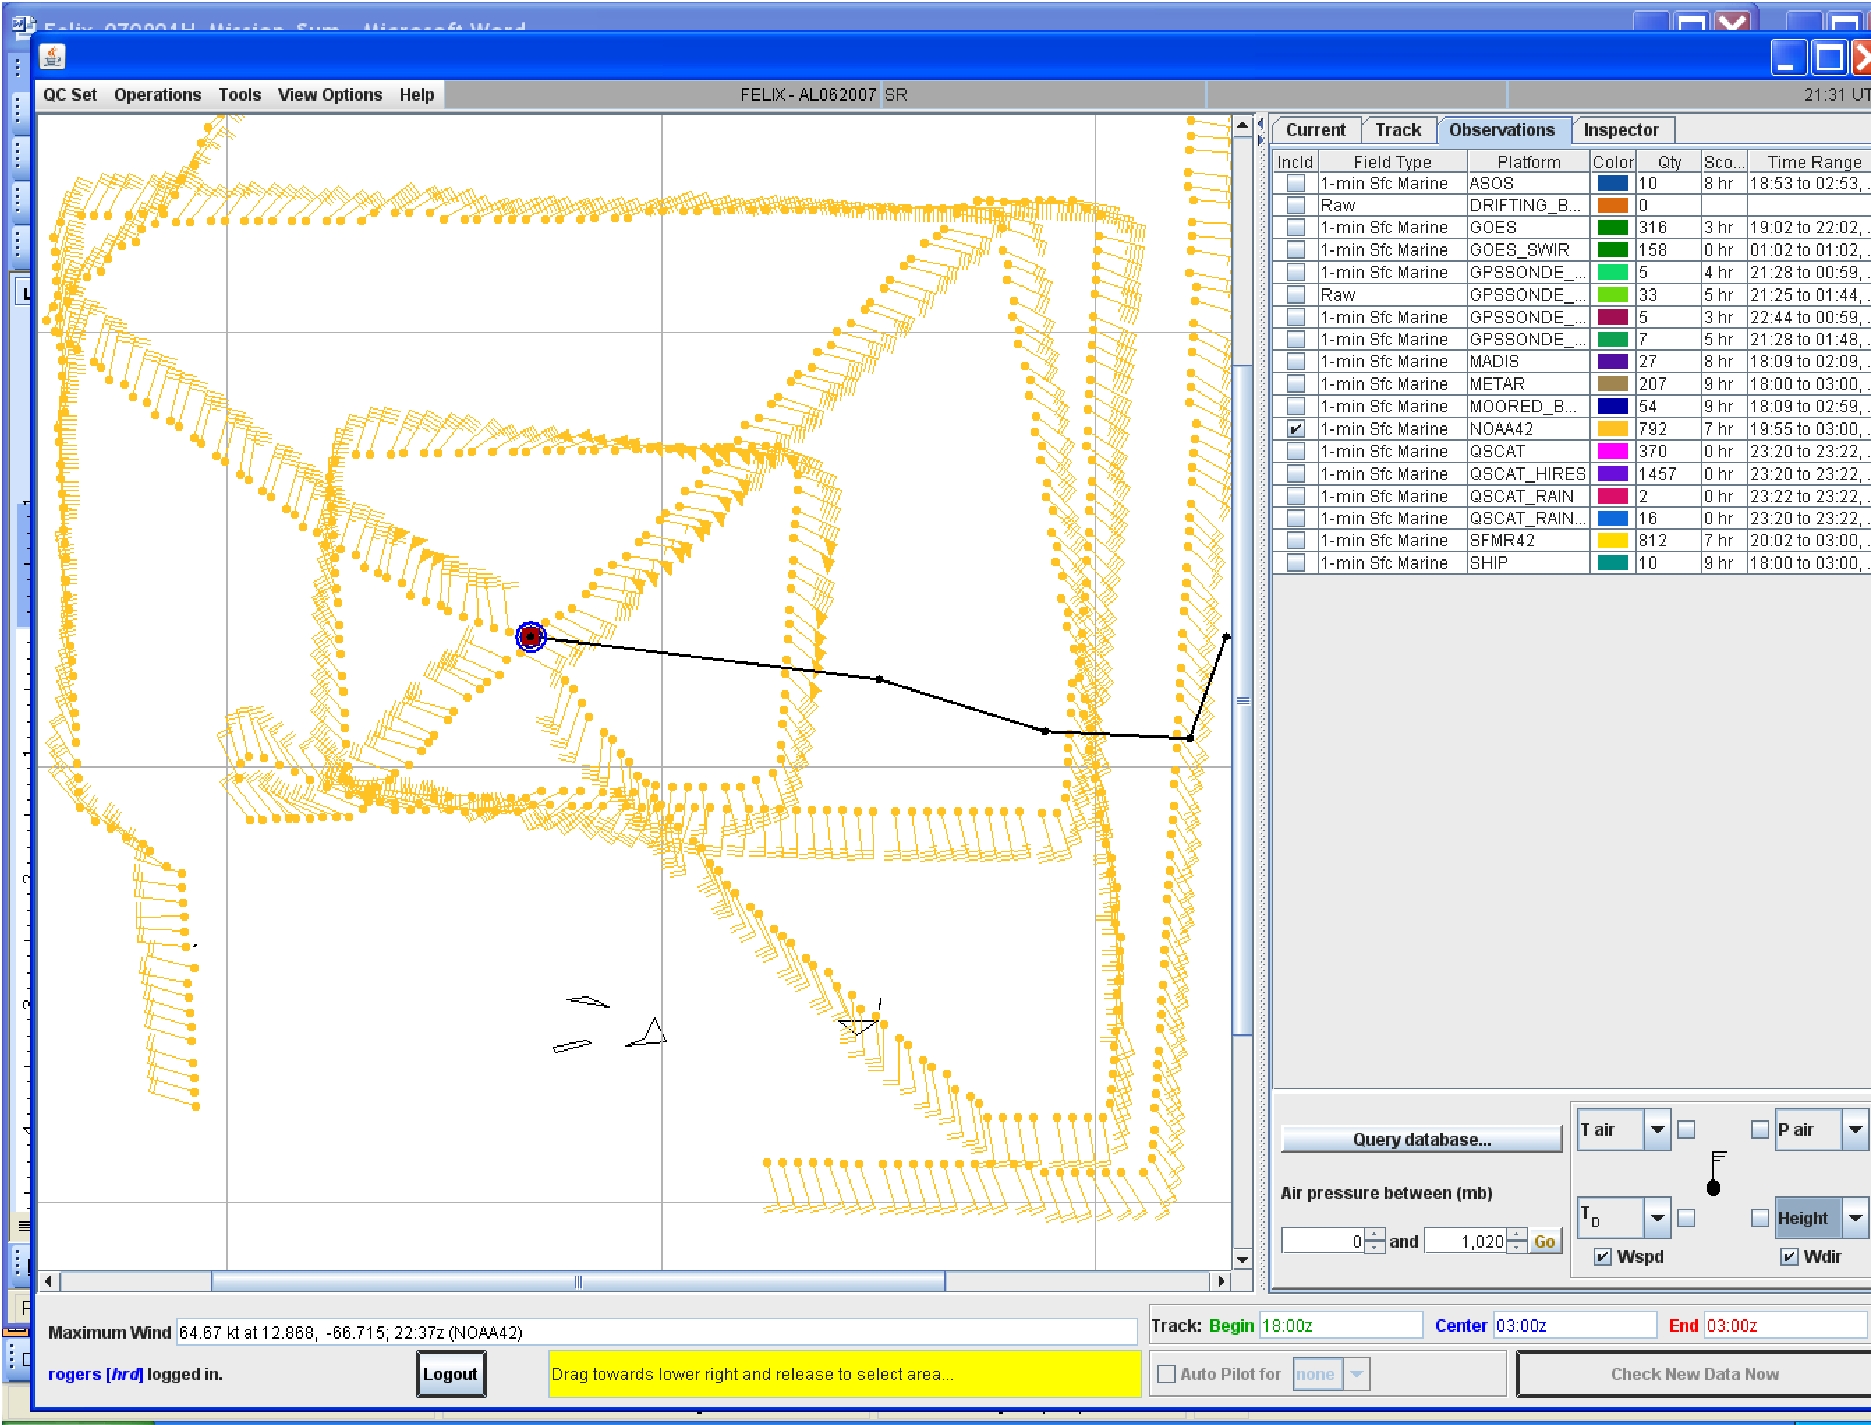
On the downwind leg of the Figure-4 pattern, there were bands evident on the LF about 60 nm east of the aircraft position with strong convective cores in them. On the next inbound leg from the northeast, there was little convection. The core did seem more circular in shape, compared to the previous pass, when it was more elliptical oriented in an east-west fashion. Peak flight-level winds were 76 kt, and SFMR winds were 69 kt. The central pressure had dropped to 993.4 hPa. Outside the core the aircraft had to deviate to track 270 because there were several islands and there were air clearance issues. On the southwest side of the storm, like on the southeast side, the winds were very diffuse, with extended areas where the surface and flight-level winds would oscillate above and below 60 kt. The outbound leg to the southwest had to be cut short because of clearance issues, so the aircraft headed back in bound to being the box-spiral pattern. On the transit to this point there was the developing eyewall to the left of the aircraft and a band of strong convective cores to the right of the aircraft. The inner box pattern was flown without any problems, with sondes dropped at each of the points indicated in Fig. 1. Upon reach the southwest corner of the inner box, the aircraft turned to track 90 to begin the outer box. Again during this leg there were two bands of convection to fly between: the eyewall, which had now developed, to the left (north) side of the aircraft, and a band of convection to the right (south) side. The outer box was flown as planned along the east, north, and northwest side, but again clearance issues caused the aircraft to have to deviate from its planned track on the south side (Fig. 6). A modified point southeast of the center was reached, and the aircraft turned toward the north and headed back to base at 0155 UTC September 2.
Problems :
There were no major problems with the dropsondes. There was one late launch detect, one drop with no winds, and one with no pressure, temperature, and humidity. All of these sondes were successfully backed up. As the final point was reached, it was noticed that there was a problem with the tail Doppler antenna. The data system was indicating erratic and unrealistic tilt angle values. It is not known how long this problem had been occurring, but the flight director was confident that the tail radar was working well for the majority of the flight. The onboard scientists had been periodically checking the tail radar as well and had not noticed any problems. An inspection of the data is required upon return to HRD to determine how salvageable the radar data is. Several attempts were made to perform real-time Doppler analyses on the flight for the two Fig-4 legs. However, the program for calculating radar antenna angle corrections was not able to complete its task, even after allowing it to run for several hours. It is not known if this was due to the problem with the tilt angle, or perhaps (though unlikely) due to the fact that the year on the workstation was incorrectly set and could not be corrected.
Robert Rogers
9/5/07
Mission Data
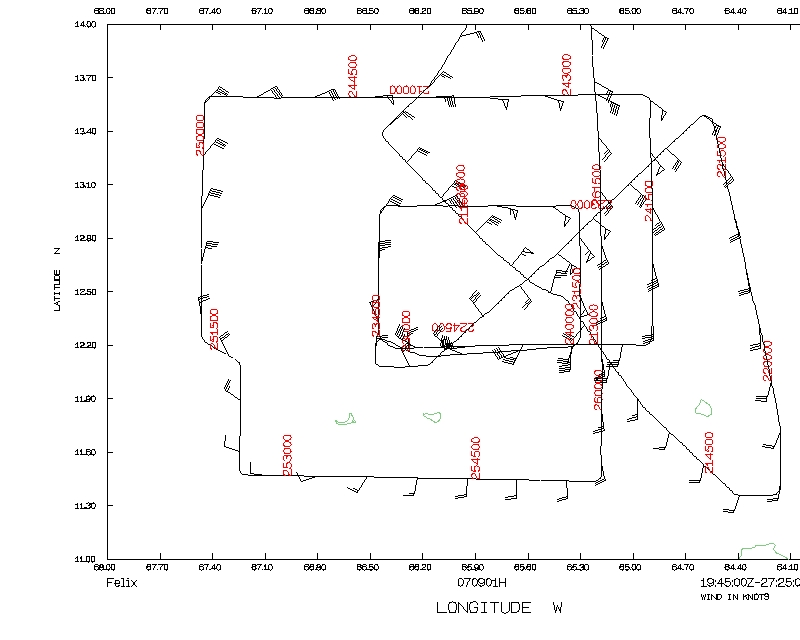
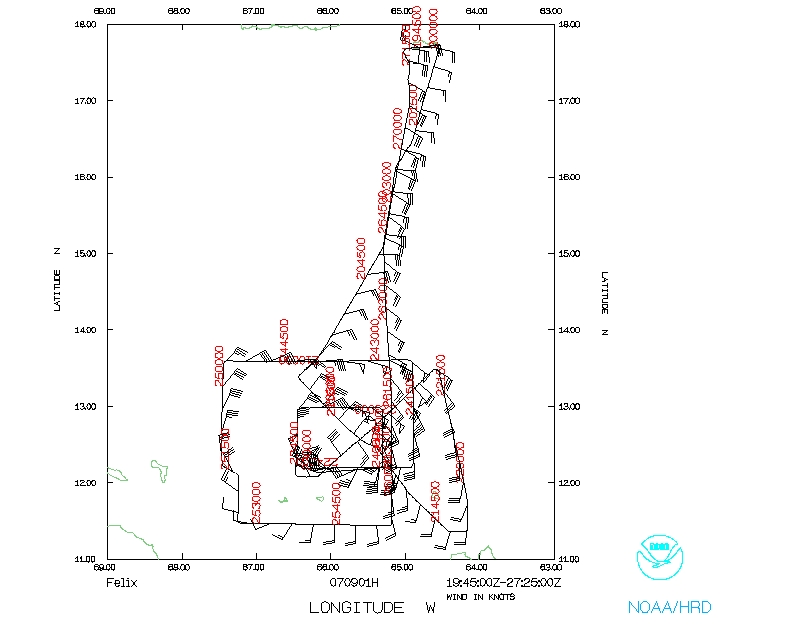 Flight track |
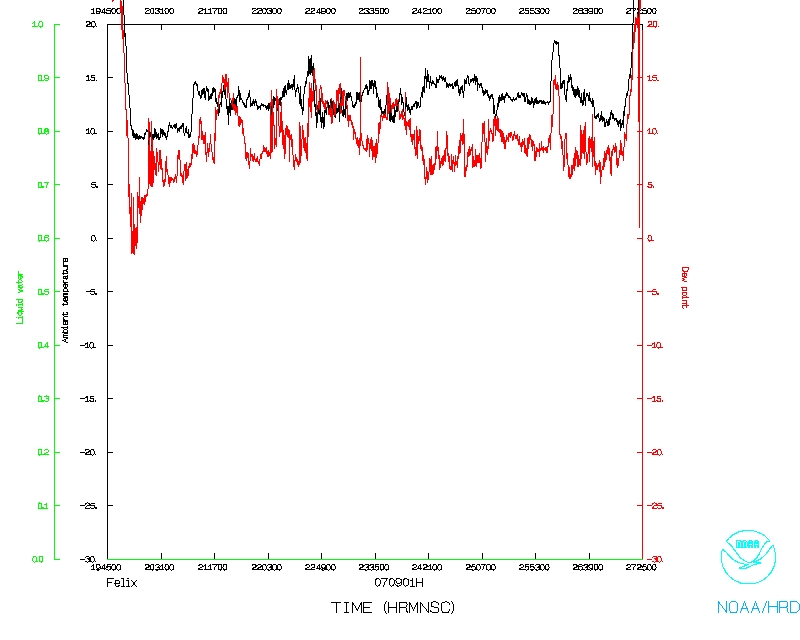 Temperature and Moisture |
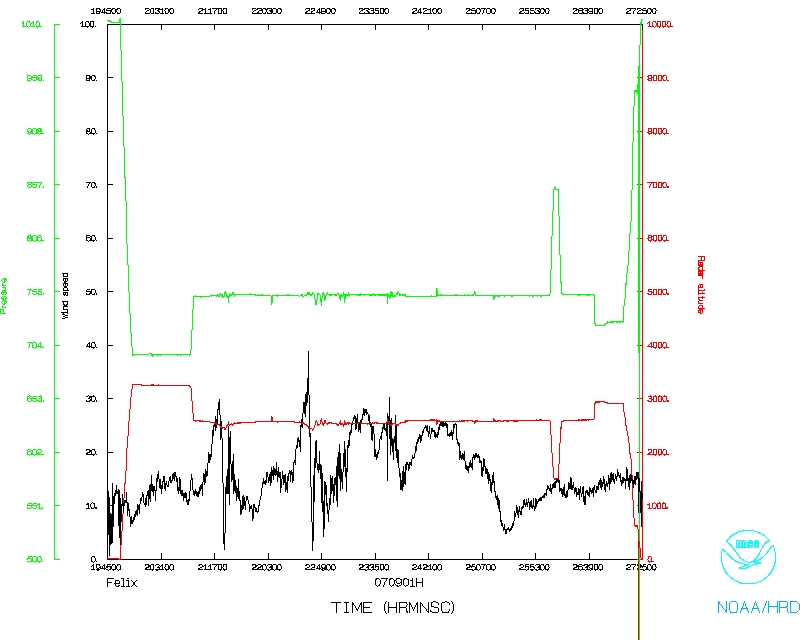 Wind and Atlitude |
 Flight track detail |