Mission Summary
20080815I1 Aircraft 43RF
AL92 (Pre-TS Fay)
3-D Doppler Winds Operational Mission
Scientific Crew (43RF)
| Lead Scientist | Jason Dunion |
| Radar Scientist | John Gamache |
| Dropsonde Scientist | Joe Cione |
Flight Crew (43RF)
| Pilots | Barry Choy
Carl Newman
Amelia Ebhardt |
| Flight Director | Jack Parrish |
| Navigator | Ryan Kidder |
| Flt. Eng. | Dewie Floyd
Joe Klippel |
| Data Tech | Terry Lynch
Jeff Smith |
| Elec. Tech | Damon Sans Souci |
Mission Plan :
NOAA 43RF will participate in an EMC 3-D Doppler Winds mission (with options to
conduct HRD's Convective Burst and Arc Cloud Modules) into AL92 (Pre-TS Fay).
The flight called for a rotated figure-4 pattern with an IP just south of a
large area of deep convection. The leg lengths were to be ~105 nm flown at
12,000 ft altitude and GPS dropsondes would be launched at the IP and at each
turn point (6 dropsondes total). Additional drops would be made in support of
possible HRD modules as well as at storm "center" positions (provided by NHC).
Doppler wind analyses will be transmitted off the plane in real-time, if
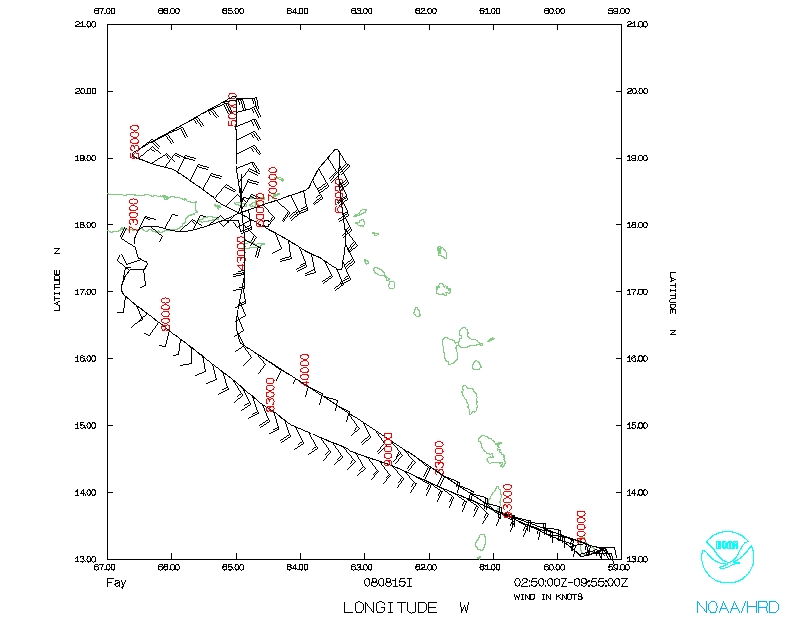
possible. The flight track and 10 GPS dropsonde points are shown in Fig. 1.
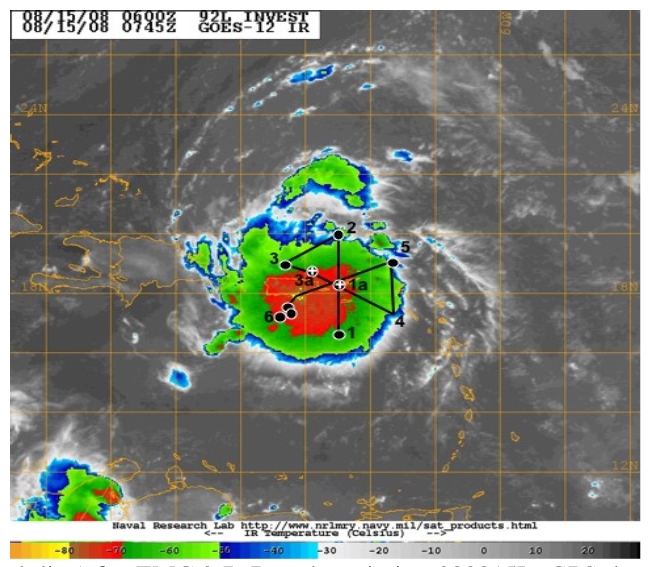
Fig. 1: Flight track (black line) for EMC 3-D Doppler mission 20080815I.
GPS dropsondes launched at the IP and turn points (6 total) are indicated by
gray circles. GPS dropsondes launched near the storm "center" (position
provided by NHC) are indicated with by "+". Two GPS dropsondes were launched
near point #6 in support of a HRD Convective Burst Module.
Mission Summary :
| Take off
| Landing
| Barbados | 02:53 UTC
| Barbados | 09:52 UTC
| |
a) Synoptic Situation
On 15 August, AL92 was positioned along the southwest periphery of an
elongated deep layer ridge and tracking slowly to the west-northwest (Fig. 2,
left). Vertical wind shear analyses from UW-CIMSS indicated ~5-20 kt of shear
over AL92 (with a strong gradient oriented north to south, with low values
over the center; Fig. 2, right), though most of the 15-20 kt values appeared
to be associated with an upper-level anticyclone that was developing over the
system (Fig. 3, right). Figure 3 (right) also indicated that upper-level
outflow over AL92 was still somewhat restricted in the SE quadrant and to the
south of the system, as well as in the NE quadrant. UW/CIMSS relative
vorticity analyses indicated that AL92 was associated with broad areas of
well-defined low-level (850 mb) and mid-level (500 mb) vorticity (Fig. 4).
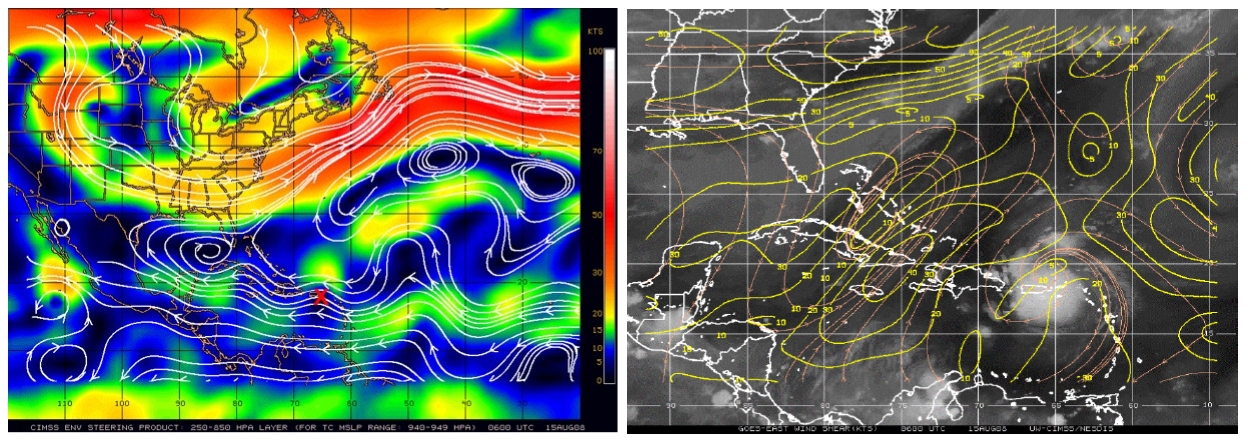
Fig. 2: (Left) plot of 250-850 hPa deep layer mean steering [magnitude
(direction) of the steering flow is indicated by colored shading (white
streamlines) and the convective center is shown by the red "X"] for 15 Aug
0600 UTC. (Right) vertical wind shear [magnitude (direction) of the wind
shear is indicated by yellow contours (orange streamlines)]) for 15 Aug 0600
UTC. AL92 was located east of Puerto Rico at this time. Images courtesy of
UW/CIMSS.
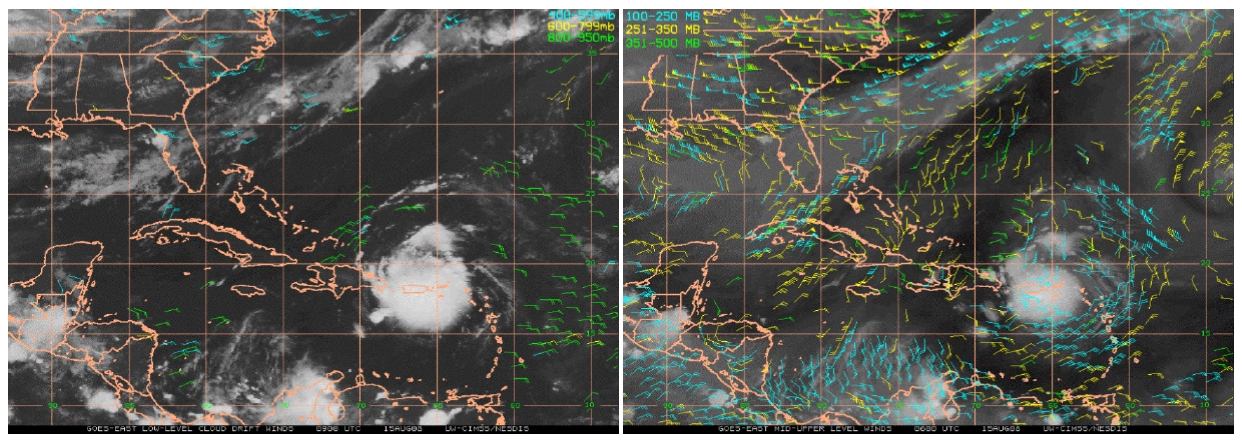
Fig. 3: Plots of (left) low to mid-level GOES cloud-drift winds and
(right) mid to upper-level GOES water vapor winds for 15 August 0900 and 0600
UTC. Images courtesy of UW/CIMSS.
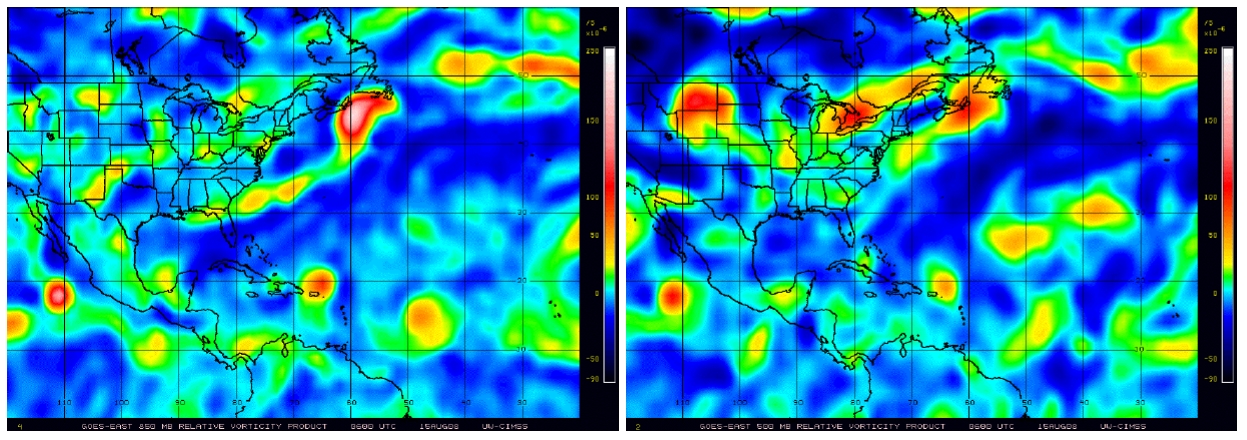
Fig. 4: Plots of (left) 850 mb and (right) 500 mb relative vorticity
for 15 August 0600 UTC. Images courtesy of UW/CIMSS.
b) Mission Specifics
Take-off was from Barbados at 0253 UTC. AL92 was slowly becoming better
organized with signs that the low-level and mid-level circulations were
becoming more aligned (Fig. 4) and that the convective core was becoming more
consolidated. During the mission, clouds top temperatures of -70 to -80°C
were evident in GOES infrared imagery and the convective structure resembled a
large MCS (Fig. 1). The flight pattern was executed as planned. GPS dropsondes
launched during this mission suggested that AL92's low-level circulation was
becoming better defined: the dropsonde surface winds that had indicated strong
southeasterlies blowing through AL92's convection on 14 August were now
suggesting that a broad surface circulation was developing under the
convection. Two extra GPS dropsondes were launched at NHC-estimated center
positions at 18.2°N 64.9°W (0441 UTC) and 18.75°N 65.84°W
(0540 UTC) [Fig. 6]. The first "center" drop exhibited surface winds that
suggested that it was east of the broad low-level circulation (Fig. 5, drop
#1a). The second "center" drop appeared to be northeast of the broad low-level
circulation (Fig. 5, drop #3a). The lowest GPS dropsonde pressure observed
during the mission was 1010.0 mb at drop #3a, northeast of the broad low-level
vorticity center. Doppler winds (1 km above the surface) were in excellent
agreement with the GPS dropsonde surface wind observations and also suggested
that low-level westerlies were present between drop point #3 and #6 (Fig. 6,
right). It is not certain if these westerlies were the first signs of a closed
low-level circulation or if was a short-lived inflow pattern that was
associated with strong low-level inflow into the convective burst (-70 to
-80°C cloud tops) that was occurring just to the east. Three Doppler
wind analyses were transmitted off the P-3 in real-time during this mission.
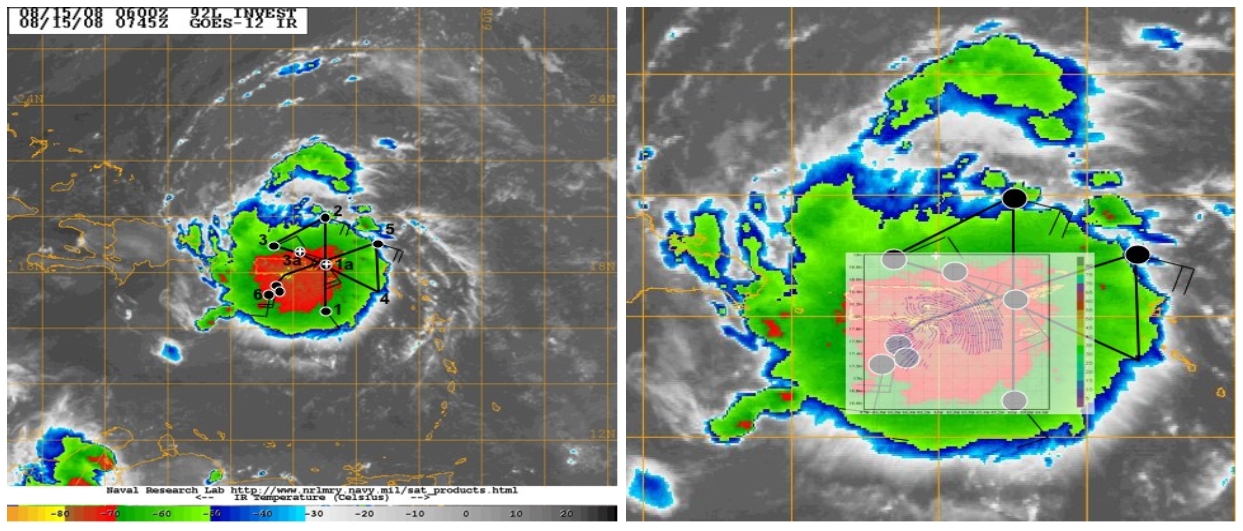
Fig. 5: GOES infrared satellite image of AL92 on 15 August 0745 UTC
with the P-3 track/dropsonde points overlaid. Also overlaid are (left) GPS
dropsonde surface winds (kt) and (right) GPS dropsonde surface winds (kt) and
1 km Doppler winds (derived from the P-3 tail Doppler radar). Image courtesy
of NRL/Monterey.
Problems :
There were no major problems related to this flight. The first GPS dropsonde
had a "no launch detect" and was backed up. AVAPS went down shortly after GPS
dropsonde #4 was launched (southeast quadrant) and data for that dropsonde
could not be recovered.
Mission Data
1 sec data file |
1 sec data file |
NetCDF data file
Page last updated September 17, 2008
Return to Mission page.