Mission Summary
20080815H1 Aircraft 42RF
AL92 ferry flight 2008
Scientific Crew (42RF)
| Lead Scientist | Sim Aberson |
| Radar Scientist | Paul Leighton |
| Dropsonde Scientist | Shirley Murillo |
| Observer | Rob Rogers |
Flight Crew (42RF)
| Pilots | Mark Nelson
Al Girimonte |
| Flight Director | Barry Damiano |
| Navigator | Peter Siegel |
| Flt. Eng. | Greg Bast
Steve Wade |
| Data Tech | Bobby Peek |
| Elec. Tech | Bill Olney
Joe Bosko
Chuck Rasco |
Mission Plan :
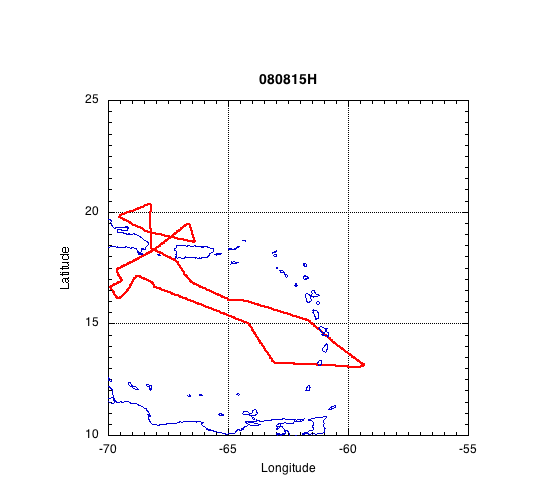
The plan called for a butterfly pattern, entering from south, and modified to
make surewe do not fly within 12 nm of land. There is time for other modules
at the end of the three passes. System is still not a depression as of the
takeoff time.
Mission Summary :
| Take off
| Landing
| Barbados | 14:55 UTC
| Barbados | 22:59 UTC
| |
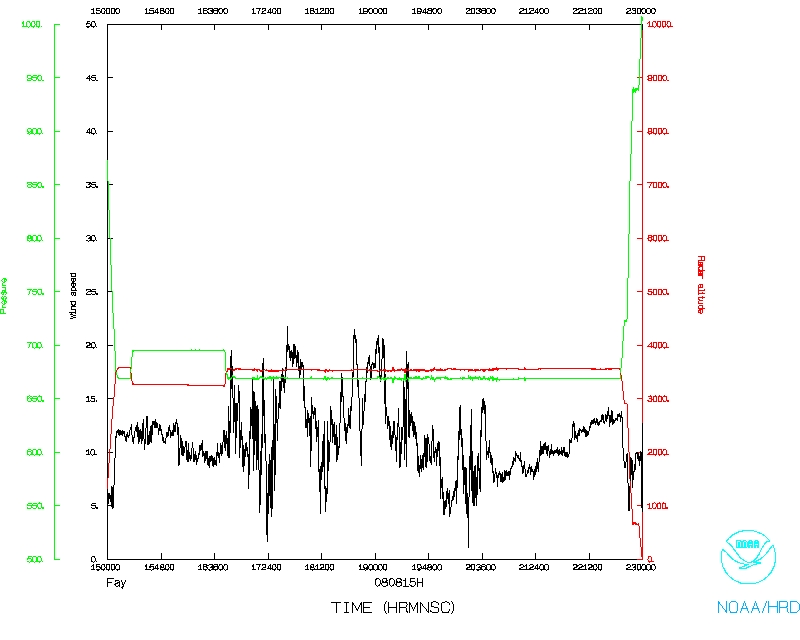
AL92 remained a disturbance throughout the beginning of the flight. Despite
having ample convection, a seemingly good satellite signature, and flight-level
winds approaching 5 kt, aircraft has been unable to close off a low-level
center for many days. Three passes through the supposed center of the system
were made during the flight, centered at 1715, 1810, and 1926 UTC. The
operational radar analysis on the aircraft failed during the first pass. The
second passed failed to show a closed circulation at any levels because the
plane remained well to the north of Hispaniola and Puerto Rico where the center
was. However, by the third pass (Fig. 1), a closed circulation is evident from
near the surface up to at least 14.5 km. Deep convection was seen by the tail
radar with reflectivities measured up through 17.5 km. At this time, even
though the center was inland, based on Air Force and NOAA data, NHC declared
the system to be a tropical cyclone. The process by which the tropical wave
and its convection finally developed a closed circulation, especially with the
land interaction, is a definite avenue for further genesis research. After the
butterfly pattern was completed, a large area of convection was seen on the
lower-fuselage radar south of Hispaniola, so a convective burst module was
completed. The P3 flew around three sides of the convection, releasing dropwind
sondes at each of the turn-points (though, unfortunately, some of these
dropwindsondes failed). Interestingly, a mid-level circulation could be seen
in the radar analyses (Fig. 1) in this region. At 2018 UTC, the aircraft flew
through a second flight-level center in this region, though this center was not
as clearly defined as the cyclone center itself. This area also had constant
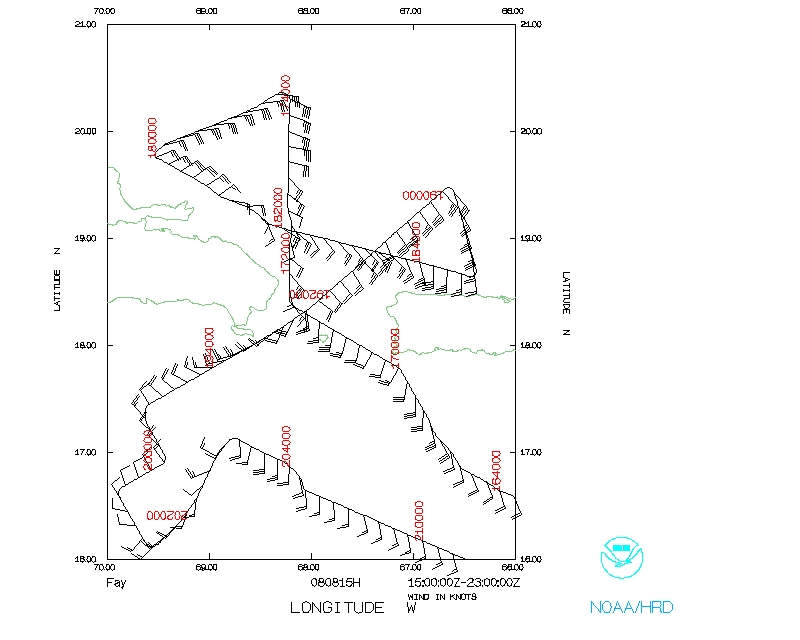
lightning seen through the aircraft windows. The dropwindsonde data (Fig. 2)
show a southwest-to-northeast tilted vortex extending from 700 hPa down to the
surface. Satellite imagery (not shown) suggested that this area of convection
lasted a few more hours before dissipating, and it did not become a major
player in the future evolution of what became Fay. It will be interesting to
initialize models with these data to see the interaction of this feature, land,
and the cyclone itself.


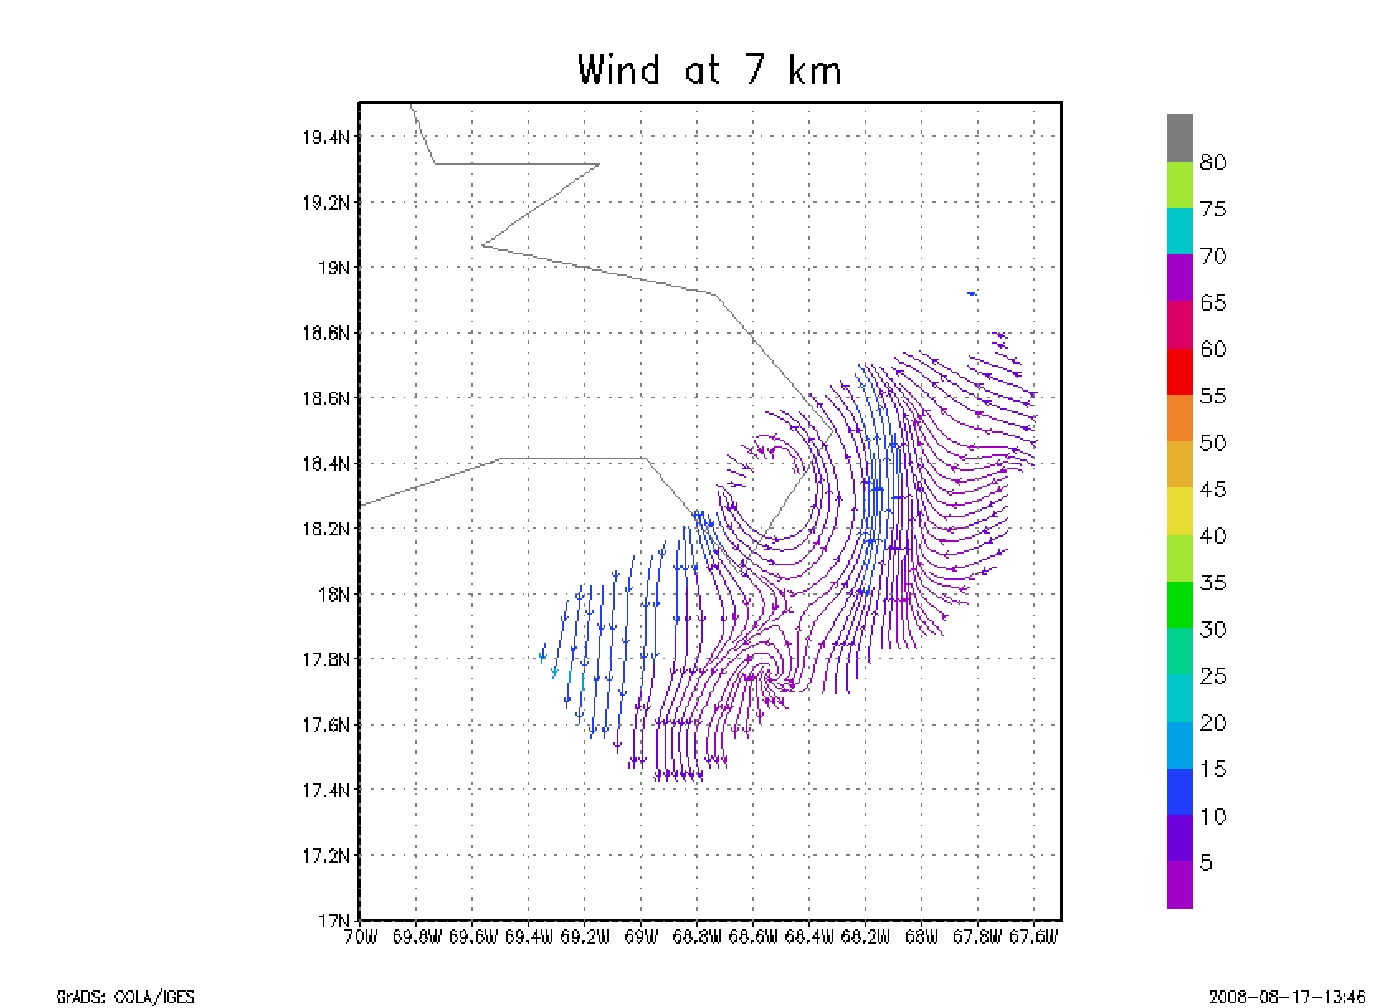
Figure 1: Operational radar analyses from the third pass by the center
of the cyclone, centered at 2126 UTC, 14 August, at (right to left) 3 km, 5 km,
and 7 km altitude, respectively.
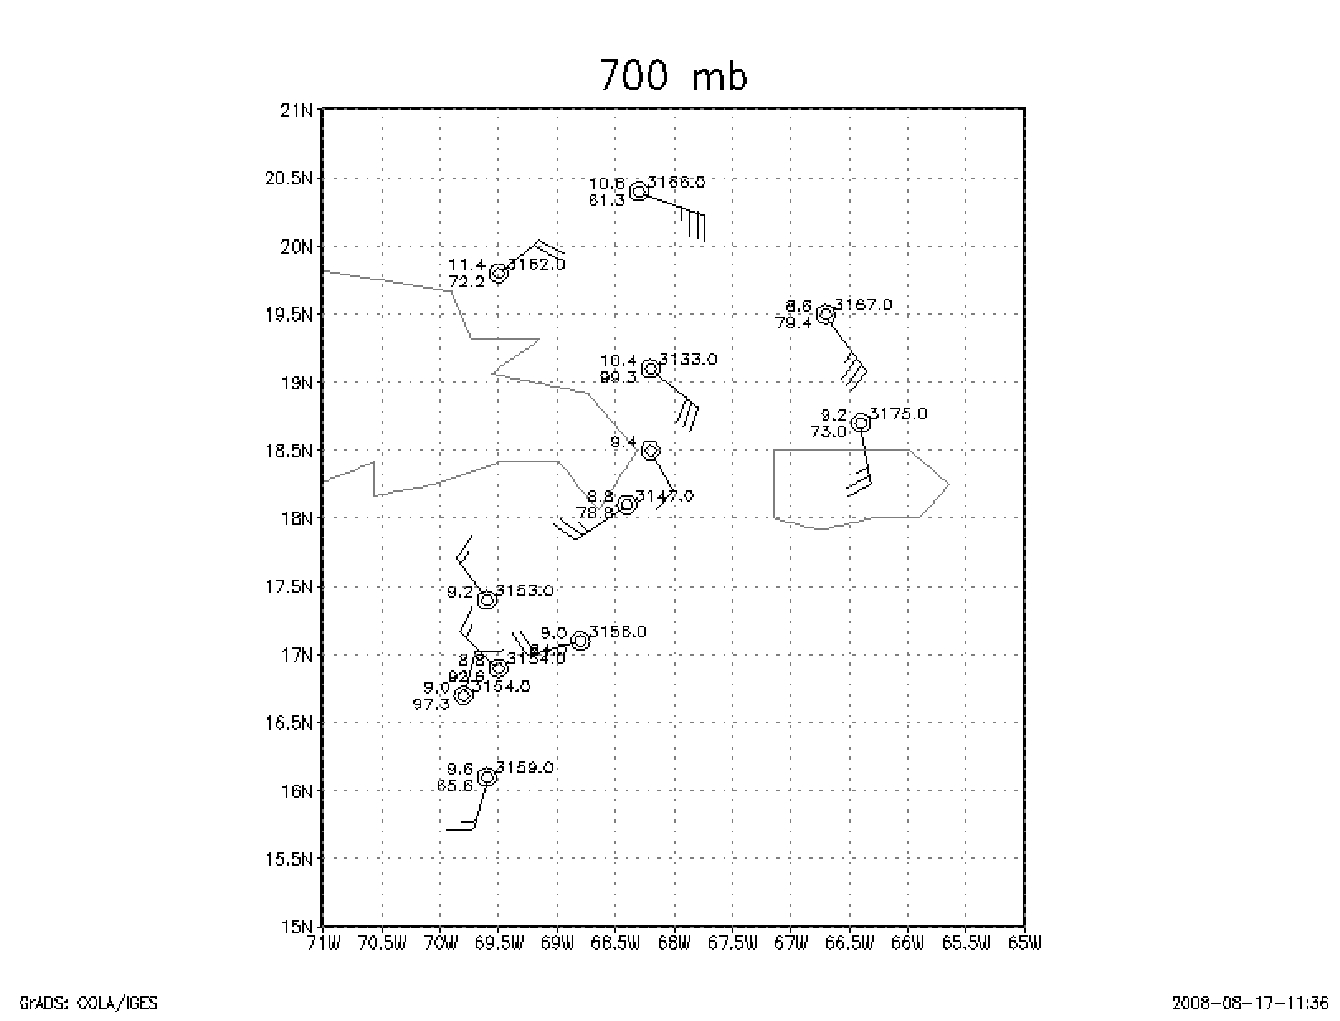

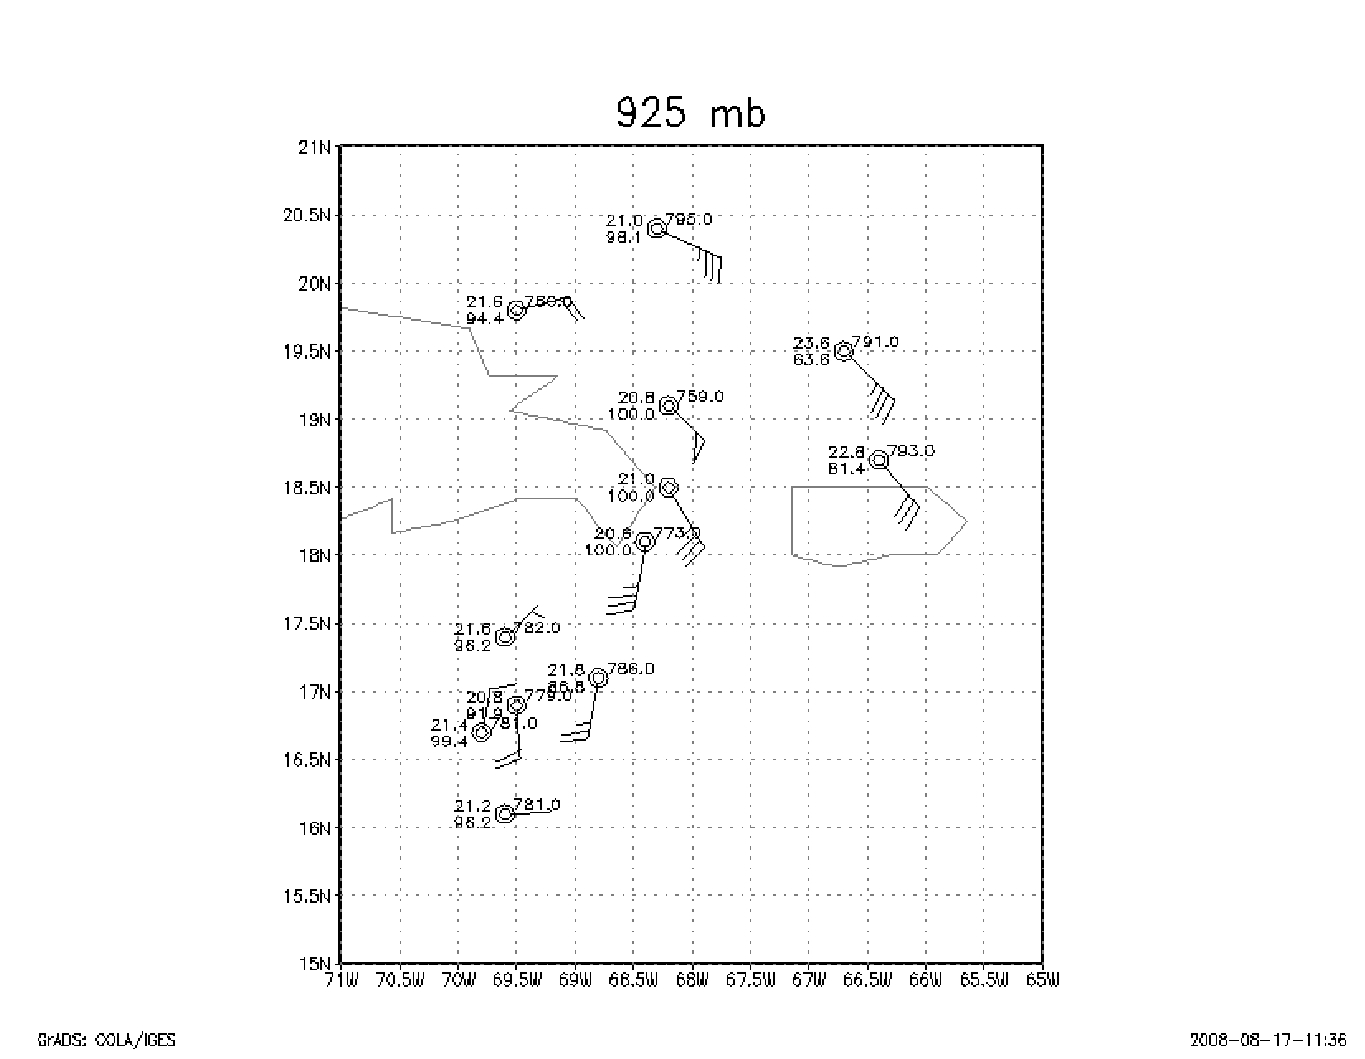
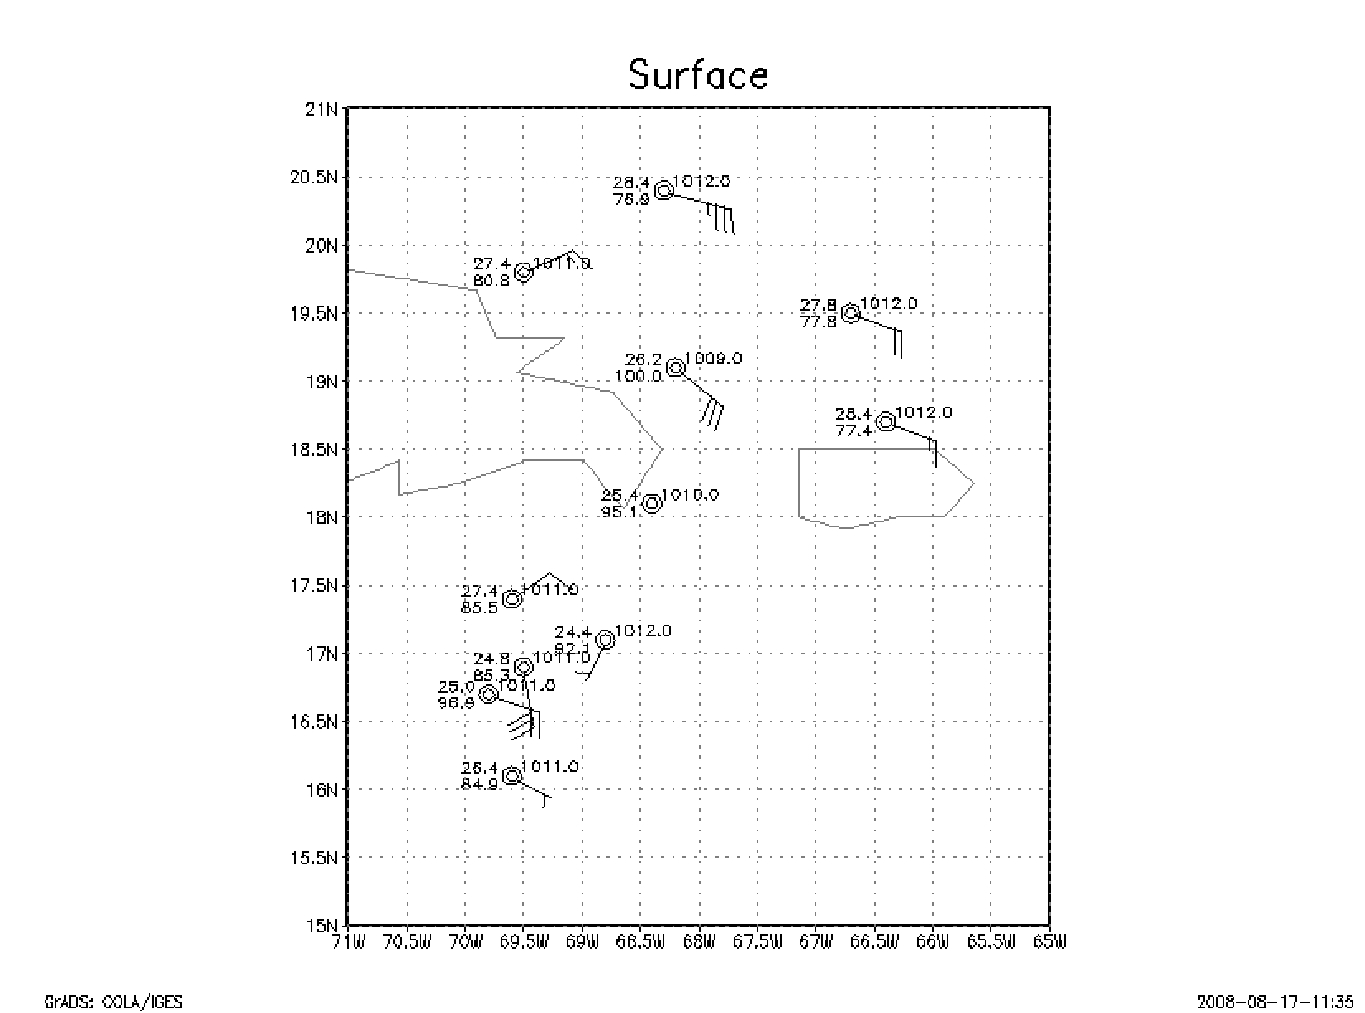
Figure 2: Dropwindsonde data from the 080815H flight in earth-relative
coordinates. Note the circulation to the south of the eastern tip of
Hispañola associated with a convective burst.
Problems :
Mission Data
FDir manifest |
1 second listing |
NetCDF listing
Page last updated August 15, 2008
Return to Mission page.