Mission Summary
20080814H1 Aircraft 42RF
AL92 Genesis Mission Summary
Scientific Crew (42RF)
| Lead Scientist | Robert Rogers |
| Radar Scientist | Paul Leighton |
| Dropsonde Scientist | Shirley Murillo |
| Observer | Sim Aberson |
Flight Crew (42RF)
| Pilots | Mark Nelson
Al Girimonte |
| Flight Director | Barry Damiano |
| Navigator | Pete Siegel |
| Flt. Eng. | Greg Bast |
| Data Tech | Bobby Peek |
| Elec. Tech | Bill Olney
Joe Bosko |
Mission Brief:
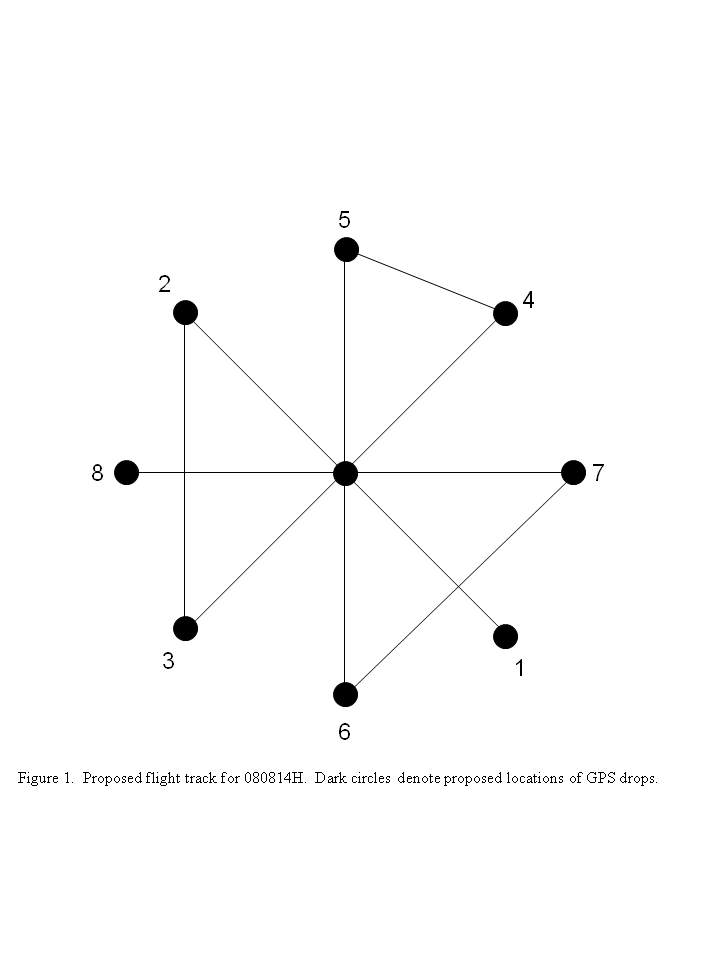 The plan called for the aircraft to fly a
rotating figure-4 pattern
(Fig. 1) in a developing system just northeast of the Windward Islands.
The system has convective bursts associated with it, which have been
persistent (though intermittent) for the past 24 h. The IP would be set up
on the southeast side, with 105 nm legs. First pass would be flown at 5000 ft
to hunt for the center at that altitude, and then the aircraft would climb to
12,000 ft for the rest of the mission. If possible, we would fly a convective
burst module around a mesoscale convective system, sampling convective and
stratiform areas. Sondes would be dropped at all turn points where there
are no scatterers, plus one center drop from 12,000 ft. In addition, any
turn points within the convective burst module would have sondes dropped
with them. No AXBT's were planned for this flight.
The plan called for the aircraft to fly a
rotating figure-4 pattern
(Fig. 1) in a developing system just northeast of the Windward Islands.
The system has convective bursts associated with it, which have been
persistent (though intermittent) for the past 24 h. The IP would be set up
on the southeast side, with 105 nm legs. First pass would be flown at 5000 ft
to hunt for the center at that altitude, and then the aircraft would climb to
12,000 ft for the rest of the mission. If possible, we would fly a convective
burst module around a mesoscale convective system, sampling convective and
stratiform areas. Sondes would be dropped at all turn points where there
are no scatterers, plus one center drop from 12,000 ft. In addition, any
turn points within the convective burst module would have sondes dropped
with them. No AXBT's were planned for this flight.
Mission Synopsis:
| Take off
| Landing
| Barbados | 15:02 UTC
| Barbados | 22:42 UTC
| |
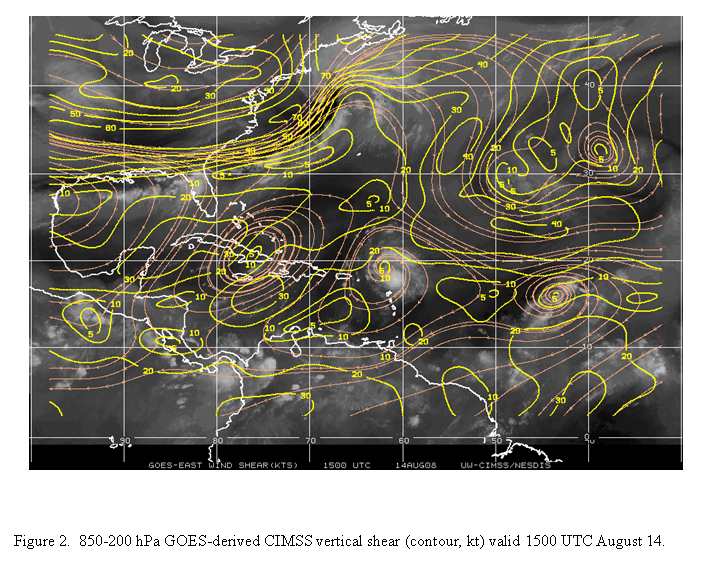
 AL92 continued to try to become better organized prior to and during this
mission. The system was experiencing light-to-moderate southwesterly 850-200
hPa shear of 10-15 kt over the center and 20 kt shear to the north of the
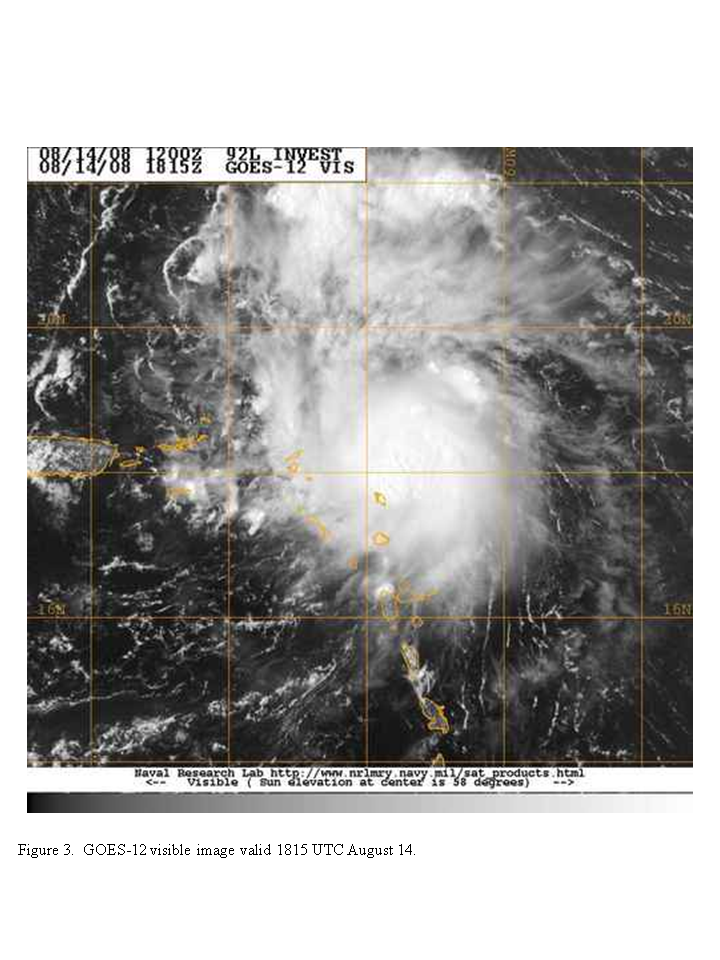
system (Fig. 2). GOES
visible imagery during the mission
(Fig. 3) showed some
deep convection just northeast of the Windward islands. The orientation
of the cloud patterns in this visible image suggest a midlevel vortex was
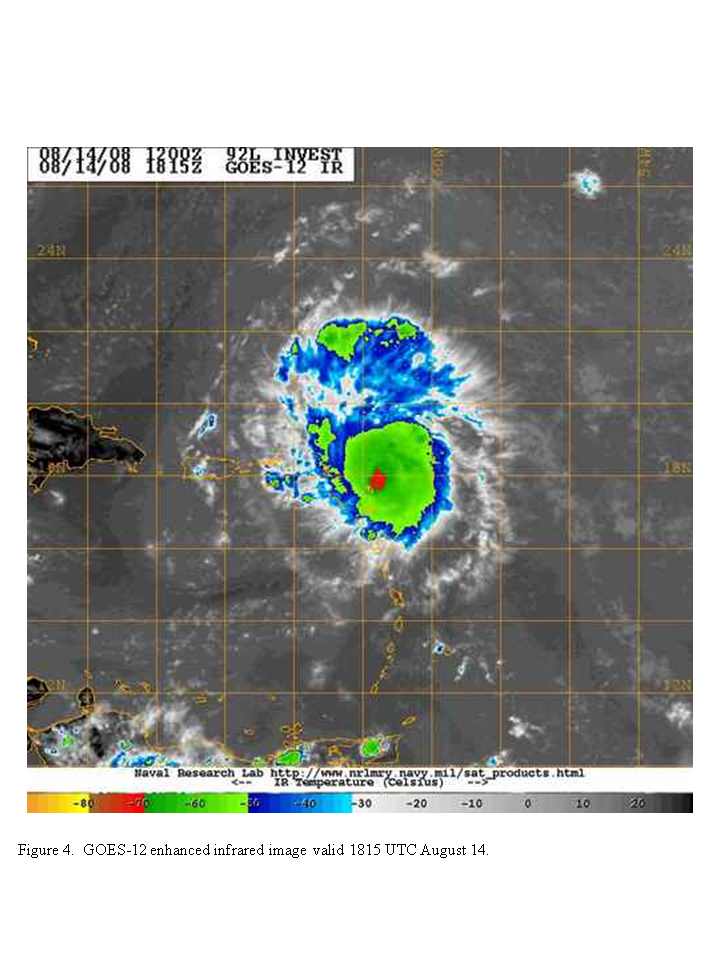
present, if not a low-level vortex. An infrared image at this same time
(Fig. 4) showed a broad
shield of -60°C cloud tops with an isolated area of -70°C cloud tops
near the center of the shield. Inspection of visible animations indicated
that this cloud shield was displaced to the northeast of any possible lower
tropospheric circulation. This was consistent with the shear pattern from
Fig. 2.
AL92 continued to try to become better organized prior to and during this
mission. The system was experiencing light-to-moderate southwesterly 850-200
hPa shear of 10-15 kt over the center and 20 kt shear to the north of the
system (Fig. 2). GOES
visible imagery during the mission
(Fig. 3) showed some
deep convection just northeast of the Windward islands. The orientation
of the cloud patterns in this visible image suggest a midlevel vortex was
present, if not a low-level vortex. An infrared image at this same time
(Fig. 4) showed a broad
shield of -60°C cloud tops with an isolated area of -70°C cloud tops
near the center of the shield. Inspection of visible animations indicated
that this cloud shield was displaced to the northeast of any possible lower
tropospheric circulation. This was consistent with the shear pattern from
Fig. 2.
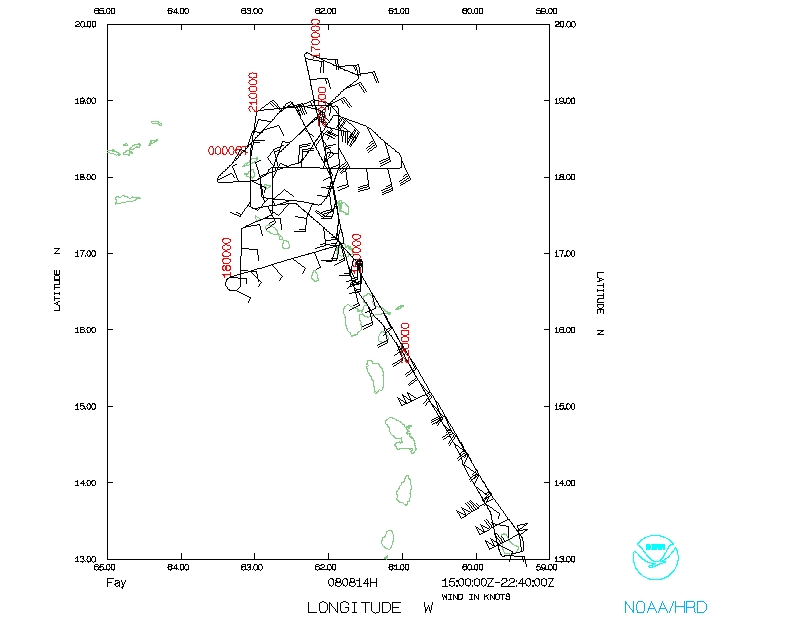
 The mission, and the resultant flight track, was very complicated as indicated
by the flight track (Fig. 5).
Air-traffic control issues were a significant impediment at the beginning of
the mission. On the first leg at 5000 ft, we had to loop, and then deviate
track, so we could not execute the flight plan as originally planned.
The mission, and the resultant flight track, was very complicated as indicated
by the flight track (Fig. 5).
Air-traffic control issues were a significant impediment at the beginning of
the mission. On the first leg at 5000 ft, we had to loop, and then deviate
track, so we could not execute the flight plan as originally planned.
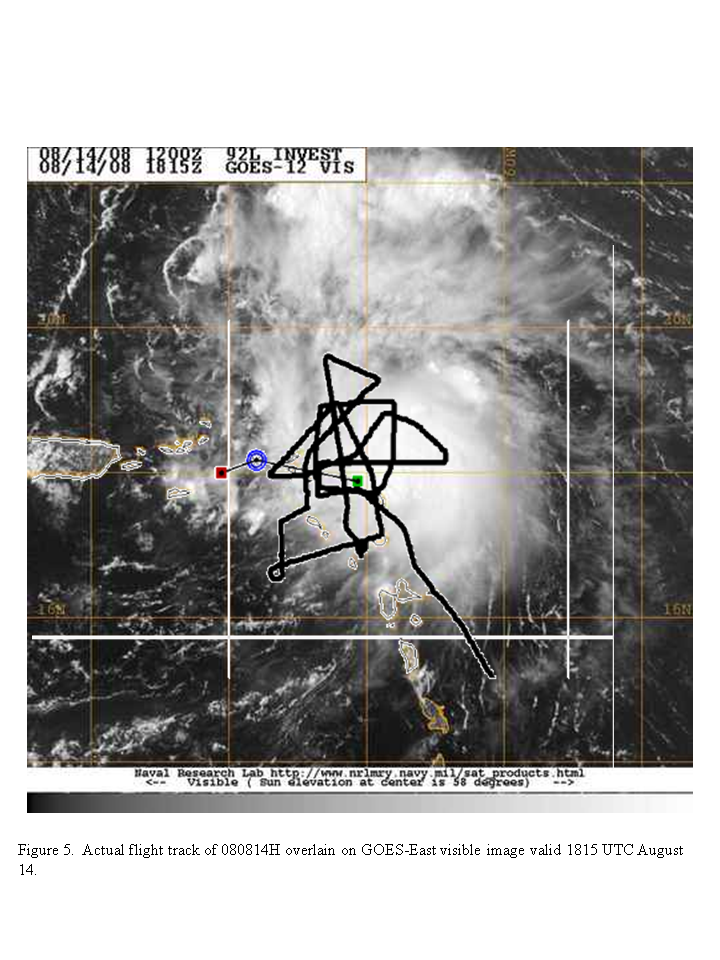 Eventually we climbed to 12,000 ft because of lack of communications, setting
up a new IP on the northeast side. We proceeded southwest, then deviated to
the south to try to find the midlevel center (winds were northerly along this
leg). We then proceeded south, then turned to the southwest, in clear air.
Eventually we climbed to 12,000 ft because of lack of communications, setting
up a new IP on the northeast side. We proceeded southwest, then deviated to
the south to try to find the midlevel center (winds were northerly along this
leg). We then proceeded south, then turned to the southwest, in clear air.
 We continued there for a distance, then ended the leg and headed toward a point
southeast of the center. We flew northwest, then downwind to a point west
of the center. Then we flew back east through the convective system to the
east of the supposed low-level center. At the end of the eastbound leg, we
flew a convective burst module where we flew along the back edge of stratiform
rain, then turned to the southwest to sample the convective system from the
rear to the front, then turned west-southwest to sample newly-developing
convection on the west side of the MCS (possibly developing over the low-level
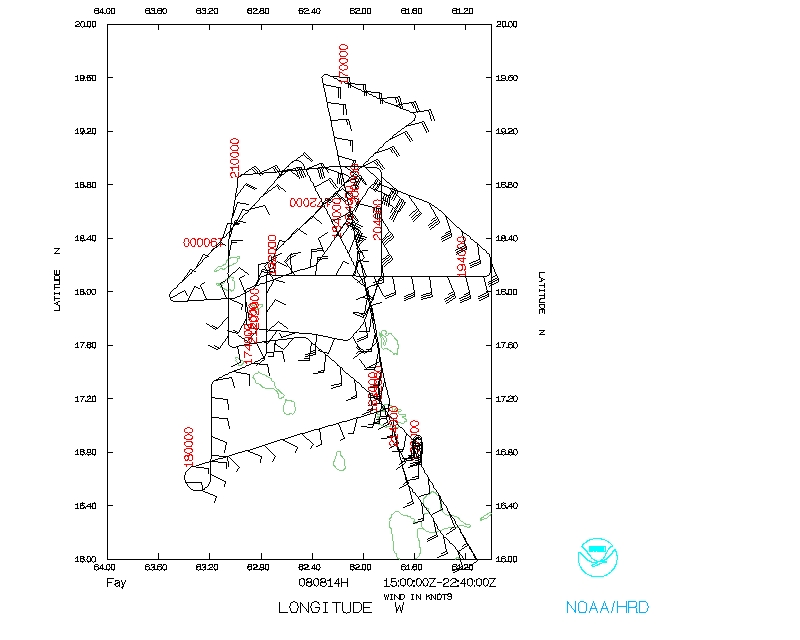
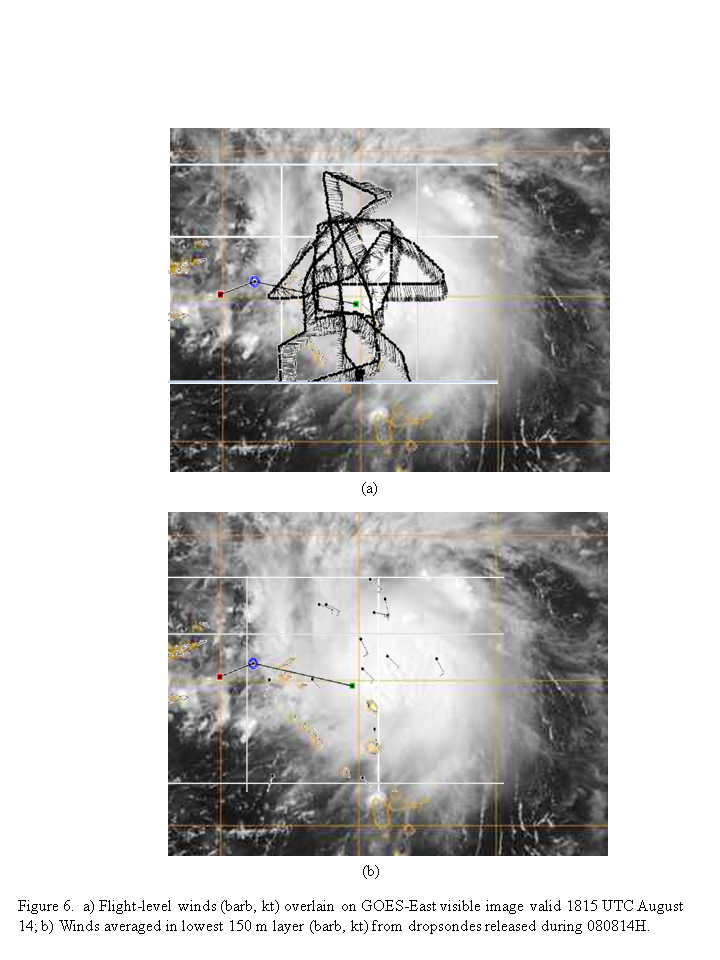
center). Flight-level winds
(Fig. 6a)
showed a circulation center at this altitude associated with the precipitation
shield. Then we turned back to sample the convection at the leading edge of
the original MCS. We flew front-to-rear, through the stratiform region. We
then turned back to the west, then south, sampling new convection again. We
dropped sondes at the major turn points, the turns of the burst module, and at
midpoints of the front-to-rear and rear-to-front legs
(Fig. 6b).
We continued there for a distance, then ended the leg and headed toward a point
southeast of the center. We flew northwest, then downwind to a point west
of the center. Then we flew back east through the convective system to the
east of the supposed low-level center. At the end of the eastbound leg, we
flew a convective burst module where we flew along the back edge of stratiform
rain, then turned to the southwest to sample the convective system from the
rear to the front, then turned west-southwest to sample newly-developing
convection on the west side of the MCS (possibly developing over the low-level
center). Flight-level winds
(Fig. 6a)
showed a circulation center at this altitude associated with the precipitation
shield. Then we turned back to sample the convection at the leading edge of
the original MCS. We flew front-to-rear, through the stratiform region. We
then turned back to the west, then south, sampling new convection again. We
dropped sondes at the major turn points, the turns of the burst module, and at
midpoints of the front-to-rear and rear-to-front legs
(Fig. 6b).
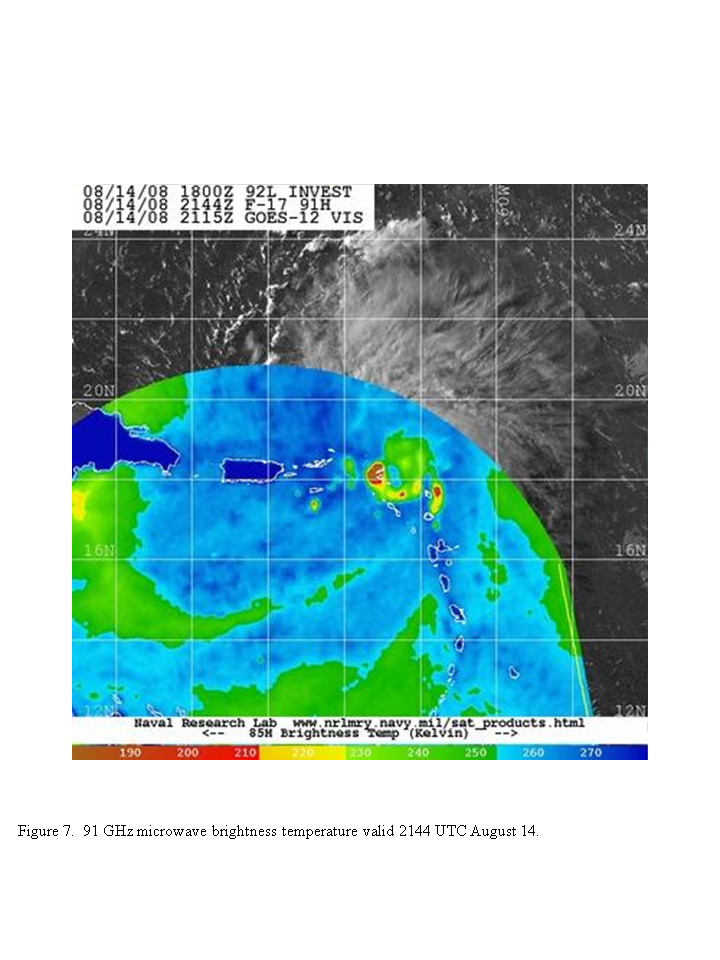 A total of 13 dropsondes were
released. Toward the end of the pattern satellite microwave imagery showed
that the convection on the southwest side of the burst module had become the
dominant area of convection, while the precipitation area intensively sampled
earlier had much lower microwave brightness temperatures
(Fig. 7).
A total of 13 dropsondes were
released. Toward the end of the pattern satellite microwave imagery showed
that the convection on the southwest side of the burst module had become the
dominant area of convection, while the precipitation area intensively sampled
earlier had much lower microwave brightness temperatures
(Fig. 7).
The system was very complex. There was clear evidence of a midlevel center,
displaced to the east of a possible low-level center. We never sampled a
low-level center, though, because one most likely did not exist at this time.
 Peak flight-level (SFMR) winds of about 40 (35) kt were observed in the
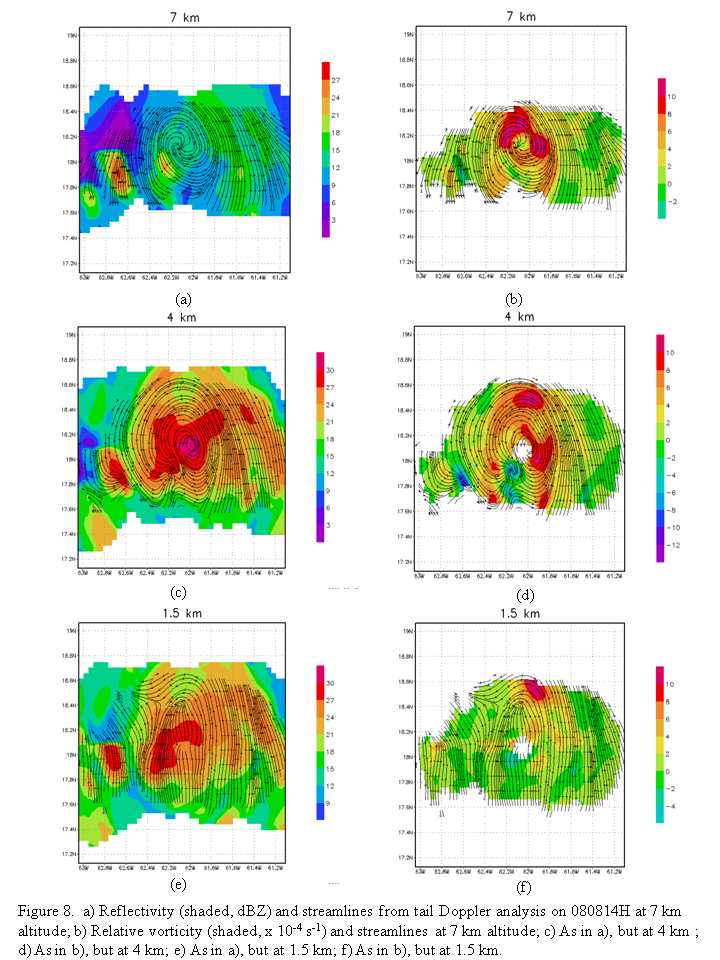
precipitation shield. One radar leg
(Fig. 8), flown from west
to east, sampled well the midlevel vortex, which was coherent from 3 km up to
10 km. Below that level was southerly flow. Vorticity was maximized at the
4-7 km layers in this pass, with scattered weaker areas of positive vorticity
at 1.5 km. We also possibly got good data from the burst module, which may
have sampled a burst in its mature-to-decaying phase and in its initiation
stage.
Peak flight-level (SFMR) winds of about 40 (35) kt were observed in the
precipitation shield. One radar leg
(Fig. 8), flown from west
to east, sampled well the midlevel vortex, which was coherent from 3 km up to
10 km. Below that level was southerly flow. Vorticity was maximized at the
4-7 km layers in this pass, with scattered weaker areas of positive vorticity
at 1.5 km. We also possibly got good data from the burst module, which may
have sampled a burst in its mature-to-decaying phase and in its initiation
stage.
Problems :
There were some problems with the inertials at the beginning of the flight,
which may have an impact on the radar data at this time. Two dropsondes during
the burst module had problems with fast fall.
Robert Rogers
8/17/08
Mission Data
FDir manifest |
1 sec listing |
NetCDF listing
Page last updated August 14, 2008
Return to Mission page.