Mission
Summary
20080819I1 Aircraft 43RF
TS Fay 3D-Doppler/Landfall Mission Summary
| Scientific Crew (42RF) | |
| Lead Scientist | Michael Black |
| Radar Scientist Dropsonde Scientist |
John Gamache |
| Observer | Dan Cecil (UAH) |
| Flight Crew (42RF) | |
| Pilots | Barry Choy Carl Newman Amelia Ebhardt |
| Flight Director | Jack Parrish |
| Navigators | Ryan Kidder Peter Siegel |
| Flt. Eng. | ? |
| Data Tech | Terry Lynch |
| Elec. Tech | Jeff Smith Daehv, Baldi Randy Mitchell |
Mission Brief:
The originalplan called for the aircraft to fly a butterfly pattern (Fig. 1), rotated to avoid flying over Florida. Takeoff would be from MacDill AFB, and landing would be at the New Orleans International Airport, because there was a threat to MacDill. At the mission briefing it was decided that we would fly over Florida, since the terrain was very flat. We would be very careful in avoiding convection over land, flying at 12,000 ft. It was decided that either in the middle of pass 2 or pass 3, N43RF would break off from the pattern to do a coastal-survey pattern along the coast from Marco Island to Cape Sable. Because of the bathymetry near Florida, no AXBTs were to be dropped on this flight. Sondes were to be dropped at points 1-6, if there was no radar return near the turn point. These sondes were dropped to help anchor the wind fields in HWRF, if the distribution of Doppler radial-velocity observations was asymmetric.
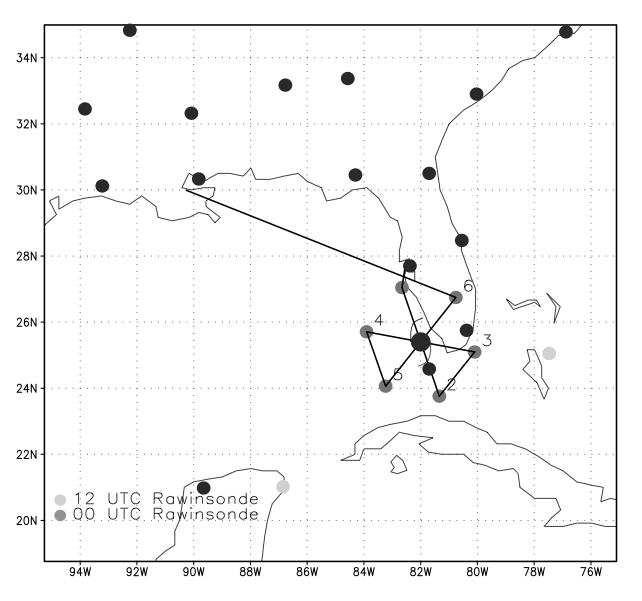
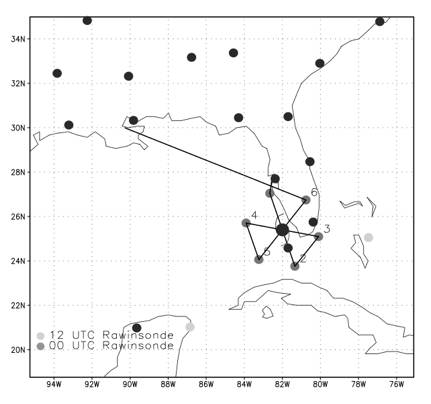
Figure 1.Originally proposed flight plan (without coastal survey).
Mission Synopsis:
| Take off | Landing | ||
| MacDill AFB, FL | 03:17 UTC | New Orleans, LA | 09:47 UTC |
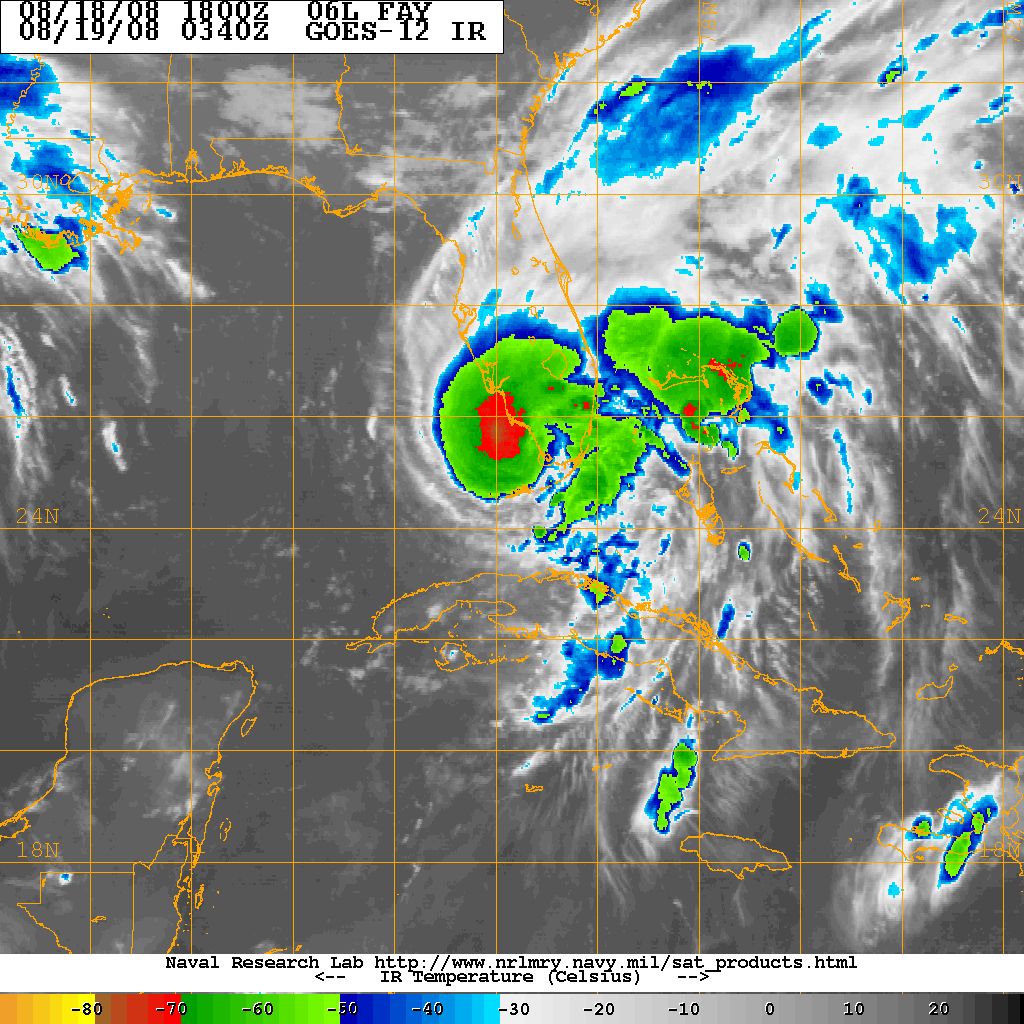
Figure 2.GOES-IR image at time of takeoff |
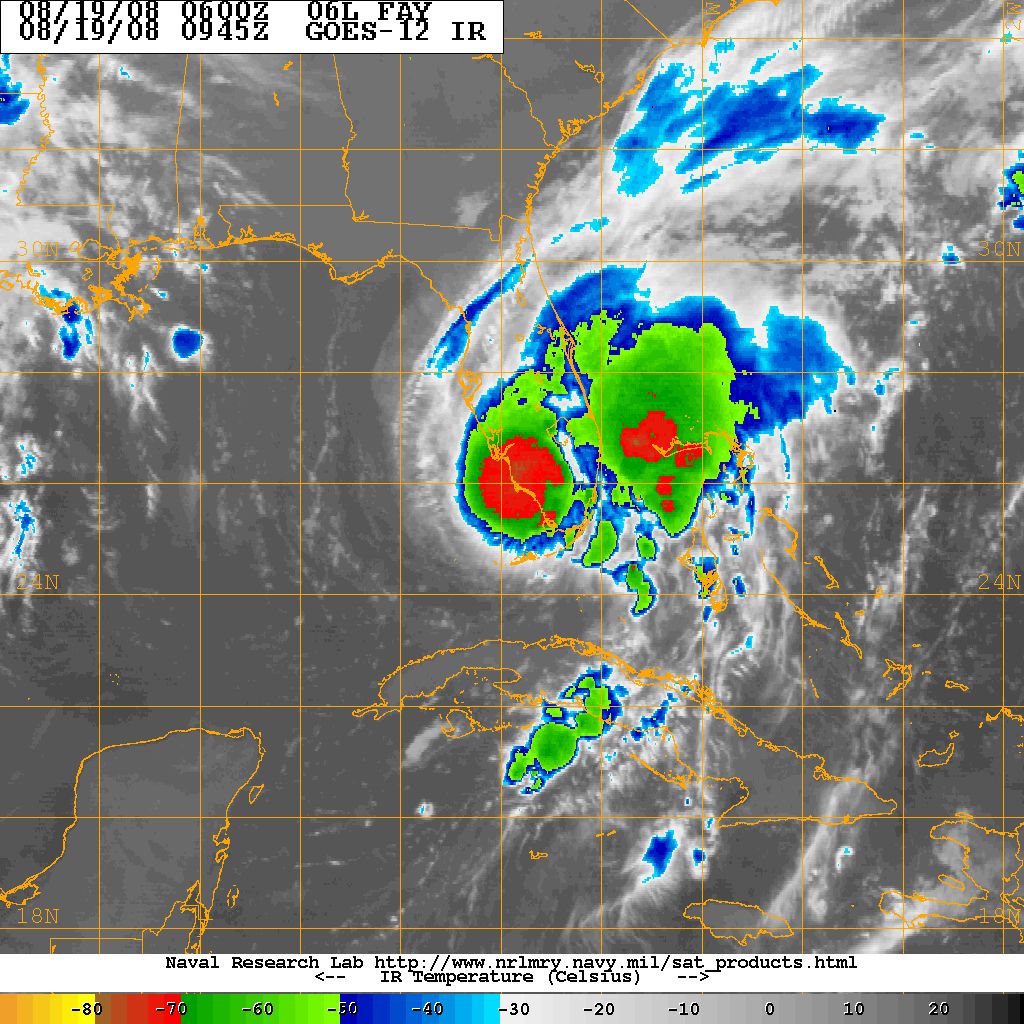
Figure 3.GOES-IR image at time of landing |
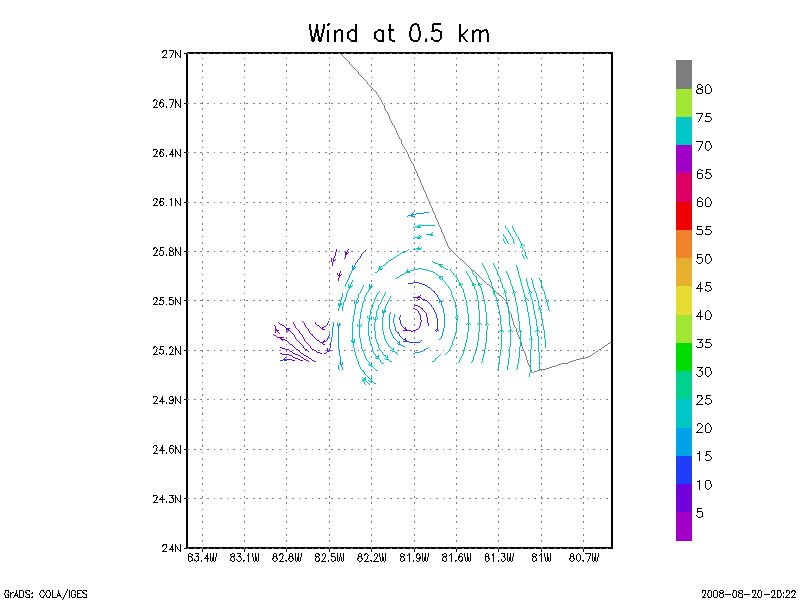
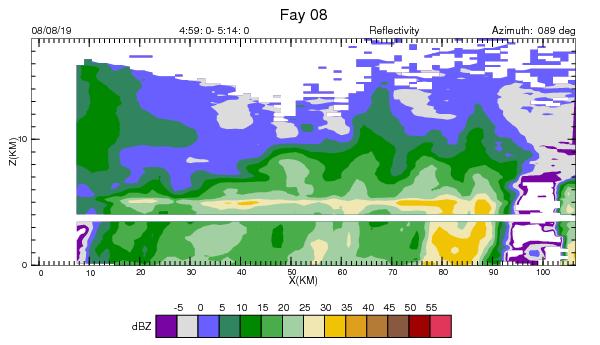
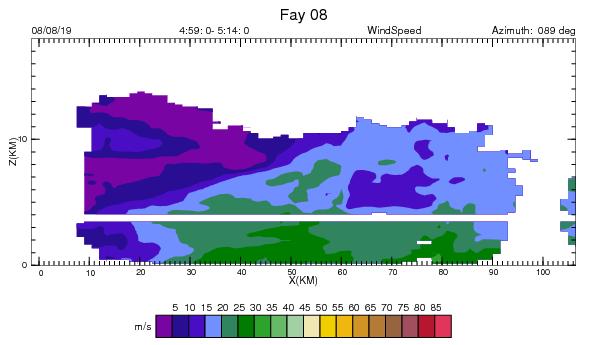
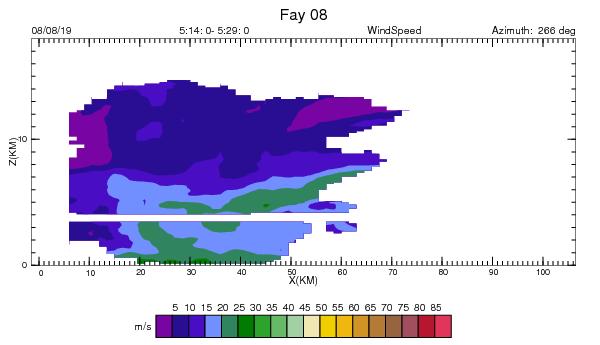
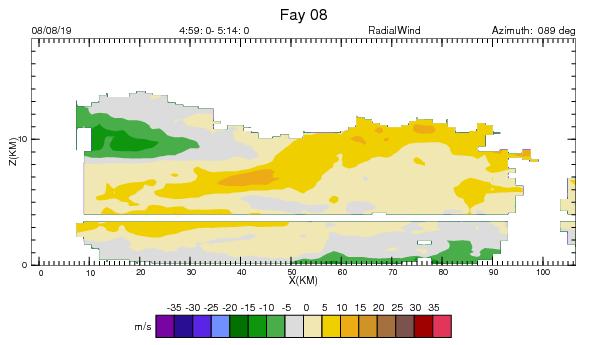
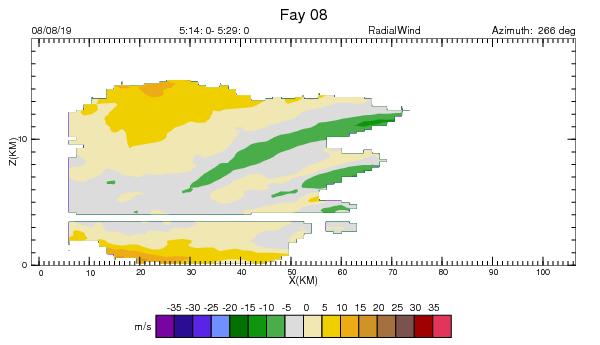
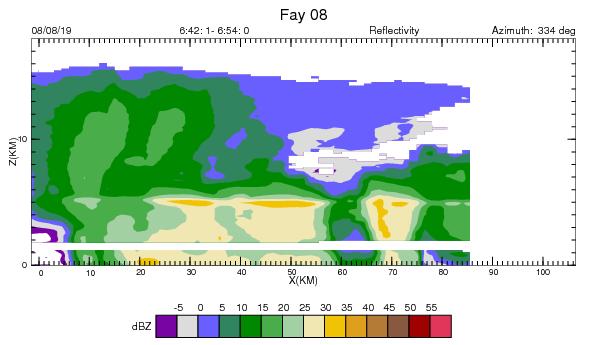
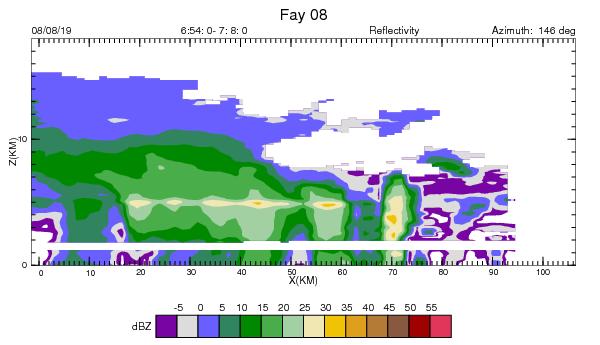
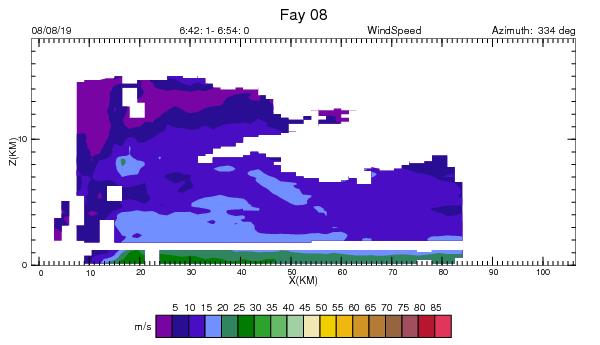
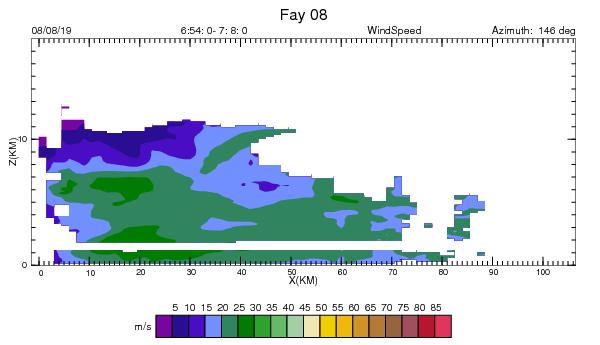
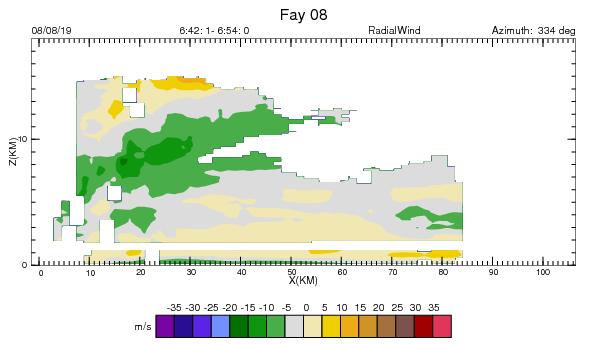
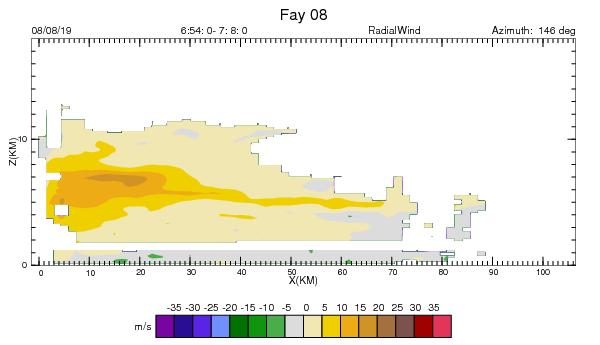
The second pass through the storm center was from east to west. In the radar cross-sections above for the second pass, the inbound is on the left and the outbound is on the right. The storm center is on the left in all the cross-sections. The radial-wind cross-sections showed inflow over the land into the storm, and the winds at 300 m or so were stronger on the inland, eastern half. No sonde was dropped on the eastern side, because there were plenty of radar reflectors all the way out to the end point. A sonde was dropped on the western radius of maximum wind as part of the shallow-bathymetry measurements in support of improved SFMR (Stepped Frequency Microwave Radiometer) estimates of surface wind. Another sonde was dropped farther out in support of SFMR bathymetry, but the sonde failed. Finally, a sonde was launched at the western endpoint of the flight leg, 105 nm west of the storm center, where there was little storm reflectivity.
The start of pass 3 began at 0602 UTC at a heading of 210 from the storm center at 105 nm, with a sonde drop. The third pass took nearly two hours to complete, because when NOAA 43 returned to the center, it performed a coastal survey pattern at approximately 5-10 and 20 nm from the coast of Florida. The northern extent of the survey was west of Marco Island, where a land-based university team was observing Fay, and the southern extent was the southwest tip of mainland Florida, Cape Sable. Several sondes were also launched to probe the wind structure onshore and offshore. Flight level for this portion of the flight was 5,000 ft. After completing the coastal survey, NOAA 42 returned to 12,000 ft, and flew along track 030 over Florida, to the end point of the mission 105 nm northeast of the center, reaching the point at 0751 UTC.
Because Tampa was threatened by a storm surge and high winds, NOAA 43 did not return to MacDill, and landed in New Orleans at 0947 UTC. Although Fay never reached hurricane intensity, the structure actually became more organized, with an eye forming over land several hours after landfall. Over flat Florida, the increased radial inflow apparently helped to organize the storm, although without the ocean energy source, the storm was not able to intensify significantly.
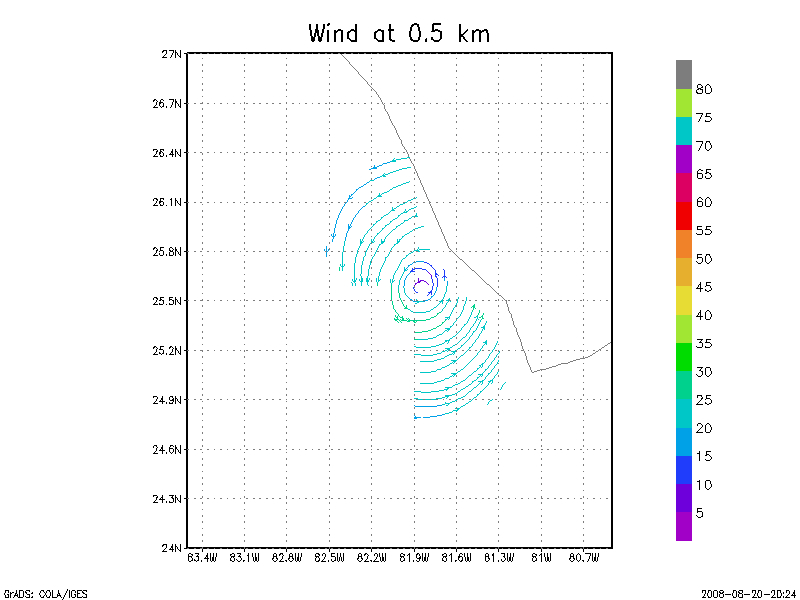
Major new accomplishment: The code obtained from Fuqing Zhang and Yonghui Weng of Texas A&M (Zhang now of Penn State) was adapted for use in real time on the airborne Macintosh laptops. Raw, but quality-controlled, Doppler radials were averaged into superobs and sent to an AOML ftp site for use in a 1.5 km WRF-ARW model run of Tropical Storm Fay. The superobs were successfully assimilated in the WRF model, and a forecast was produced a few hours after the observations were made.
John Gamache (Radar/Dropsonde Scientist on this mission) for LPS Michael
Black.
9/18/08
Mission Data :
Transmitted Dropsondes
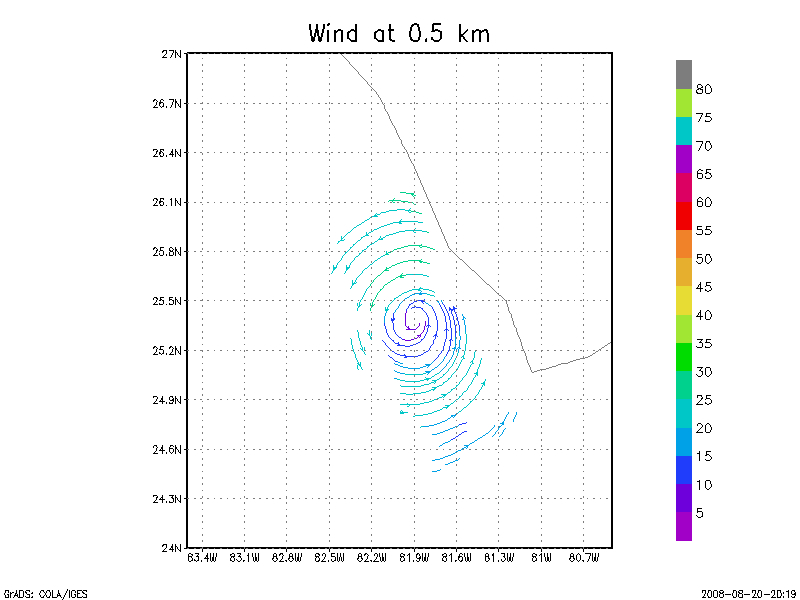
First Real-Time Analysis—Pass 1 (Pt. 1 – Pt. 2)


Second Real-Time Analysis—Pass 2 (Pt. 3 – Pt. 4)

Third Real-Time Analysis—Coastal Survey
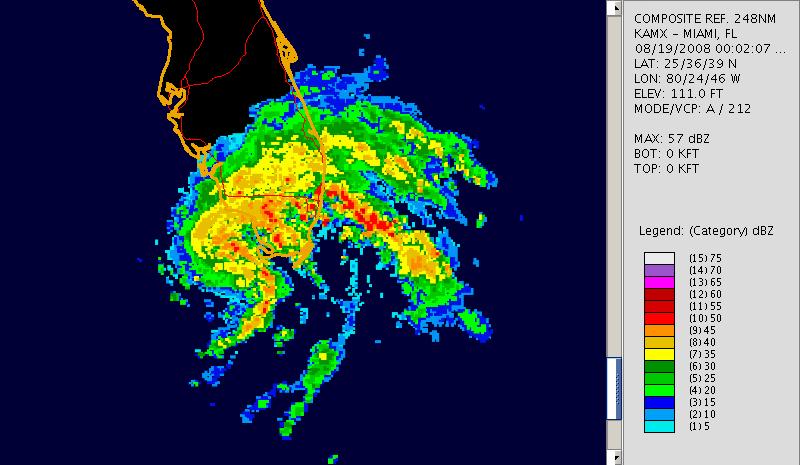
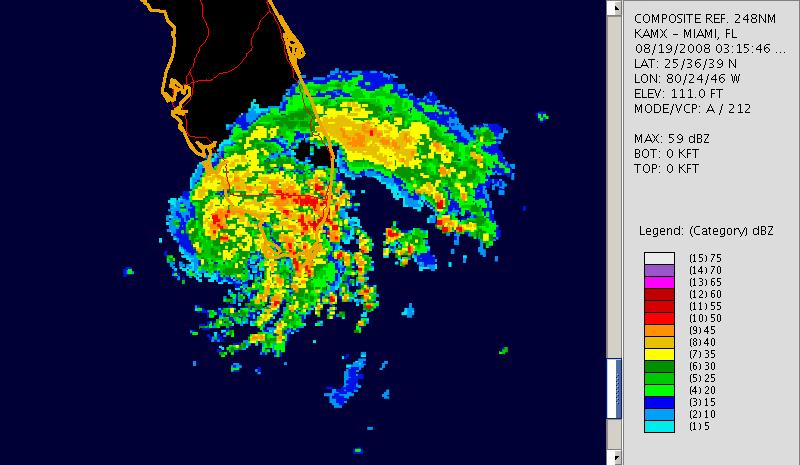
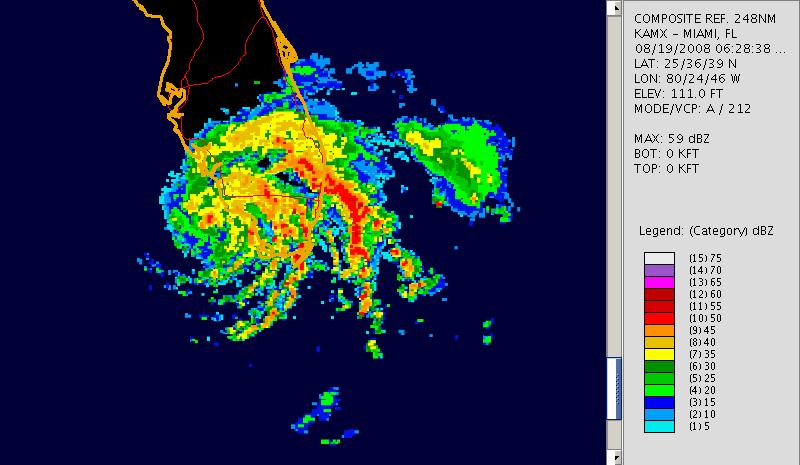
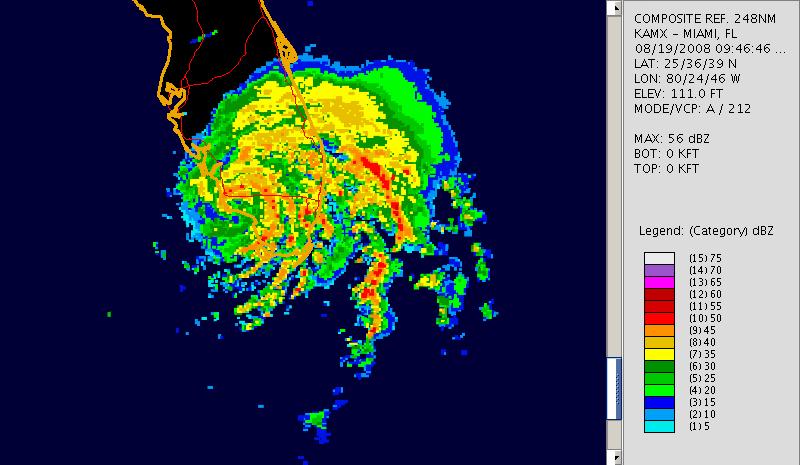
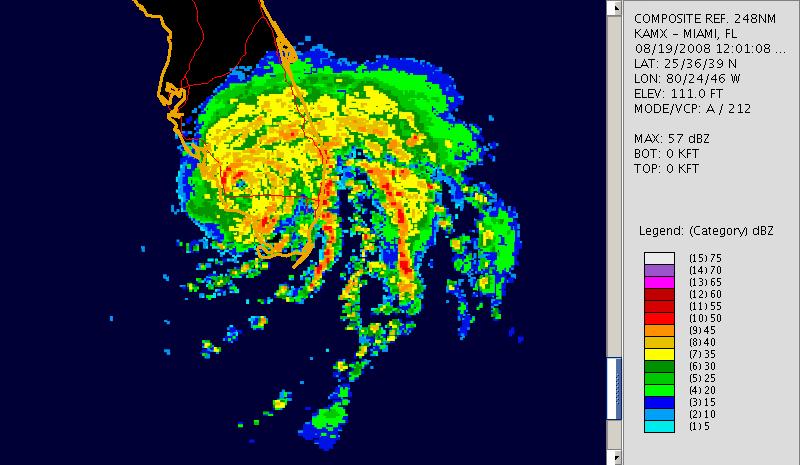
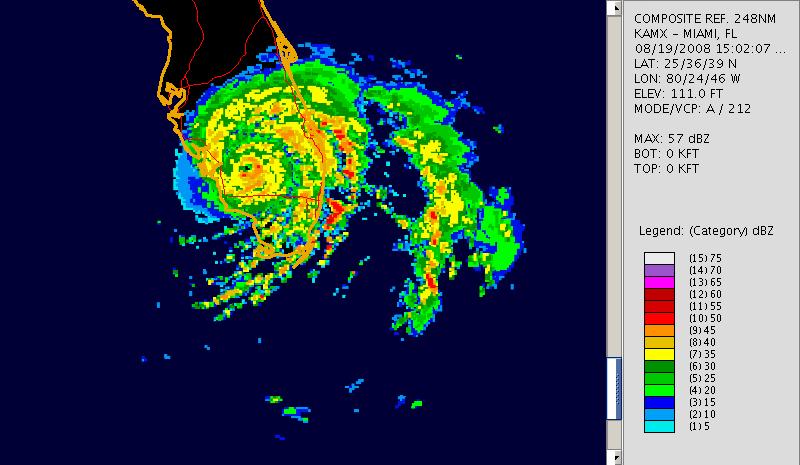
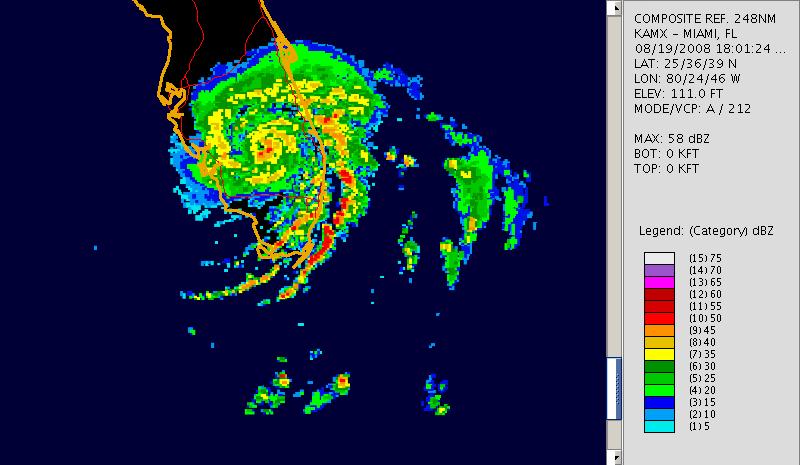
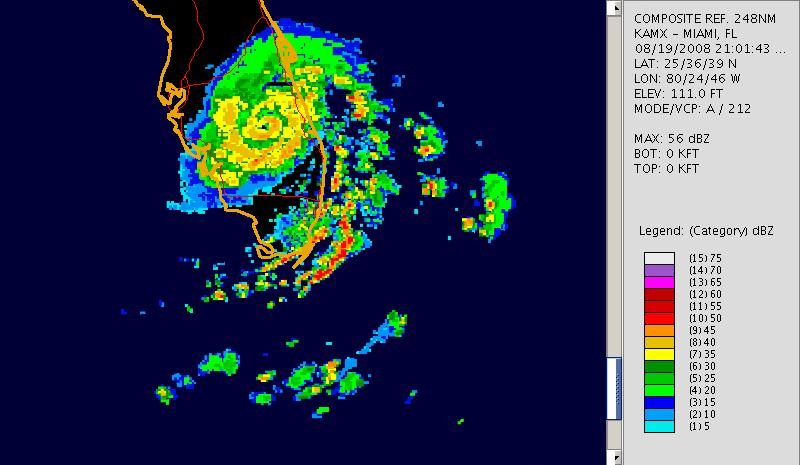
Miami Radar composites
NetCDF listing |
||
Flight Data Plots | ||
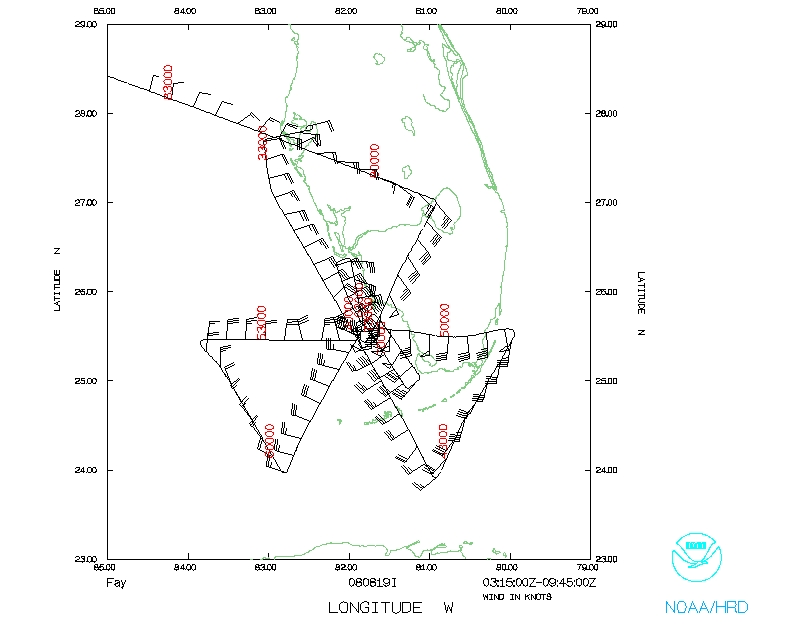 Flight track |
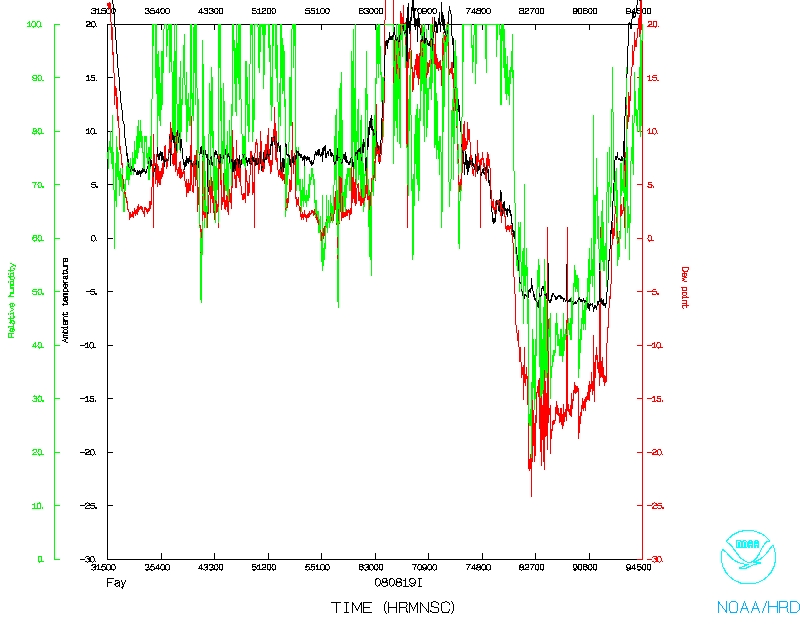 Temperature and Moisture |
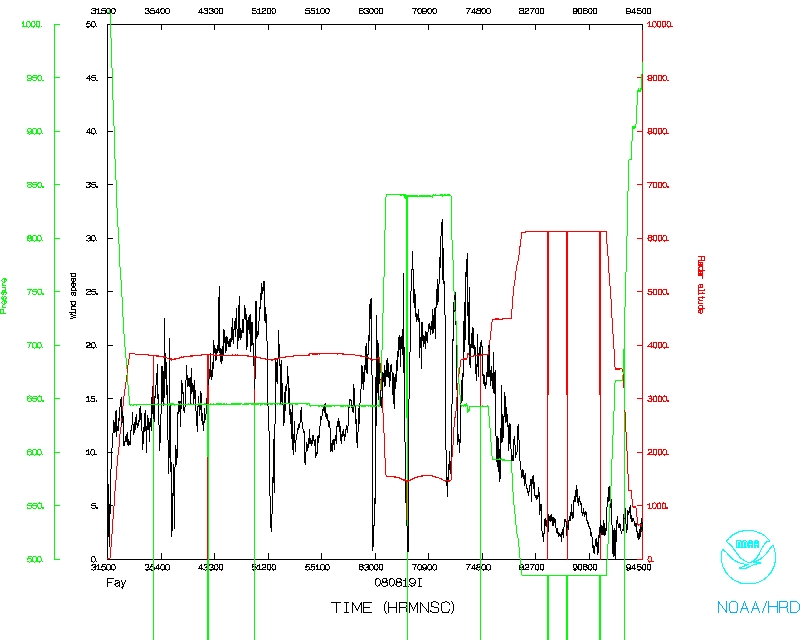 Wind and Atlitude |
Return to Fay page.