Mission Summary
20150826I2 Aircraft 43RF
SALEX mission Storm Erika
Aircraft Crew (43RF)
| Aircraft Commander | Scott Price
|
| Co-pilot | Pat Didier
|
| Co-pilot | Nate Kahn
|
| Navigator | Jason Siegel
|
| Flight Director | Ian Sears
|
| Flight Engineer | Joe Klippel
|
| Flight Engineer | Chris LaLonde
|
| Data Technician | Dana Naeher
|
| Elec. Technician | Jeff Smith
|
| Elec. Technician | Bobby Peek
|
Scientific Crew (43RF)
| Lead Scientist | Sim Aberson
|
| Radar Scientist | Paul Reasor
|
| Doppler Wind Lidar Scientist | Lisa Bucci
|
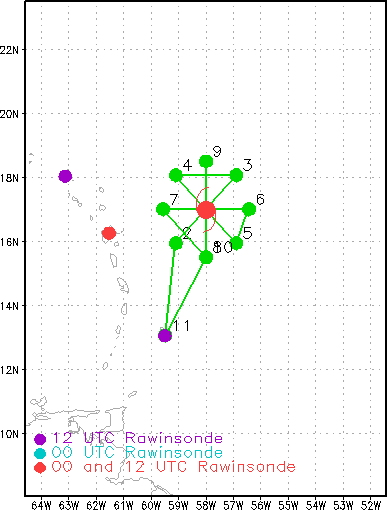
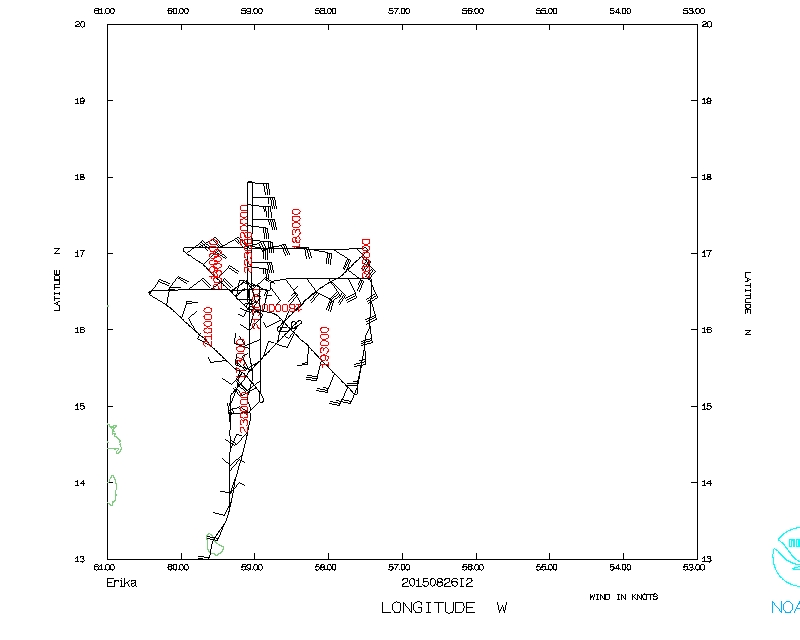
Figure 1: Initial flight plan for the mission into Tropical
Storm Erika. Green dots are the turn points. Purple and red
dots represent locations of rawinsonde observations.
|
Mission Plan :
An Environmental Modeling Center-tasked Tail Doppler Radar (TDR) Mission into
Tropical Storm Erika, which wcontinued moving westward toward the Leeward
Islands. The plan was for a rotatedfigure-4 pattern (90 nmi legs) with four
passes through the center of Erika with a final pass toward the return to
Barbados (Fig. 1).
SALEX MISSION PLAN: Erika
Prepared by the Hurricane Research Division
August 20, 2015
Aircraft: N43RF
Proposed takeoff: 26/1700Z
|
TURN LOCATION TABLE
|
| #
| LAT
| LON
| RAD/AZM
| LEG
| TOTAL
| Time
|
|
| deg min
| deg min
| naut mi/deg
| nmi
| nmi
| hr:min
| | 1 | BARBADOS | | 0. | 0. | 0:01
| | 2S | 15 56 | 59 06 | 90/225 | 175. | 175. | 0:45
| | 3S | 18 04 | 56 54 | 90/045 | 180. | 354. | 1:31
| | 4S | 18 04 | 59 06 | 90/315 | 126. | 481. | 2:03
| | 5S | 15 56 | 56 54 | 90/135 | 180. | 661. | 2:49
| | 6S | 17 00 | 56 26 | 90/090 | 69. | 730. | 3:07
| | 7S | 17 00 | 59 34 | 90/270 | 180. | 910. | 3:53
| | 8S | 15 30 | 58 00 | 90/180 | 128. | 1037. | 4:25
| | 9S | 18 30 | 58 00 | 90/000 | 180. | 1217. | 5:11
| | 10S | 15 30 | 58 00 | 90/180 | 180. | 1397. | 5:56
| | 11 | BARBADOS | | 171. | 1568. | 6:32
| |
Mission Summary :
| Take off
| Landing
| Barbados, BWI | 16:55 UTC
| Barbados, BWI | 23:27 UTC
| |
At the beginning of the mission, Erika was located about 395 km east of Antigua
in the Leeward Islands and moving westward at 28 km h1 . The maximum sustained
wind speed remained 75 km h1 , making it a weak tropical storm, and the
minimum central pressure was estimated to be 1005 hPa. Convection had been
decreasing near the core, with most convection off to the south suggesting
moderate to strong wind shear.
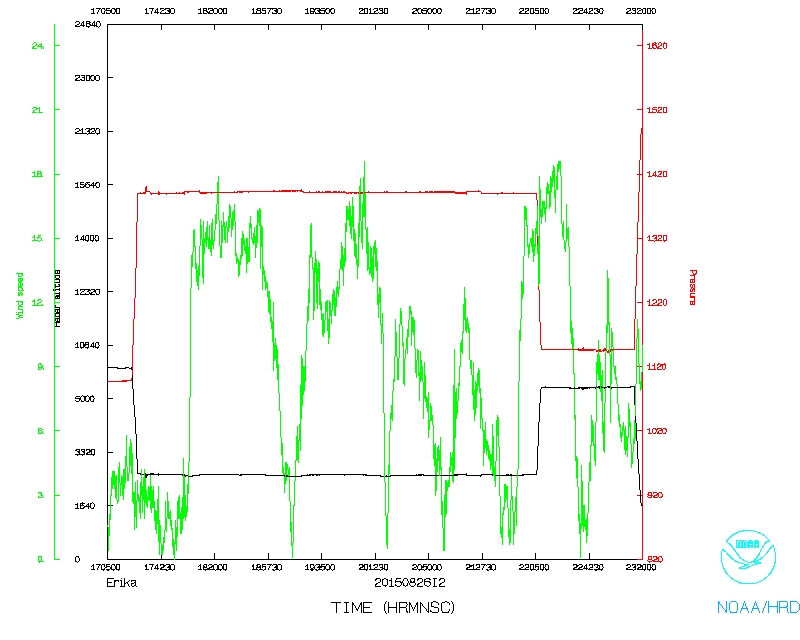
The mission was conducted at 5000 ft altitude, lower than other missions, due
to fix requirements from the National Hurricane Center. Even so, fixing a
center was difficult during the mission, and, during three passes, the aircraft
had to complete u-turns to find the center. The final pass was conducted at
10,000 feet altitude so that the Air Force Reconnaissance aircraft could fix
the storm at 5000 ft at that time. None of the dropwindsondes released during
the mission found tropical-storm-force winds at the surface. Easterly winds
during the final pass, especially north of the center, were much stronger than
those lower down, suggesting the impact of a jet containing dry air from the
Sahara.
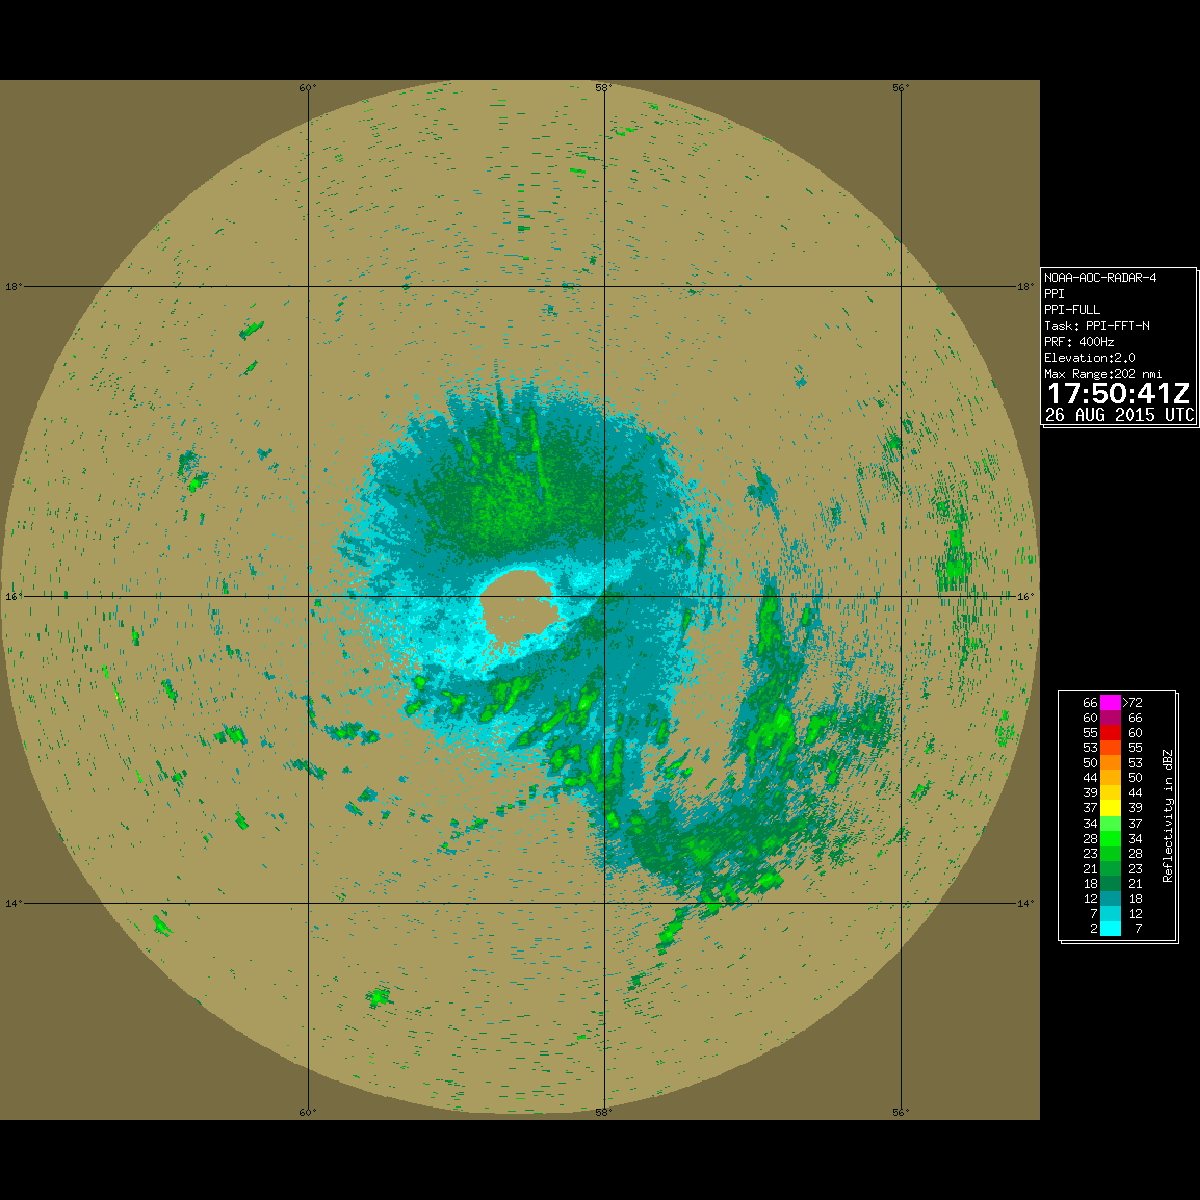
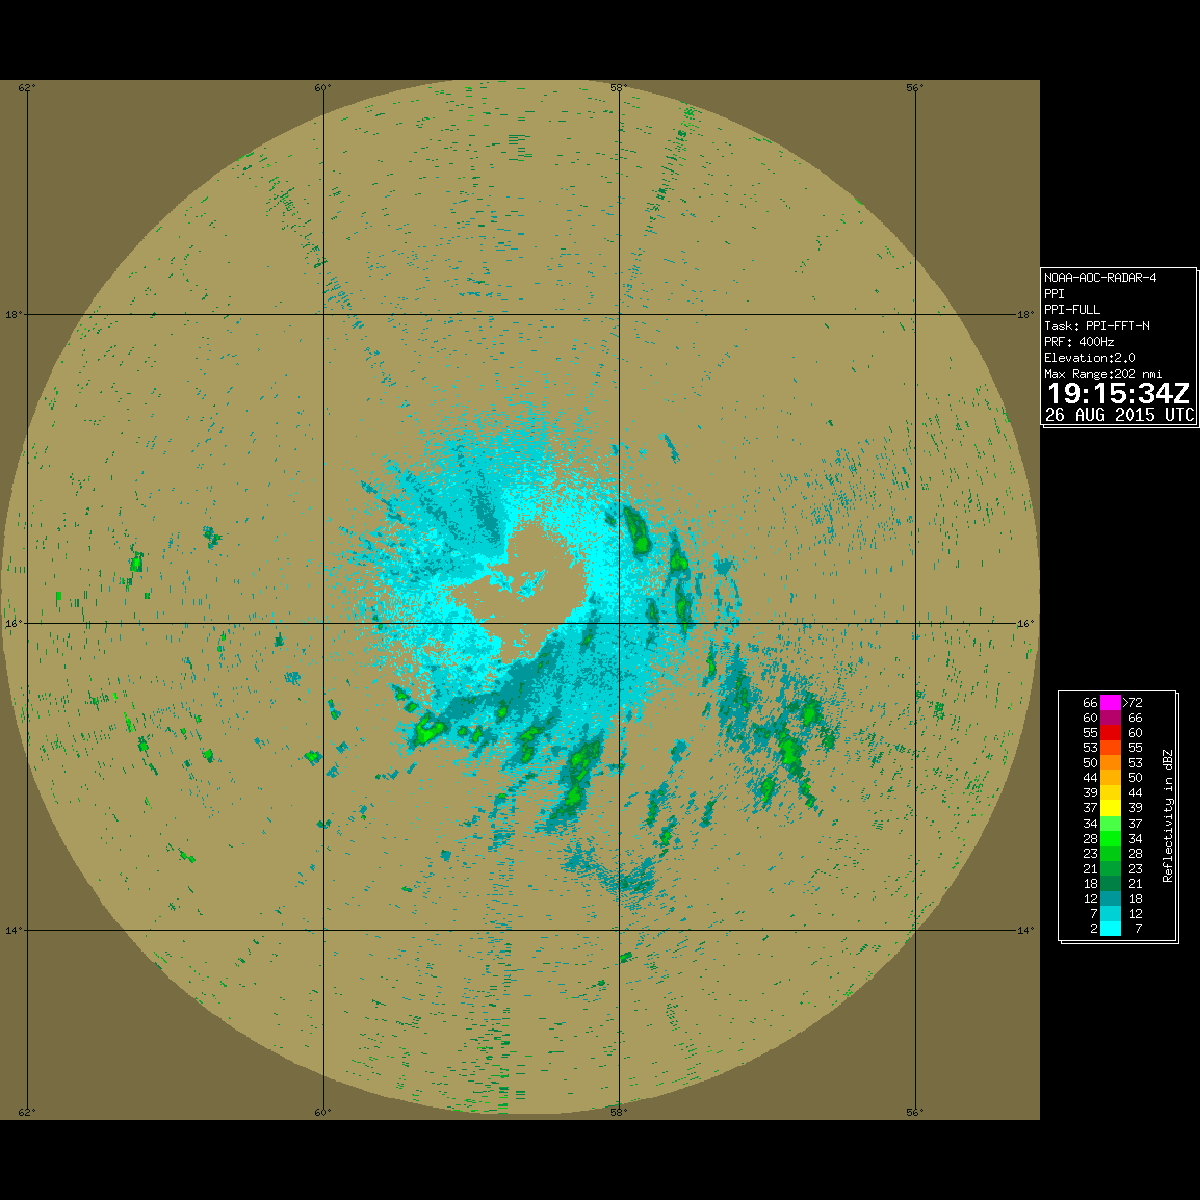
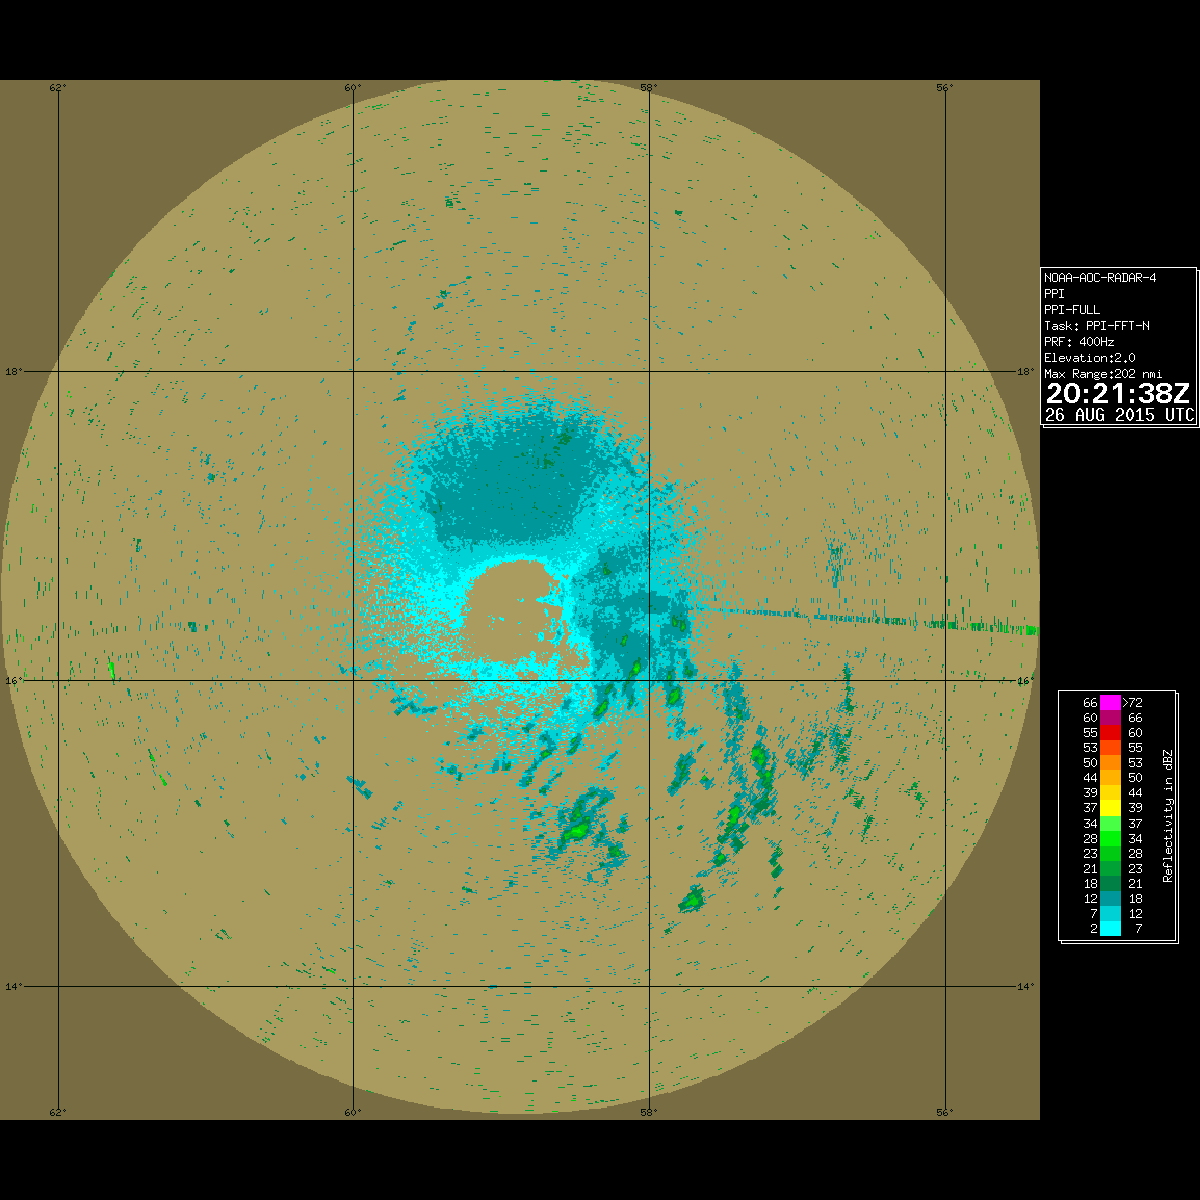
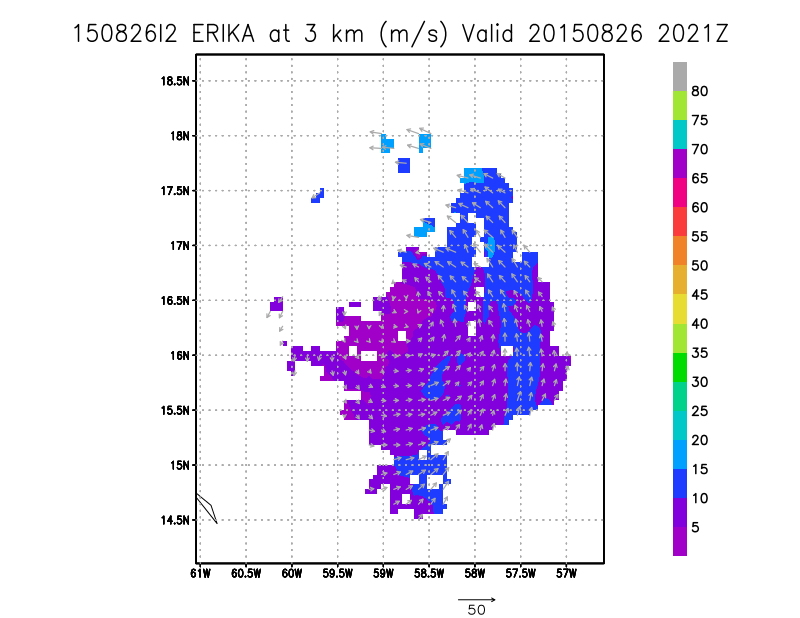
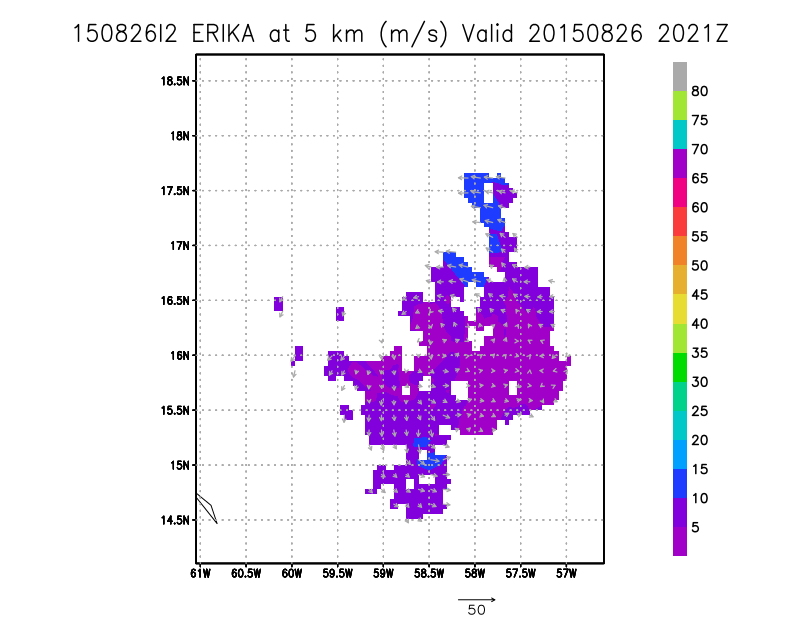
During the mission, most of the moderate convection was located to the
southeast of the fixed center (Fig. 2). The intensity and coverage of the
convection was decreasing between the first and third pass, and increasing
through the remainder of the flight. During the final pass, strong convection
developed near the center, and was the strongest seen during all the flights
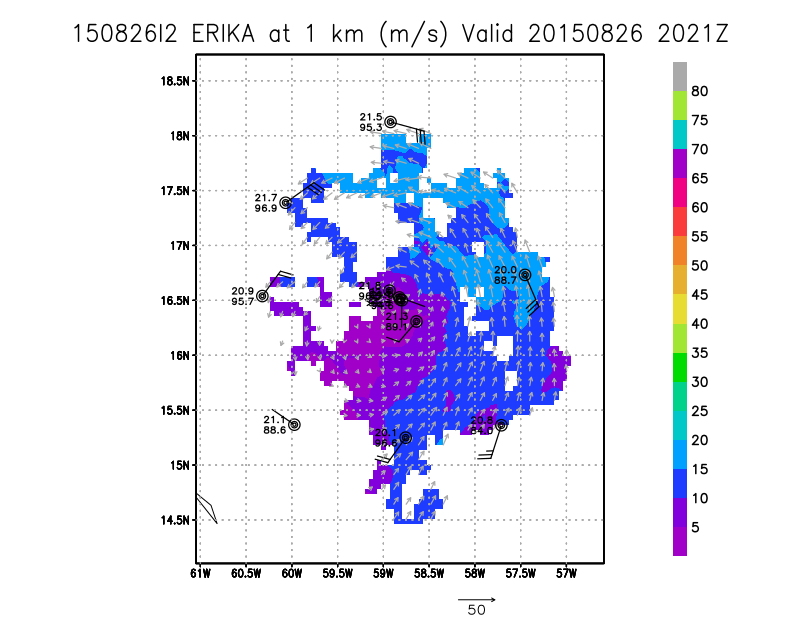
this crew experienced in Erika. Radar data coverage (Fig. 3) was much improved
over previous flight. A distinct tilt in the location of the center of Erika
was seen in the radar analyses.
Sim Aberson
Sept. 3, 2015
Mission Data :
Lead Scientist's log |
Radar Scientist's log |
Dropsonde Scientist's log
Flight Director's log |
1 second data |
Flight Director's manifest |
NetCDF data |
serial data
Page last updated December 3, 2015
Return to Mission page.