Mission Summary
20150825I1 Aircraft 43RF
SALEX mission Storm Erika
Aircraft Crew (43RF)
| Aircraft Commander | Scott Price
|
| Co-pilot | Pat Didier
|
| Co-pilot | Nate Kahn
|
| Navigator | Jason Siegel
|
| Flight Director | Ian Sears
|
| Flight Engineer | Joe Klippel
|
| Flight Engineer | Chris LaLonde
|
| Data Technician | Dana Naeher
|
| Elec. Technician | Jeff Smith
|
| Elec. Technician | Bobby Peek
|
Scientific Crew (43RF)
| Lead Scientist | Paul Reasor
|
| Radar Scientist | Sim Aberson
|
| Doppler Wind Lidar Scientist | Lisa Bucci
|
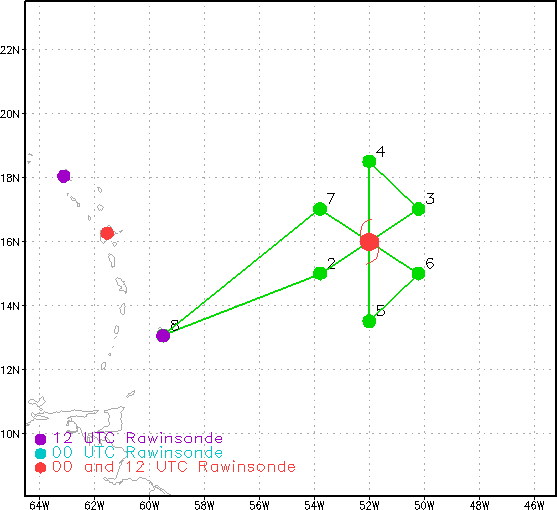
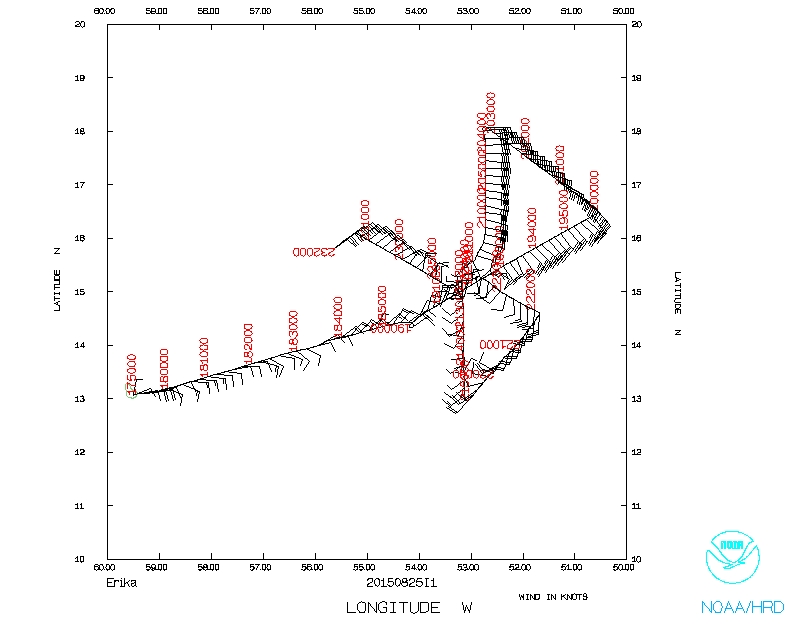
Figure 1: Initial flight plan for the mission into Tropical Storm Erika.
Green dots are the turn points. Purple and red dots
represent locations of rawinsonde observations.
|
Mission Plan :
An Environmental Modeling Center-tasked Tail Doppler Radar (TDR) Mission into
Tropical Storm Erika, which was moving rapidly westward toward the Leeward
Islands. The plan was for a butterfly pattern (90 nmi legs) with three passes
through the center of Erika with a return to Barbados (Fig. 1).
SALEX MISSION PLAN: Erika
Prepared by the Hurricane Research Division
August 24, 2015
Aircraft: N43RF
Proposed takeoff: 25/1800Z
|
TURN LOCATION TABLE
|
| #
| LAT
| LON
| RAD/AZM
| LEG
| TOTAL
| Time
|
|
| deg min
| deg min
| naut mi/deg
| nmi
| nmi
| hr:min
| | 1 | BARBADOS | 0. | | 0. | 0:01
| | 2S | 15 00 | 53 47 | 120/240 | 352. | 352. | 1:29
| | 3S | 17 01 | 50 12 | 120/060 | 240. | 592. | 2:30
| | 4S | 18 30 | 52 00 | 150/000 | 136. | 728. | 3:05
| | 5S | 13 30 | 52 00 | 150/180 | 300. | 1028. | 4:20
| | 6S | 15 00 | 50 13 | 120/120 | 137. | 1166. | 4:55
| | 7S | 17 01 | 53 48 | 120/300 | 240. | 1406. | 5:56
| | 8 | BARBADOS | | 407. | 1813. | 7:18
| |
Mission Summary :
| Take off
| Landing
| Barbados, BWI | 17:49 UTC
| Barbados, BWI | 00:22 UTC
| |
|
|
|
|
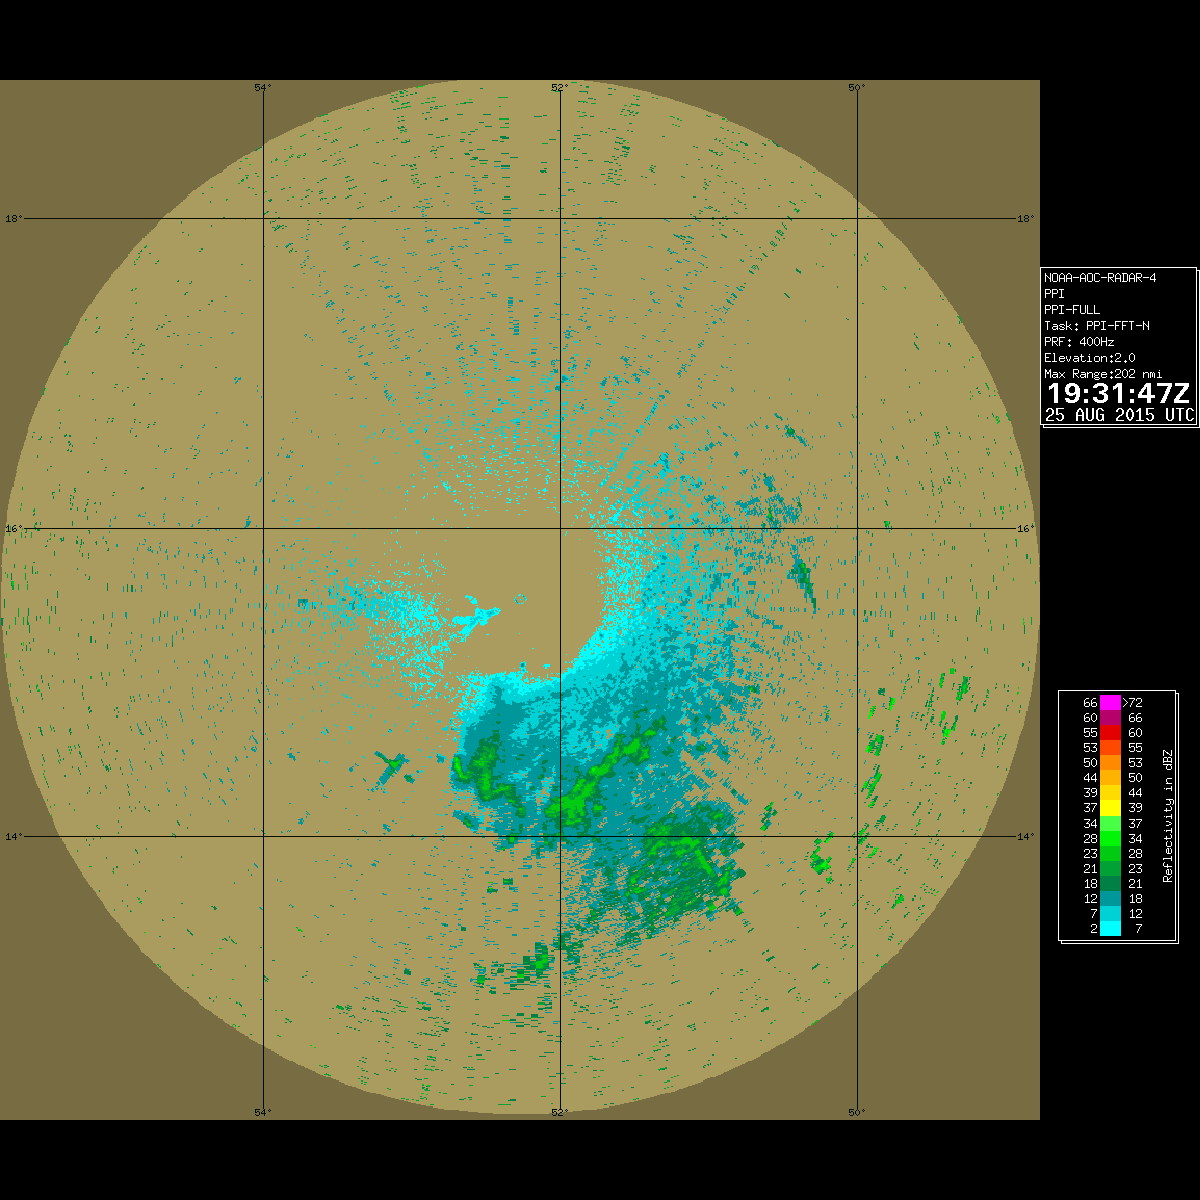
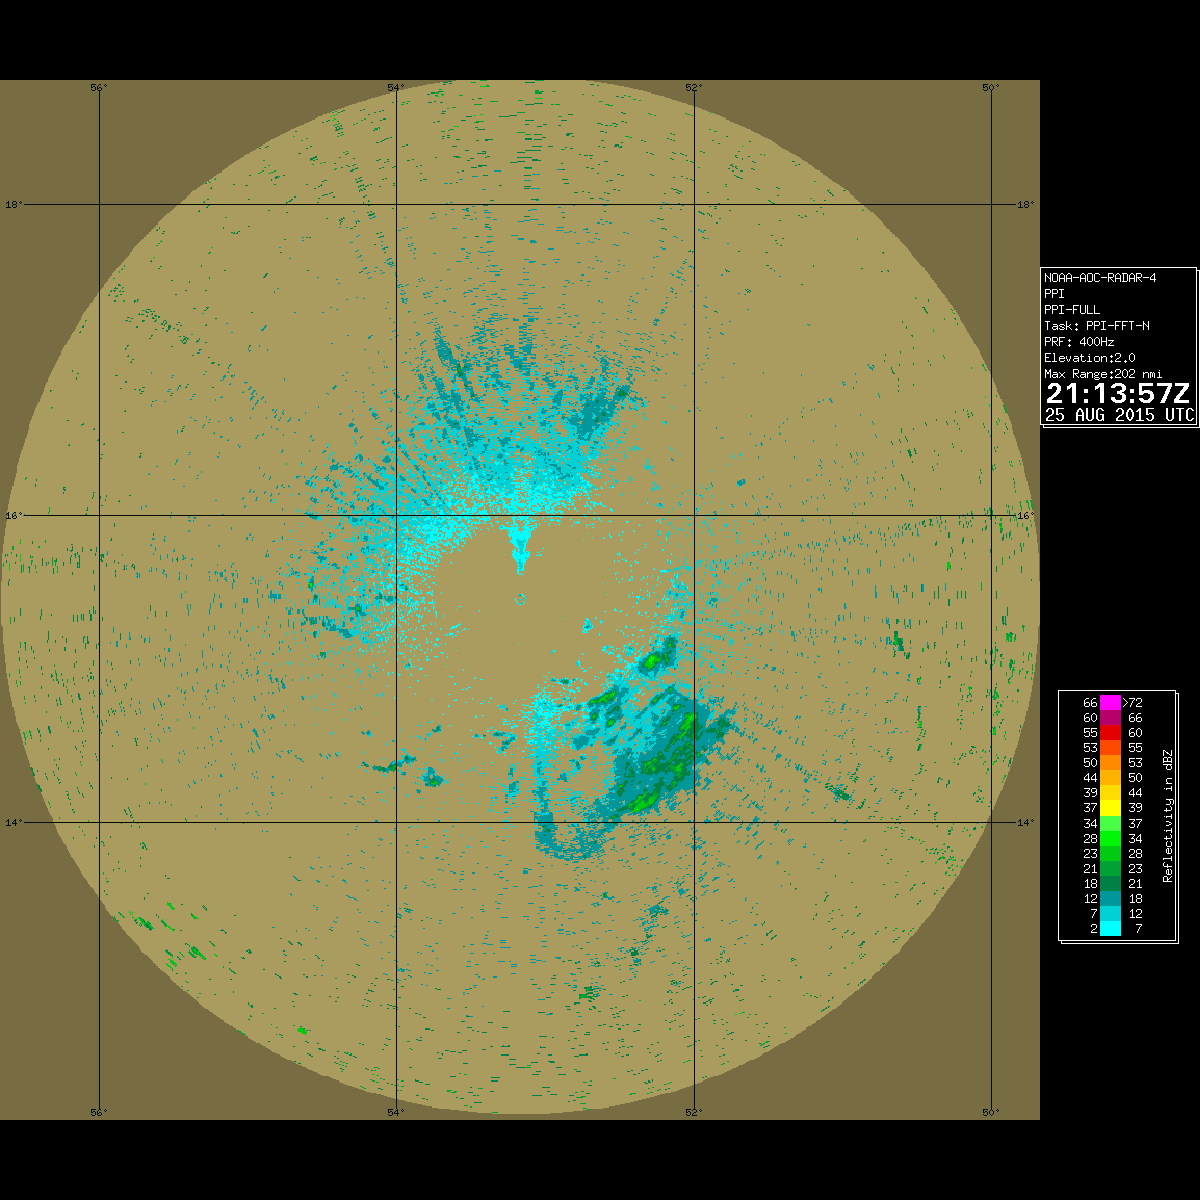
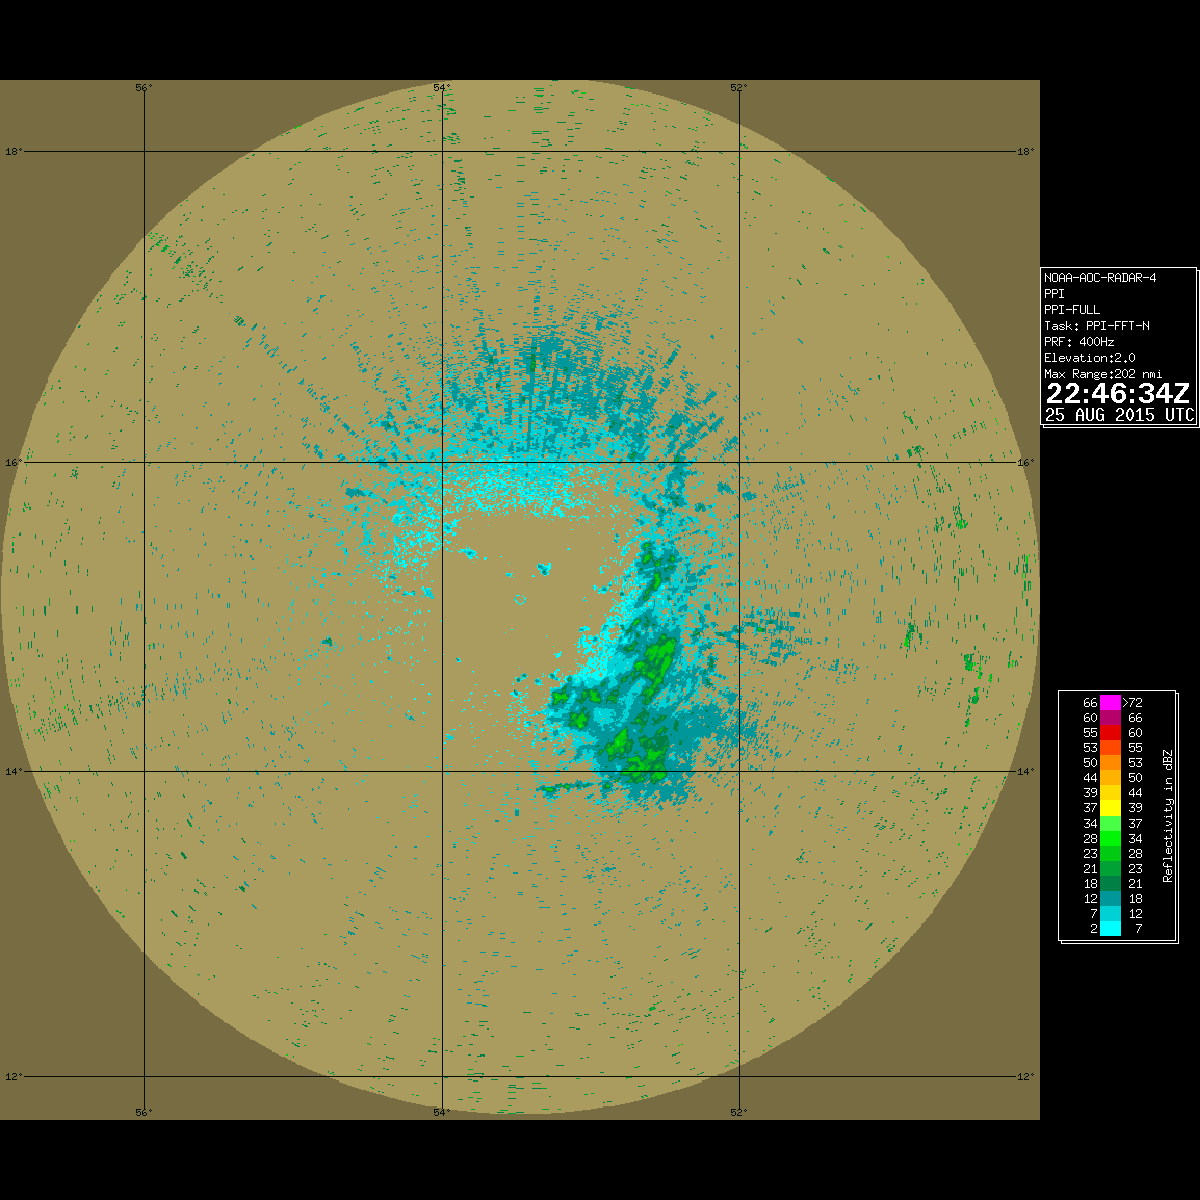
Figure 2: Reflectivity from the lower-fuselage radar at the times
closest to the three center fixes.
|
At the beginning of the mission, Erika was located about 1030 km east of the
Leeward Islands and moving rapidly westward at 31 km h1 . The maximum sustained
wind speed was 75 km h1 , making it a weak tropical storm, and the minimum
central pressure was estimated to be 1003 hPa. Convection had been decreasing
near the core, with most convection off to the south suggesting moderate to
strong wind shear. Satellite-based humidity data did not show much dry air
near the core of Erika, suggesting the possibility of some slow intensification
despite the shear. During the mission, convection waned as the time approached
local convective minimum, and the center became exposed on the northern edge
of the convection. Reflectivity from the lower-fuselage radar (Fig. 2) showed
moderate convection mainly to the southeast of the center with little banding
structure evident. None of the dropwindsondes released reported winds of
tropical-storm force at the surface.
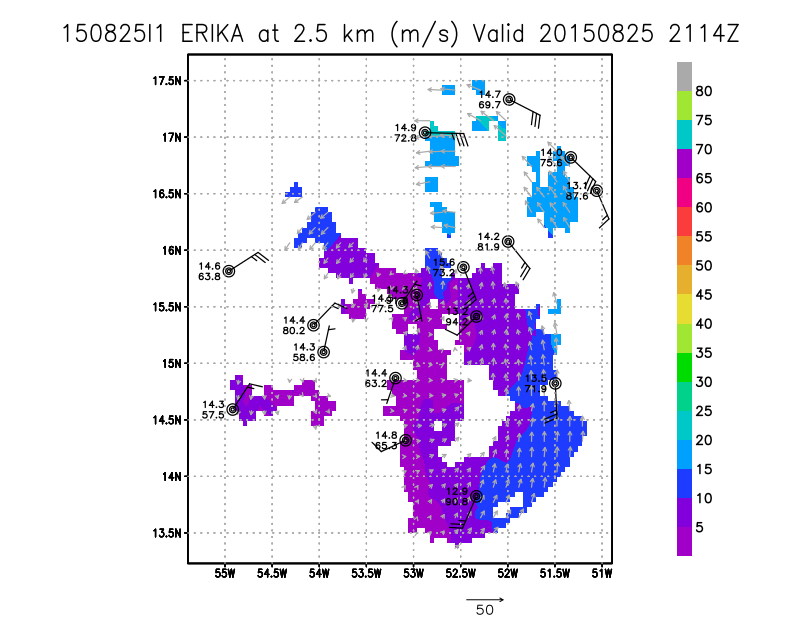
Figure 3: Doppler radar/dropwindsonde storm-relative composite
of Tropical Storm Erika valid 2114 UTC 25 August.
|
In support of the commensurate Saharan-Air Layer Experiment from the NOAA G-IV,
additional dropwindsondes were released in gradients of humidity at flight
level. Though satellite-based humidity observations did not show dry air within
the core of Erika, dropwindsonde observations showed regions with relative
humidity values below 60% (Fig. 3), explaining the inability of Erika to
intensity. Three radar analyses and 19 dropwindsonde reports were successfully
transmitted during the mission.
Problems :
Sim Aberson
Sept. 3, 2015
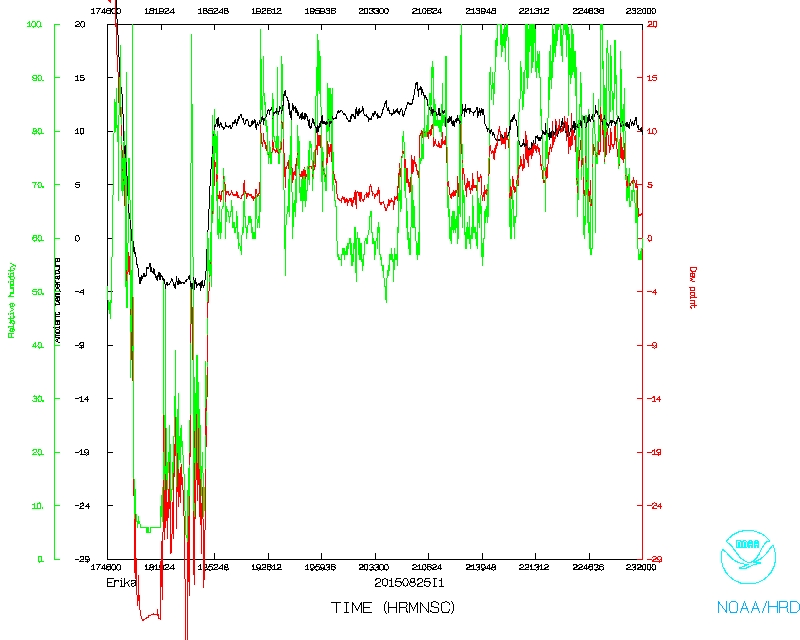
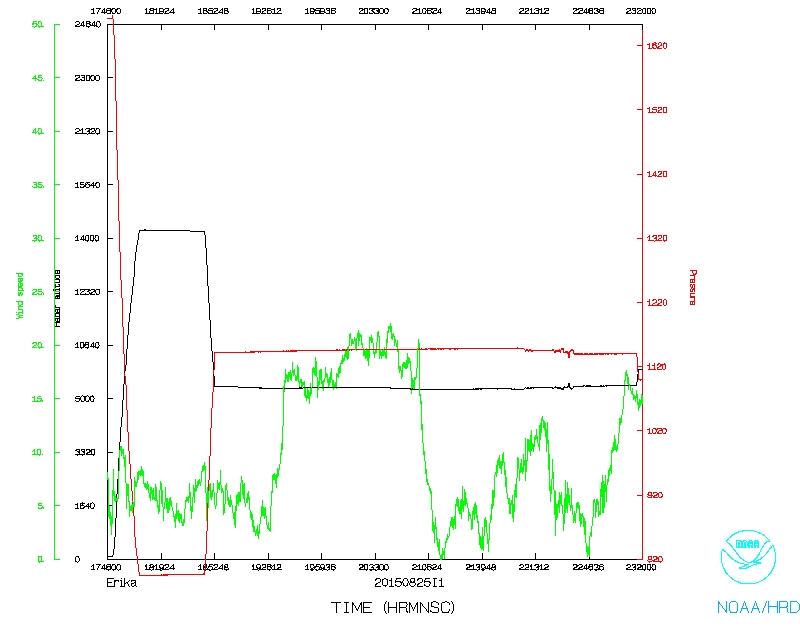
Mission Data :
Lead Scientist's log |
Radar Scientist's log |
Dropsonde Scientist's log
Flight Director's log |
Flight Director's manifest |
NetCDF data |
1 second data |
serial data
Page last updated December 03, 2015
Return to Mission page.