Proposed track
| Aircraft Commander | Justin Kibbey |
| Co-pilot | Catherine Martin |
| Co-pilot | Scott Price |
| Navigator | Pete Siegel |
| Flight Engineer | Joe Klippel |
| Flight Engineer | Paul Darby |
| Flight Director | Rich Henning |
| Flight Director | Kristie Twining |
| System Engineer | Steven Paul |
| Data Technician | Joe Bosko |
| AVAPS | Todd Richards |
| Observer | Anita Lopez (OMAO) |
| LPS | Joe Cione (HRD) |
| Radar | Evan Kalina (UColo) |
| Dropsonde | Jason Dunion (HRD) |
| CCN spectra | Luke Ziemba (NASA) |
| COYOTE | Eric Redweick (Sensintel) |
| COYOTE | Drew Osbrink (Sensintel) |
Mission Plan :
NOAA43 will conduct both an HRD-tasked Model Evaluation/COYOTE mission into Hurricane Edouard. Takeoff is scheduled for 1100 UTC from Bermuda and recover there at 1900 UTC.
Mission Summary :
| Take off | Landing
| Bermuda
| 11:10 UTC
| Bermuda
| 19:19 UTC
| Penetrations
| 2
| | ||||
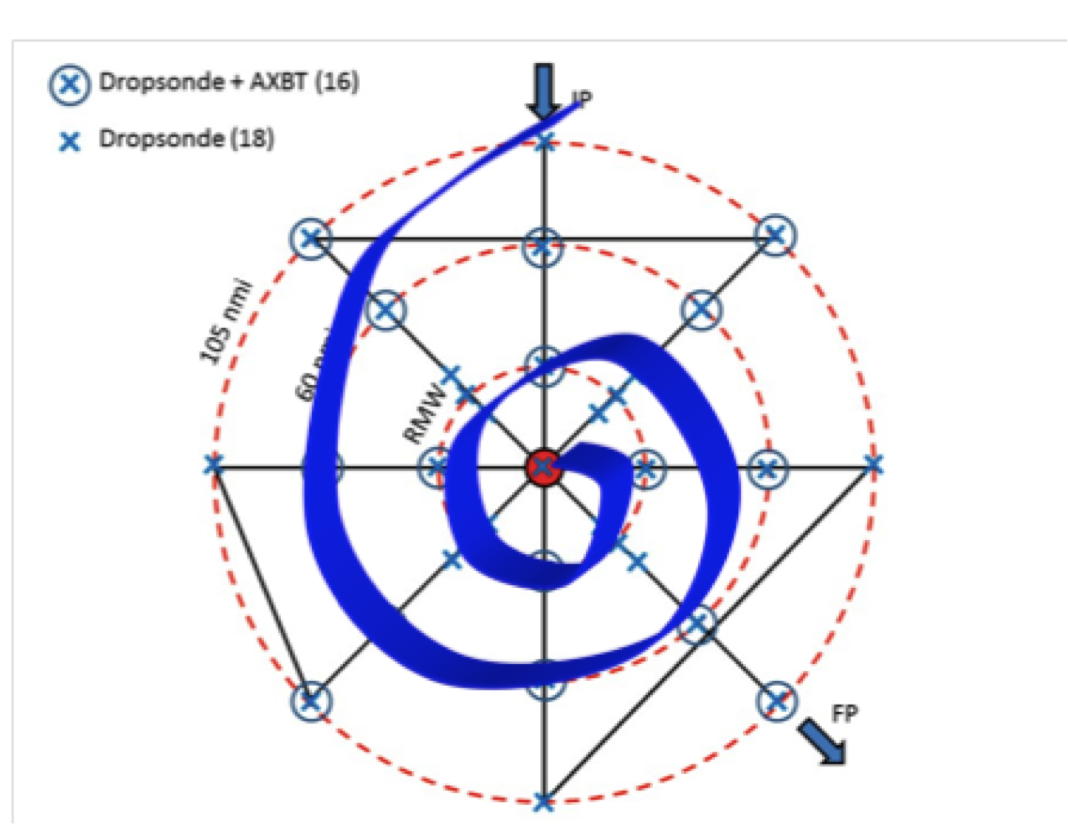
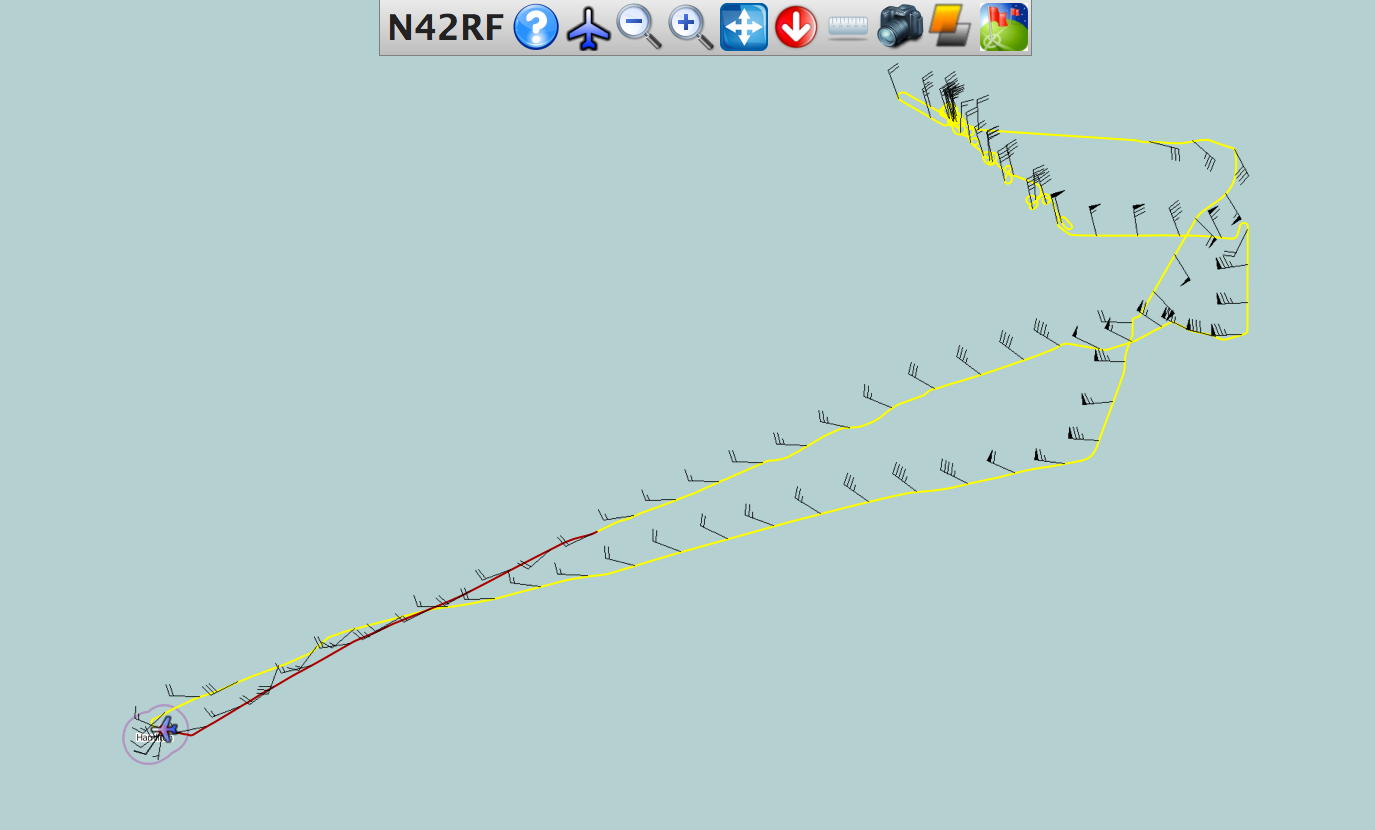
This is a schematic of the proposed flight pattern we would plan to fly for
such an experiment. In actuality the number of loops or spirals would be less
than shown.
On September 17th, a second successful Coyote UAS mission was conducted in Hurricane Edouard. This time, the experimental design was to send the UAS along an inflow channel similar to what an air parcel might experience as it spirals towards the storm"s center of circulation.
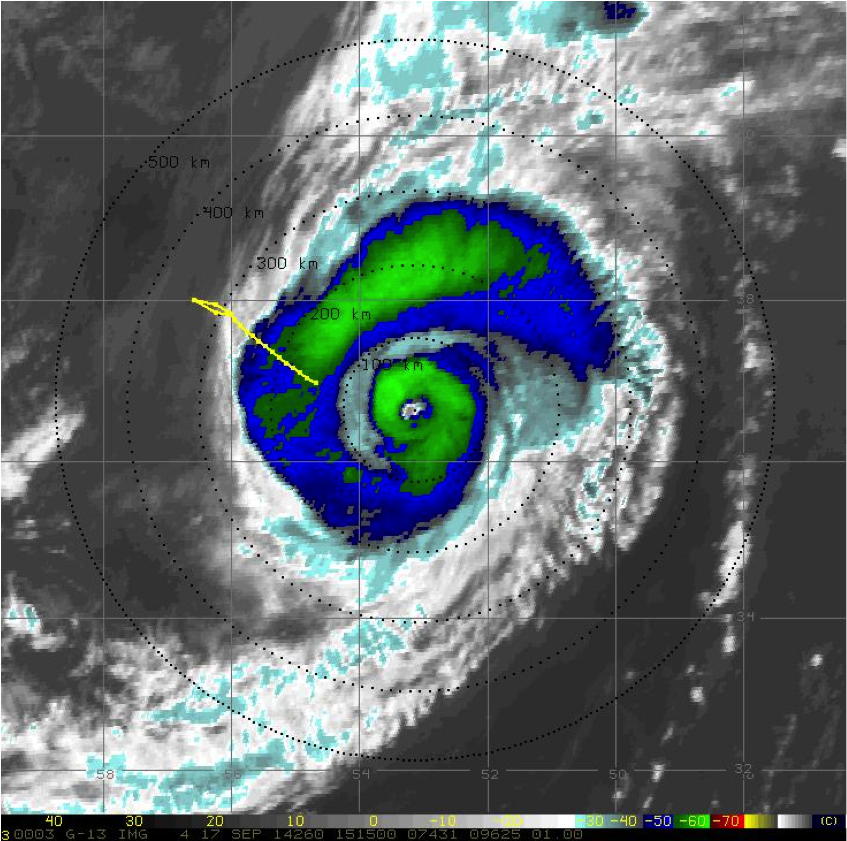
Unlike the first Coyote UAS mission from the day before, our team flew what is known as an "inflow mission" into Hurricane Edouard. This is to say we tried to spiral in to the storm center, initially, from far away. This inflow conop is highly unique and not possible (especially at these dangerous altitudes) using any other platform. The main science reason we wanted to conduct an inflow experiment was so that we could "mimic" what Mother Nature does all the time in hurricanes. If you look at any hurricane satellite picture you will (quickly) see the spiraling nature of the storm circulation. What is happening at low levels, is the air from far away is drawn to the lower pressure found at the storm center. Due to the Coriois force (which is there because the Earth rotates), the air from far away will slowly spiral in until it eventually makes its way to the strongest region of the storm (known as the eyewall). This Coyote experiment attempts to copy what Nature does in this respect. We started this experiment a good distance away and attempted to spiral (like the air) into the highest wind region. Using a unique platform like a low altitude UAS we also have the ability to "profile" (go up and down) on our way inward so as to capture a deeper layer (instead of just the near surface) of the storm inflow environment (~0-3000ft).
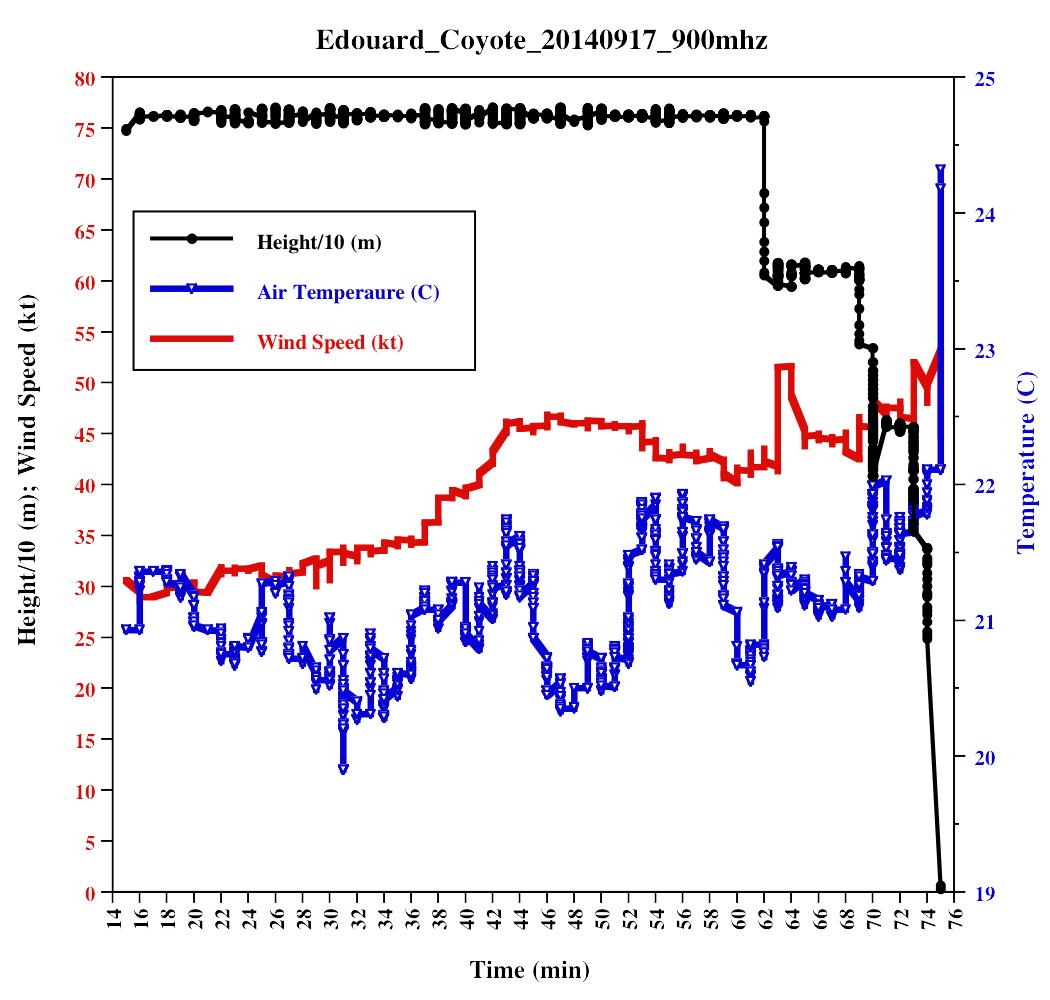
This second flight set endurance records for the Coyote platform as it remained airborne within the hurricane boundary layer for 68 minutes (at controlled altitudes ranging from 1200-2500ft). It is also worth noting that in addition to atmospheric measurements of wind speed, wind direction, pressure, temperature and humidity, the ItriCorp meteorological payload captured a "surprise/bonus" in-situ measurement in the form of sea surface temperature as it expired into the ocean.
17 dropsondes, 8 AXBTs, and 2 COYOTEs deployed. 1 bad sonde and 4 bad AXBTs, so 16 dropsondes and 4 AXBTs were transmitted.
Mission Evaluation:
Problems:
Joe Cione
Oct. 25, 2014
Mission Data :
|
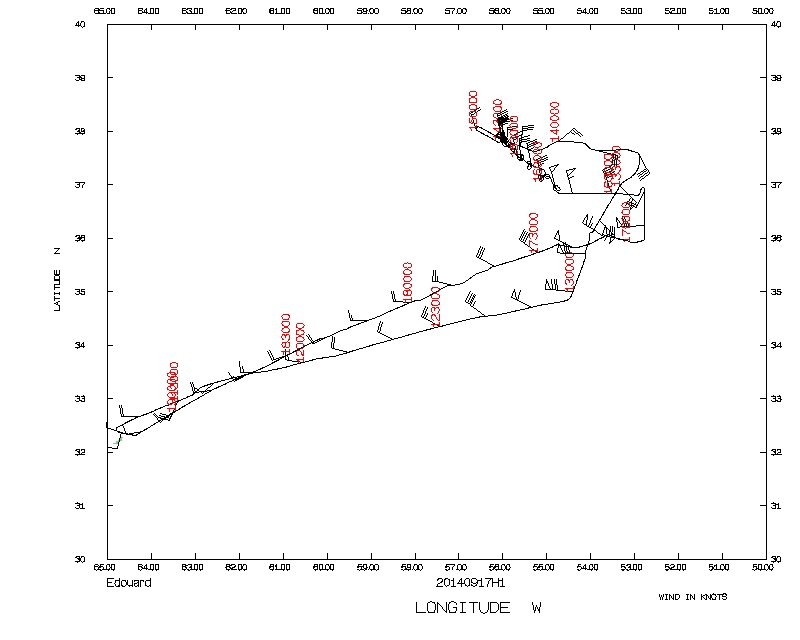
Flight track |
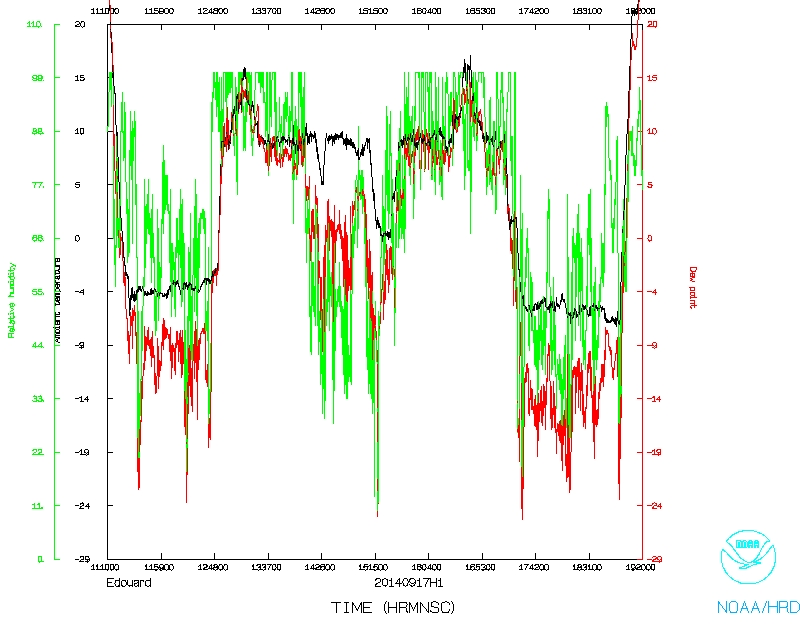 Temperature and Moisture |
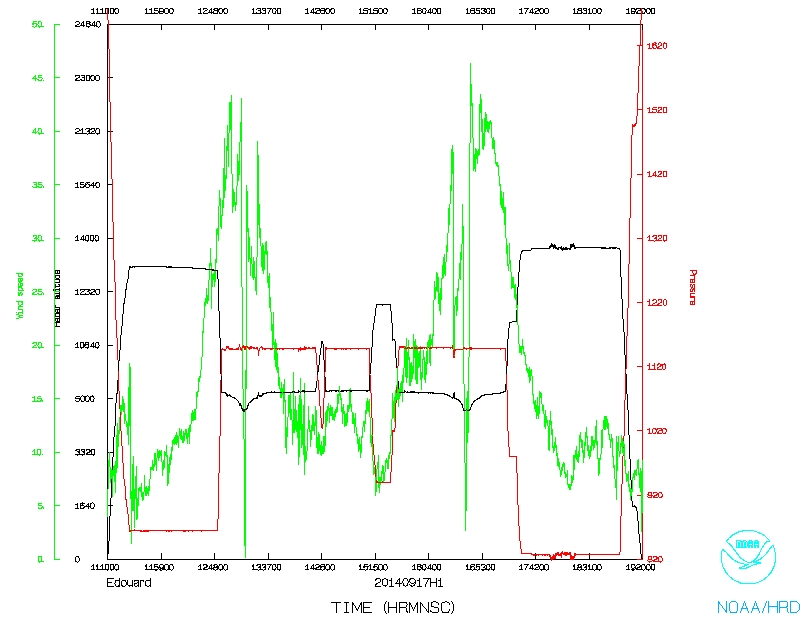 Wind and Atlitude |
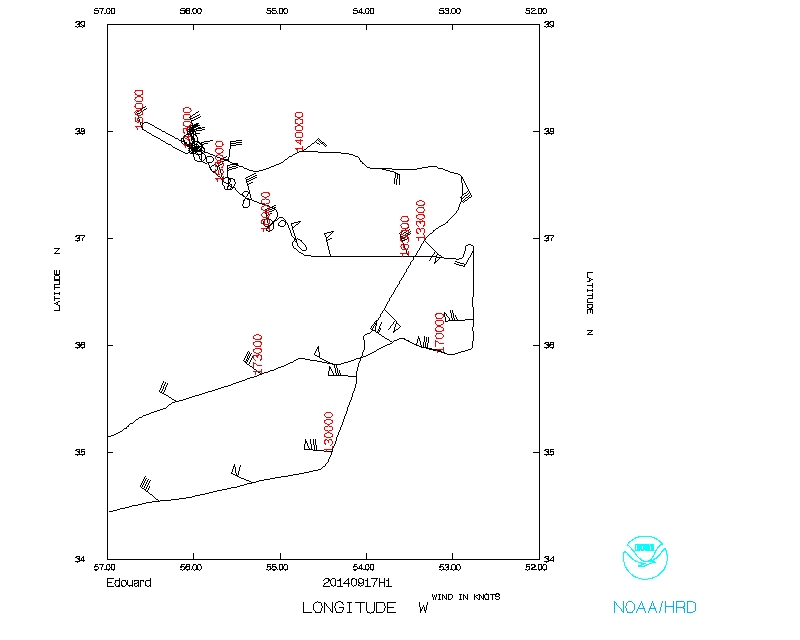 Flight track detail |