Proposed track |
Final track |
| Aircraft Commander | Justin Kibbey |
| Co-pilot | Catherine Martin |
| Co-pilot | Scott Price |
| Navigator | Pete Siegel |
| Flight Engineer | Joe Klippel |
| Flight Engineer | Paul Darby |
| Flight Director | Rich Henning |
| Flight Director | Kristie Twining |
| System Engineer | Steven Paul |
| Data Technician | Joe Bosko |
| AVAPS | Todd Richards |
| Observer | David Hall (OMAO) |
| LPS | Joe Cione (HRD) |
| Radar | Evan Kalina (UColo) |
| Dropsonde | Jason Dunion (HRD) |
| CCN spectra | Luke Ziemba (NASA) |
| COYOTE | Eric Redweick (Sensintel) |
| COYOTE | Drew Osbrink (Sensintel) |
Mission Plan :
|
Proposed track |
Final track |
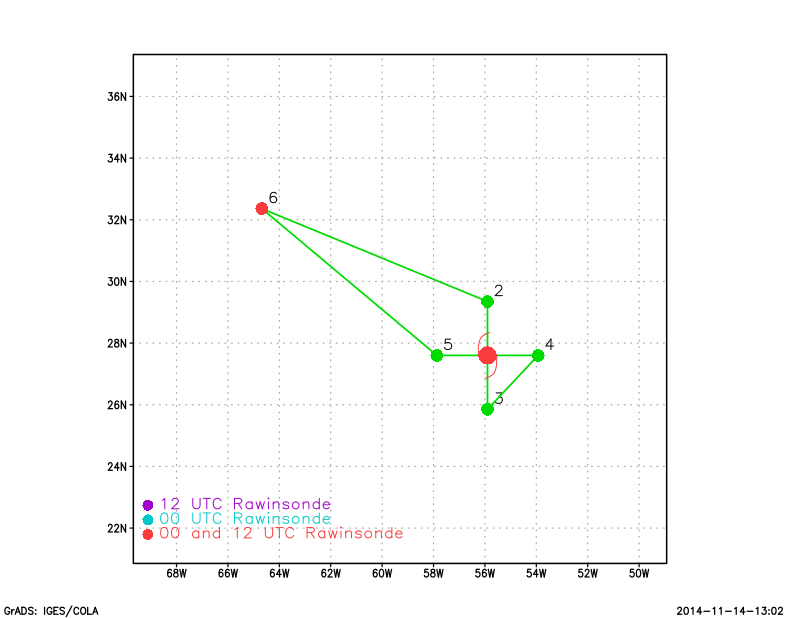
NOAA 42RF will conduct an HRD-tasked Model Evaluation mission into Hurricane Edouard. The flight calls for a rotated figure 4 with 105 nm leg lengths, a flight level of 10,000 ft (pressure altitude), and an IP 105 nm north of the storm center. The new COYOTE low altitude drone aircraft will be launched from the P-3 in the eye of Edouard (this marks the first-ever attempt to launch a drone into a hurricane from an aircraft), 14 GPS dropsondes and 8 AXBTs will be launched, and Doppler wind analyses will be transmitted off the plane in real-time, if possible. The flight track and GPS dropsonde/AXBT/COYOTE launch points are shown in Fig. 1. Takeoff is scheduled for 1400 UTC from Bermuda and recover there at 2300 UTC.
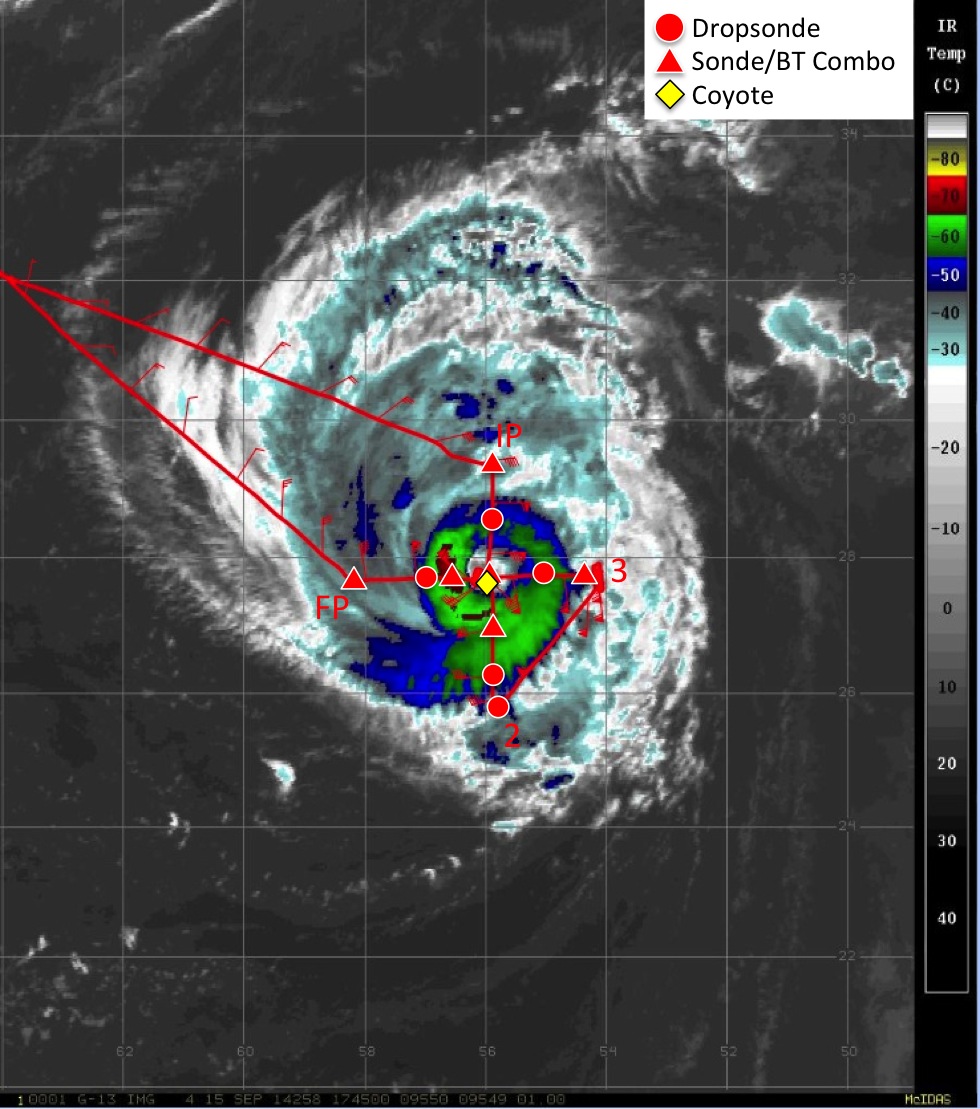
Fig. 1: GOES-13 enhanced IR for 15 Sep 2014 1745 UTC with the P-3 flight track (red curve) and flight-level winds (red wind barbs) overlaid. GPS dropsonde (14 total) and AXBT (8 total) launch points are indicated by red circles and triangles. The yellow diamond denotes the COYOTE launch made in Edouard's eye during the final E-W pass through the storm. |
Mission Summary :
| Take off | Landing
| Bermuda
| 14:08 UTC
| Bermuda
| 20:54 UTC
| Penetrations
| 2
| | ||||
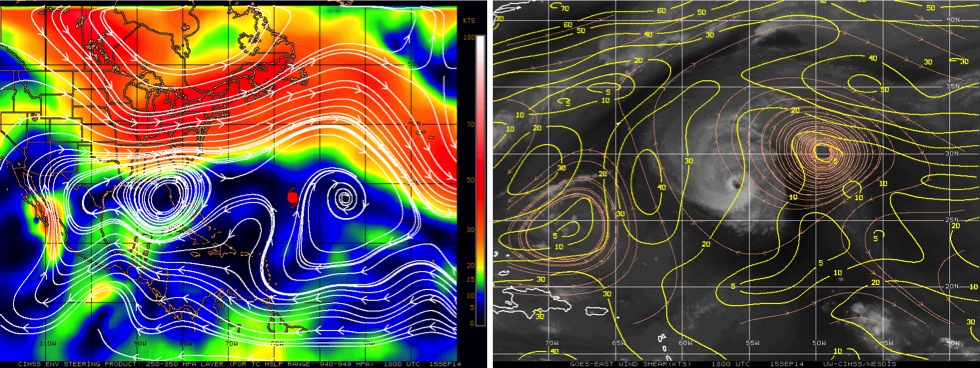
Fig. 2: (Left) plot of 250-850 mb deep layer mean steering [magnitude (direction) of the steering flow is indicated by colored shading (white streamlines)] and (right) vertical wind shear [magnitude (direction) of the wind shear is indicated by yellow contours (orange streamlines)] valid for 15 Sep 2014 1800 UTC. Images courtesy of UW/CIMSS. |
a) Synoptic Situation
On 15 September, Hurricane Edouard was positioned on the west side of a deep
layer ridge ~525 nm southeast of Bermuda, had an intensty of 90 kt (strong
category 2), and was moving at 13 kt to the NW (Fig. 2, left). Vertical wind
shear analyses from UW-CIMSS indicated a marked east-west shear gradient that
ranged from ~15-25 kt (Fig. 2, right). Low-level AMVs (600-950 hPa) from
UW-CIMSS show the large circulation associated with Edouard, enhanced NNE flow
on the west side of the storm that was advecting dry mid-latitude air around
the western semicircle, and 10-20 kt SE flow on east of the storm that was
advecting moist tropical air into the eastern side of Edouard's circulation
(Fig. 3, left). Figure 3 (right) shows mid- to upper-level water vapor winds
from UW-CIMSS and indicates that although the outflow was somewhat restricted
on the south and SE sides of Edouard, well developed outflow had established
around the entire northern semicircle of the storm. Water vapor winds also
indicate that an upper level cold low was positioned ~600 nm SW of Edouard,
but this low was slowly retrograding to the west away from the hurricane and
appears not to have been inducing any significantly enhanced vertical wind
shear or restricting Edouard's outflow.
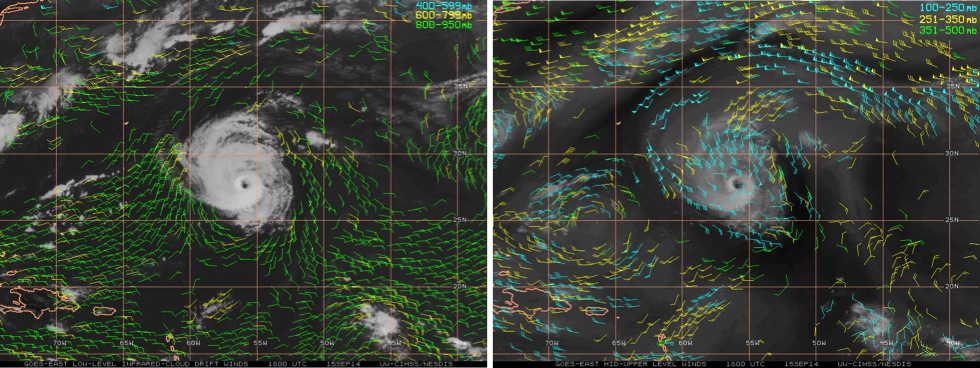
Fig. 3: Plots of (left) low to mid-level GOES cloud-drift winds and (right) mid to upper-level GOES water vapor winds for 15 Sep 2014 1800 UTC. Images courtesy of UW/CIMSS. |
b) Mission Specifics
Take-off was from Bermuda at 1408 UTC. Edouard was a strong category
2 hurricane with a fairly small area of -50oC or colder cloud tops (Fig. 4,
left) and fairly confined low to mid-level moisture envelope. Figure 4 (right)
shows that although moist tropical air (>45 mm TPW) extended out to a radius
of ~300 km in all quadrants, a mid-latitude dry air intrusion (<45 mm TPW) was
wrapping around the northern and western semicircles of the storm, while a
wedge of dry SAL air (<45 mm TPW) was located at R=300-600 km around the
eastern semicircle. The P-3 flight legs were designed to extend well beyond
the area of Edouard's inner core, but did not sample beyond the radius of the
low to mid-level moist tropical air (a concurrent G-IV mission did sample the
peripheral environment at larger radii beyond the P-3 pattern).
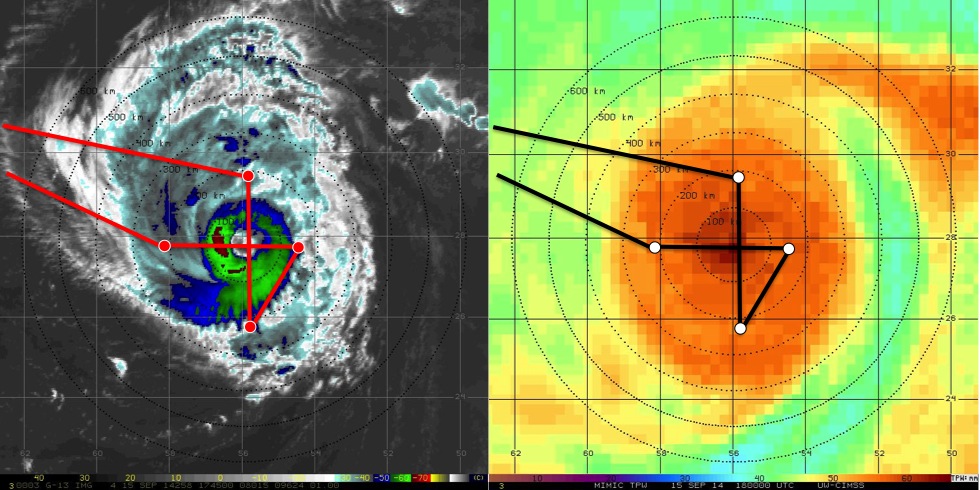
Fig. 4: Plots of (left) GOES-13 enhanced IR and (right) MIMIC-TPW imagery for 15 Sep 1745 and 1800 UTC respectively. The NOAA-42 flight track is indicated by the red (black) curves and the endpoints of the pattern are indicated by red (white circles). Images courtesy of UW/CIMSS. |
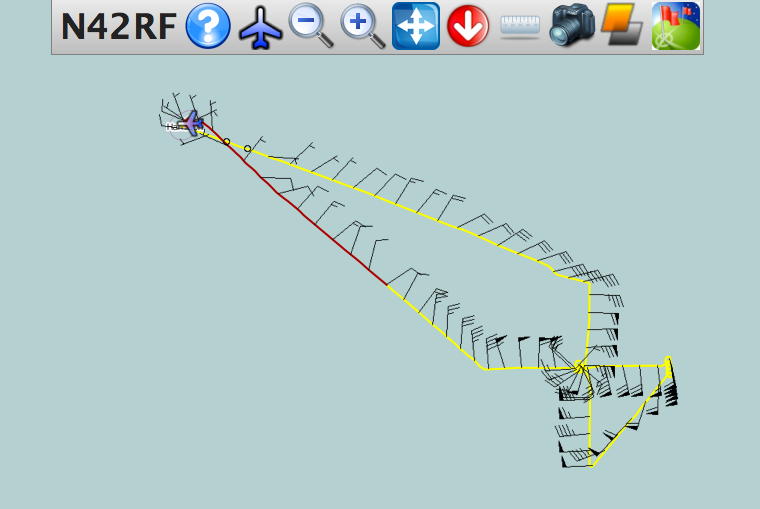
The flight pattern originally called for a final leg from the west side of the storm (Fig. 1, FP) to the north side of the storm (Fig. 1, IP), but the decision was made to omit that portion of the pattern. Coordination issues with NOAA-43 prior to the final E-W pass delayed the mission for a time, but that last leg was eventually flown and a COYOTE drone was launched into Edouard's eye before the P-3 exited to the west. Communications with the COYOTE were never established after launch and the drone was lost (only one COYOTE launch was attempted for this mission). The P-3 radar software hung up during the first pass, so only one Doppler wind analysis was transmitted off the P-3 in real-time. Figure 5 shows a cross-section of the final E-W pass radar analysis and as suggested by the GOES IR imagery, the downshear western eyewall was much more convectively active than the upshear eastern eyewall.
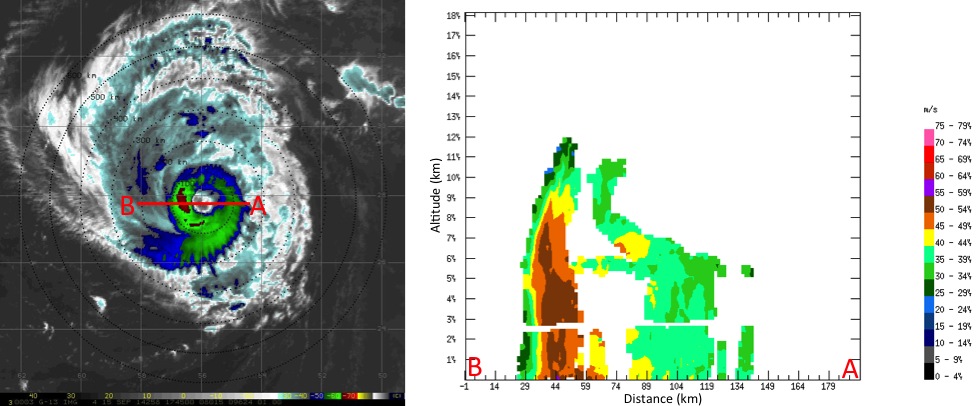
Fig. 5: (Left) GOES enhanced IR satellite image of Hurricane Edouard on 15 Sep 1745 UTC with overlaid E-W (A-B) P-3 track overlaid. (Right) HRD tail Doppler radar cross-section of radar-derived total wind speed across the corresponding E-W (A-B) P-3 leg. |
There were 17 dropsondes, 8 AXBTs, and 1 COYOTE launched. 3 bad dropsondes and 2 bad AXBTs, only 14 dropsondes and 6 AXBTs transmitted.
Mission Evaluation:
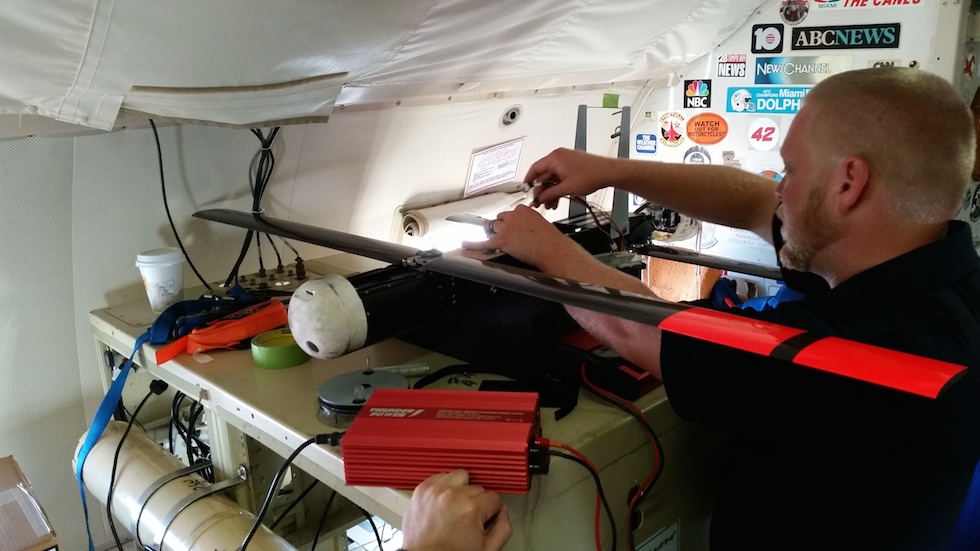
Fig. 6: COYOTE being pre-flighted for launch by Eric Redweick from Sensintel. Photo taken by Todd Richards, NOAA/AOC. |
Problems:
Problems: There were a few problems noted during this flight:
Jason Dunion
Nov. 12, 2014
Mission Data :
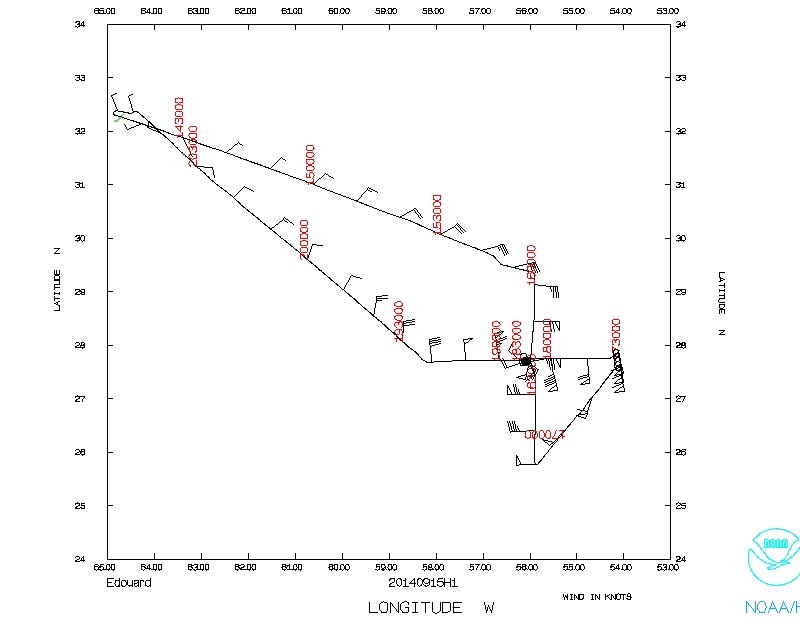 Flight track |
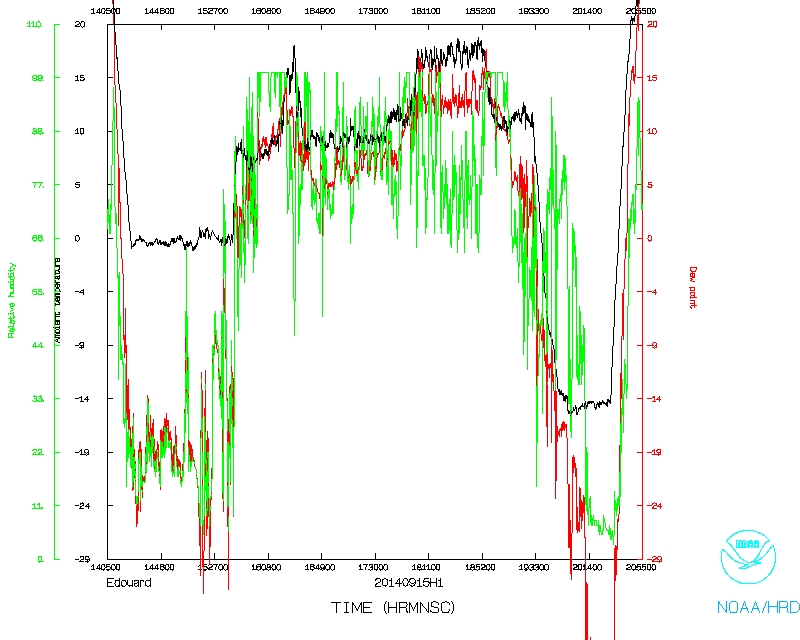 Temperature and Moisture |
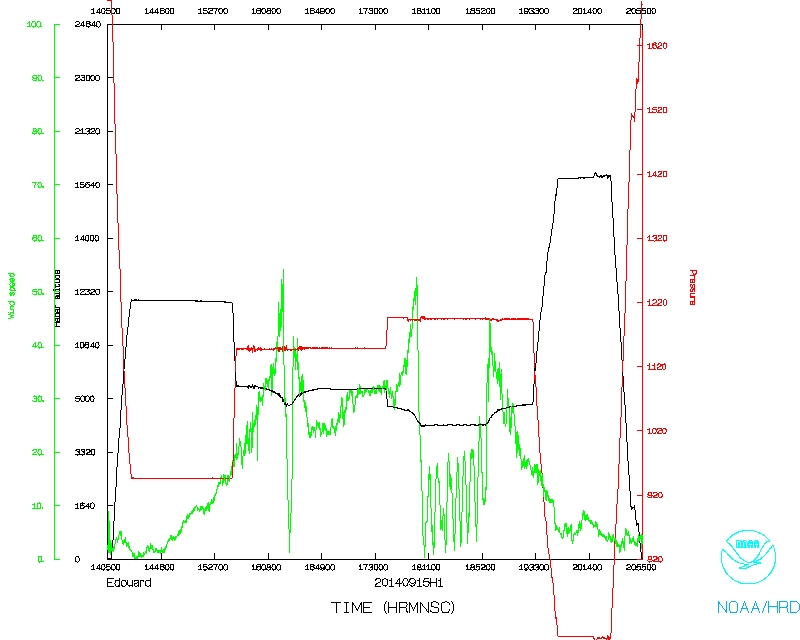 Wind and Atlitude |