 |
|
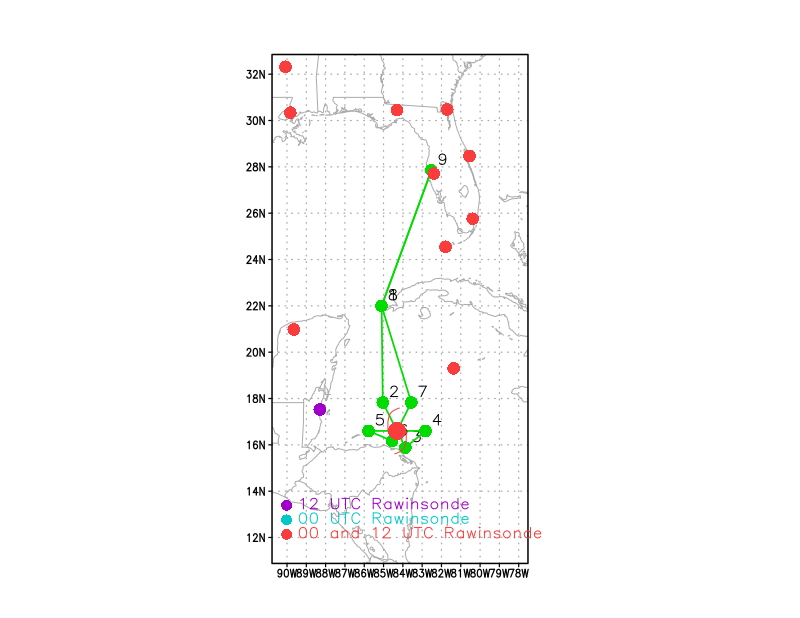
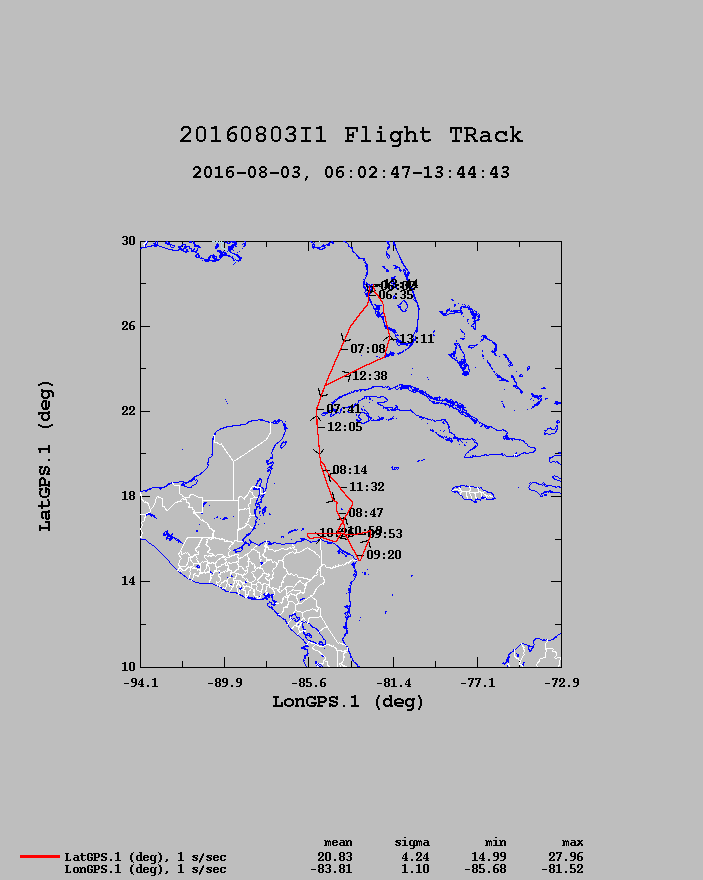
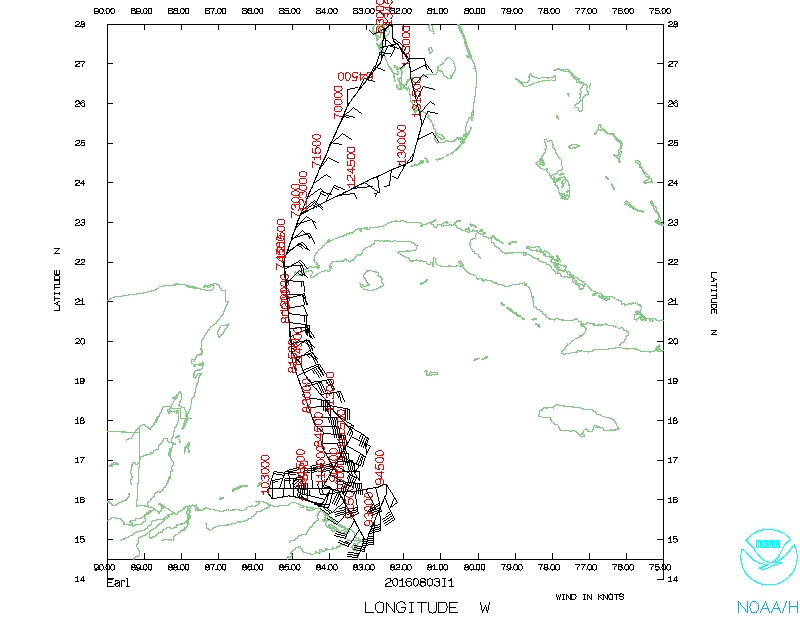
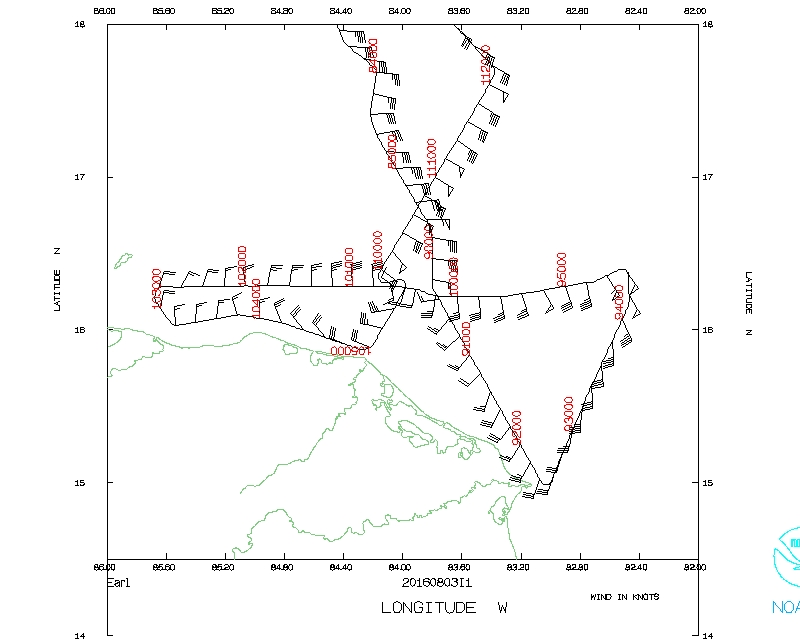
Figure 1: Initial flight plan for the mission into
Tropical Storm Earl. Green dots are the turn points. Purple and red dots represent locations of rawinsonde observations. |
| Aircraft Commander | Scott Price |
| Co-pilot | Cathy Martin |
| Co-pilot | Nate Kahn |
| Navigator | Tim Gallagher |
| Flight Engineer | Paul Darby |
| Flight Engineer | Chris LaLonde |
| Flight Director | Mike Holmes |
| Data Technician | Terry Lynch |
| Dropsonde Operator | Joe Greene |
| Dropsonde Operator | Todd Richards |
| LPS | Sim Aberson | HRD |
| Radar | Hui Christophersen | HRD |
| DWL | Kelly Ryan | HRD |
| Drops | Jun Zhang | HRD |
| Drops | Jon Zawislak | Utah |
Mission Plan :
|
|
|
Figure 1: Initial flight plan for the mission into
Tropical Storm Earl. Green dots are the turn points. Purple and red dots represent locations of rawinsonde observations. |
An Environmental Modeling Center-tasked Tail Doppler Radar (TDR) Mission into Tropical Storm Earl, which was developing and moving westward in the western Caribbean Sea just north of the Honduran coast. The plan was for a butterfly pattern (90 nmi legs) with six passes through the center, shortening legs for land, before returning to MacDill (Fig. 1). AOC obtained overflight clearance for Honduran air space before the flight, allowing for improved manoeuvering in the region.
|
Prepared by the Hurricane Research Division August 2, 2016 Aircraft: N43RF Proposed takeoff: 03/0600Z
DROP LOCATION TABLE
| #
| LAT
| LON
| RAD/AZM
| Time
|
| deg min
| deg min
| n mi/deg
| hr:min
| 1 | 22 00 | 85 06 | 1:36
| 2S | 17 50 | 85 02 | 85/330 | 3:21
| 3S | 15 53 | 83 52 | 50/150 | 3:55
| 4S | 16 36 | 82 49 | 85/090 | 4:14
| 5S | 16 36 | 85 47 | 85/270 | 4:58
| 6S | 16 10 | 84 34 | 30/210 | 5:17
| 7S | 17 50 | 83 34 | 85/030 | 5:47
| 8 | 22 00 | 85 06 | 6:54
| | ||||||||||||||||
| Take off | Landing
| MacDill AFB, FL
| 06:28 UTC
| MacDill AFB, FL
| 13:50 UTC
| | ||
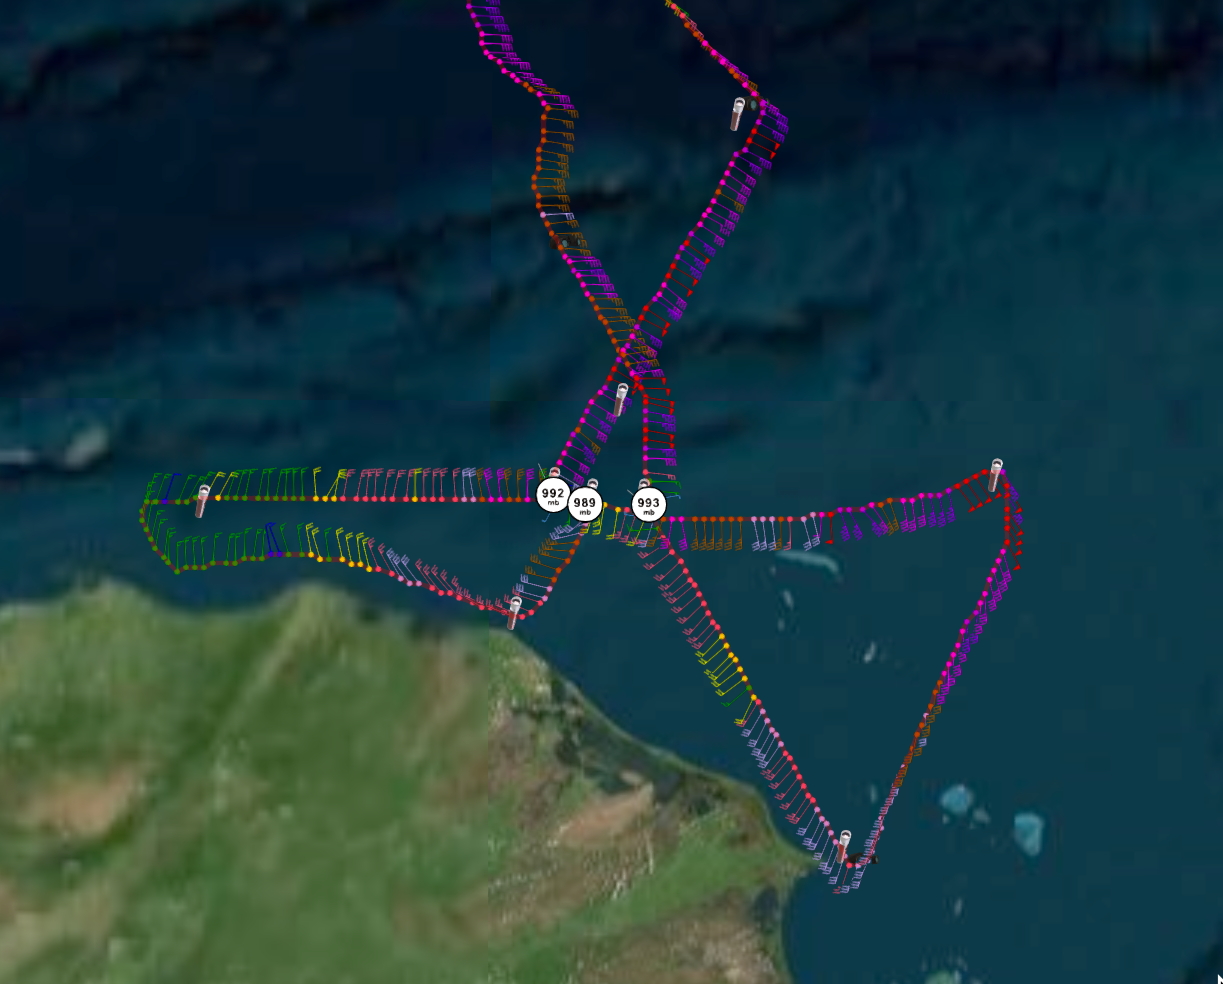
At the beginning of the mission, Earl was located about 155 km northeast of Puerto Lempira, Honduras, and 565 km east of Belize City, and was moving westward at 23 km/hr. The maximum sustained wind speed remained 95 km/hr, making it a moderate tropical storm, and the minimum central pressure was 996 hPa. Convection had been increasing near the core, though much of it seemed to be east of the center. The mission was conducted at 10000 ft altitude, even though there was a fix requirements from the National Hurricane Center due to failure of the Air Force C130 aircraft. As expected, the legs to the south of Earl were shortened due to land, though the northwest-southeast leg was extended much further along the coast than was expected.
|
|
|
|
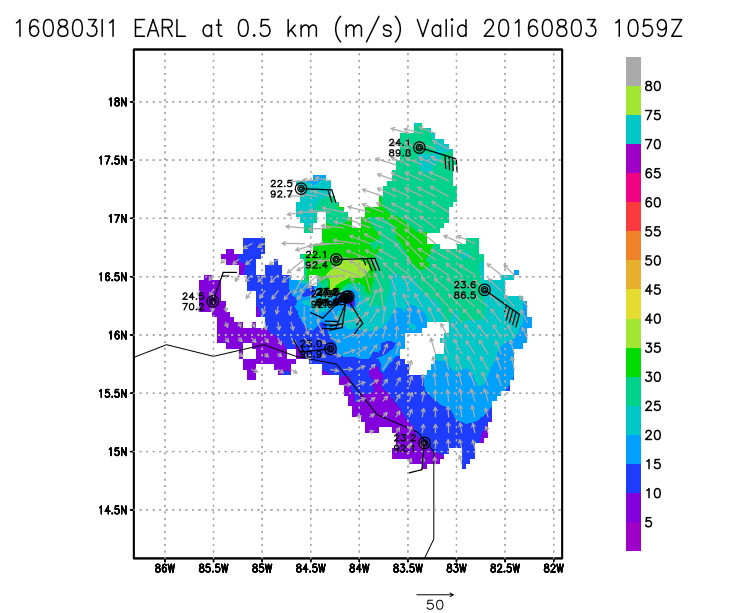
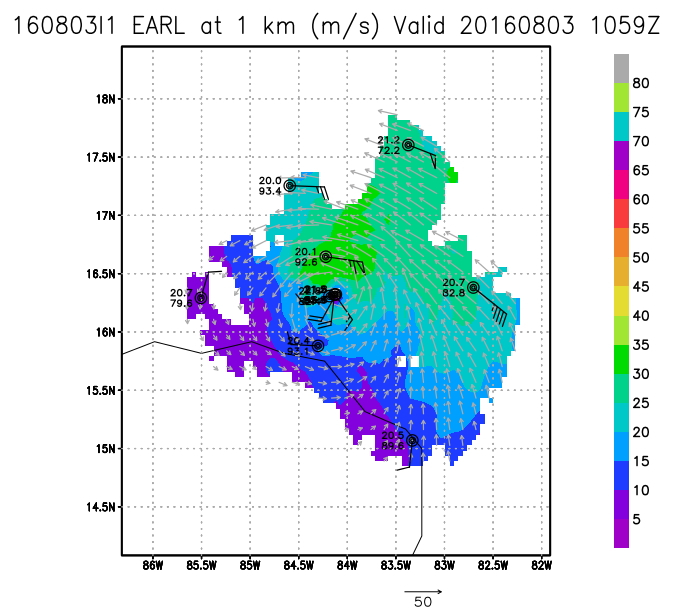
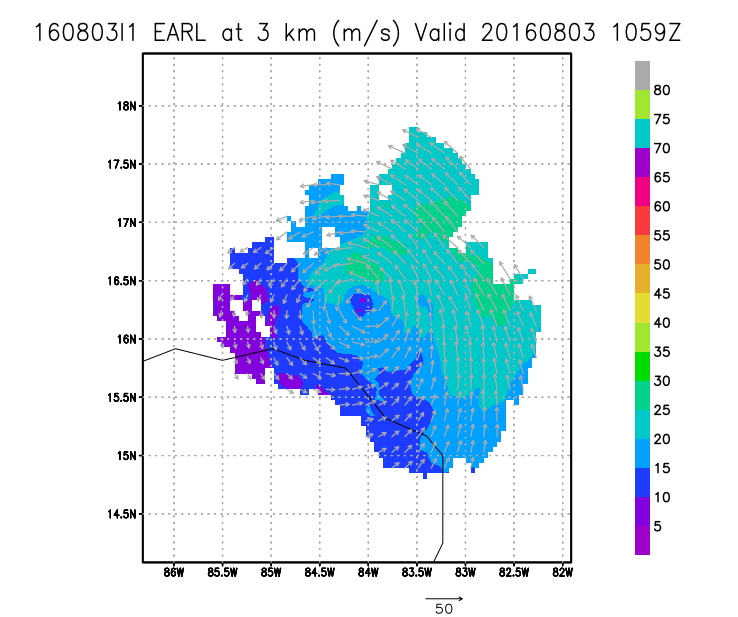
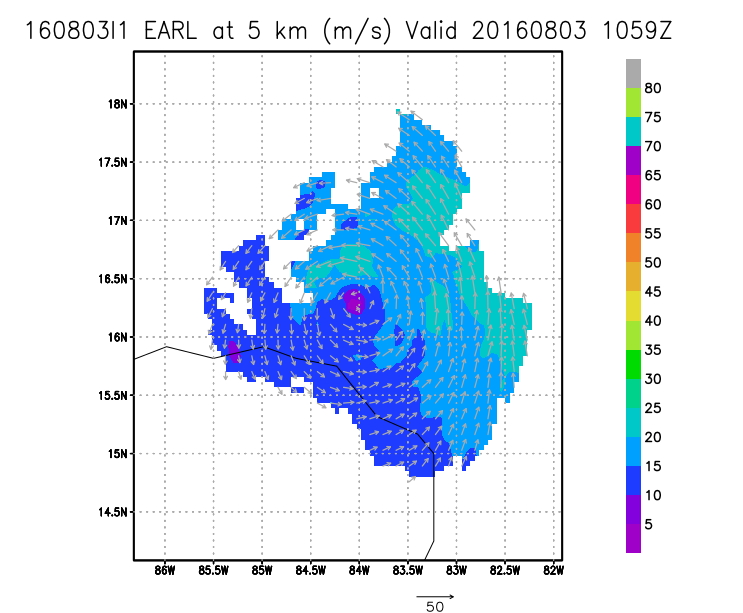
| Figure 2: Doppler radar/dropwindsonde storm-relative composite of Tropical Storm Earl valid 1059 UTC 03 August at four levels showing the tilt of the center with altitude. | |
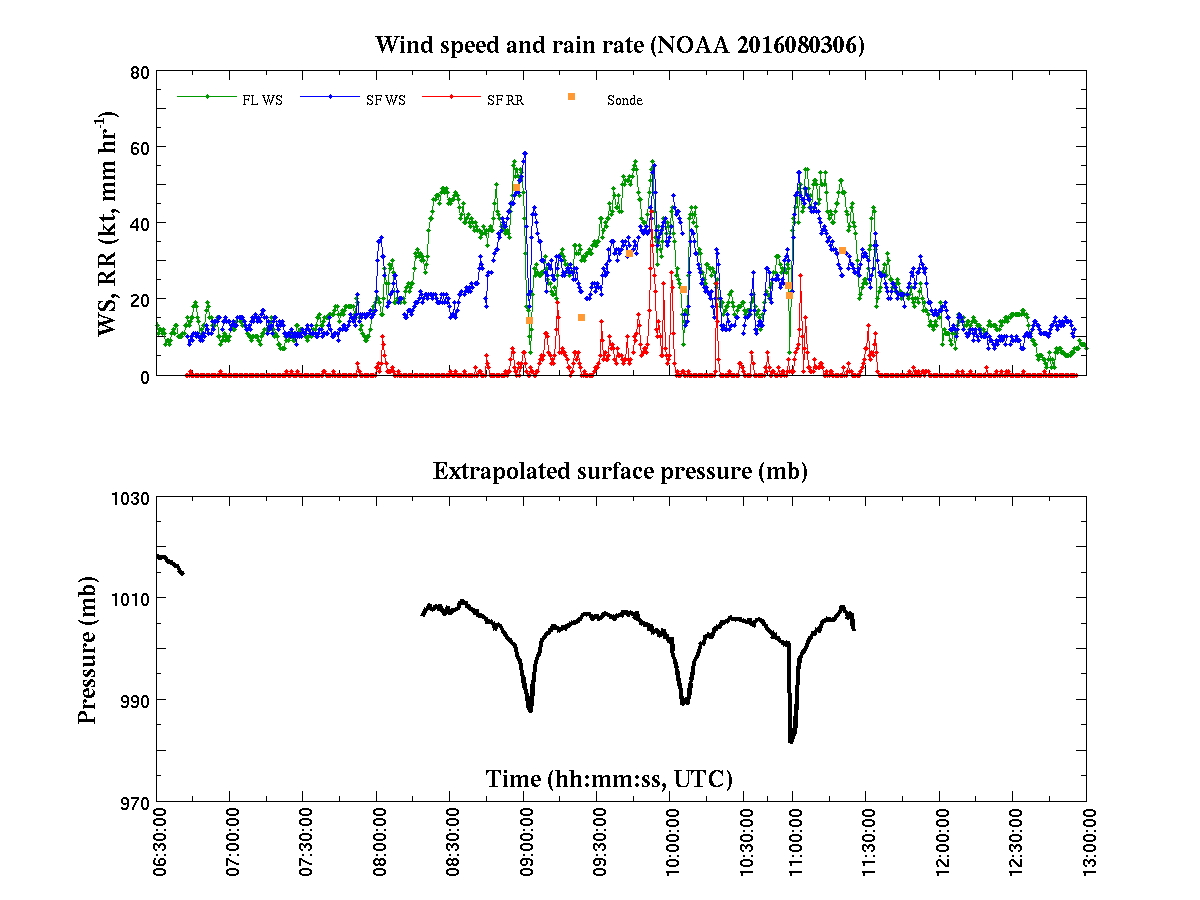
Even though the flight path was nearly symmetric around the storm (except over land), the radar showed that scatterers remained mainly to the east of the storm center (Fig. 2). The flight path extending from the center of Earl to the southeast, through the downwind leg, and then the leg back into the center was accompanied by moderate to strong turbulence throughout, with multiple updraft/downdraft couplets causing things that were not held down to temporarily levitate. The convection was deep enough that scatterers were seen up to 17.5 km altitude. The strongest winds observed were in the northern semicircle of Earl, with radar-measured winds of more than 35 ms-1 at 0.5-km altitude (Fig. 2). These winds decreased rapidly with altitude, though the wind-field symmetry remained static. The center began to tilt appreciably to the east , then southeast, above 5 km, and the closed circulation center disappeared by about 9-km altitude. In addition to the maximum wind band noted just north of the circulation center, a second wind-speed maximum extended from about 120 km to the east of the center to about 80 km north of the center, and this second maximum could be seen to about 6-km altitude.
Problems :
The mission was initially delayed by a half hour due to communications issues on the aircraft: Communications to the flight-director's station were severed, requiring networking before takeoff. There was a shaking sensed on the previous flight, and it was noted again during this flight; attribution was unknown, but technicians were pointing to the Doppler Wind Lidar. Centos-6 workstations repeatedly froze during the mission requiring reboot; the cause of this was not determined. Most importantly, the lower-fuselage radar was showing very low reflectivity values, to the point that the moderate to strong convection was not seen during much of the mission, and reflectivity values were 10-15 dB below that seen in the Tail radar. In addition, many of the rays showed constant low values (green on the display) from the center outward to the maximum radius, suggesting an additional problem. This caused issues with situational awareness during the mission. No radar technician was on the flight, so the problem was left. All other instruments, especially the Doppler Wind Lidar, worked well.
LPS's log | Radar Scientist's log | Dropsonde Scientist's log | Doppler Wind Lidar log
Flight Director's log | Flight Director's manifest | NetCDF data | 1 second data | serial data
 Final flight track |
 Final flight track |
 Final flight track detail |
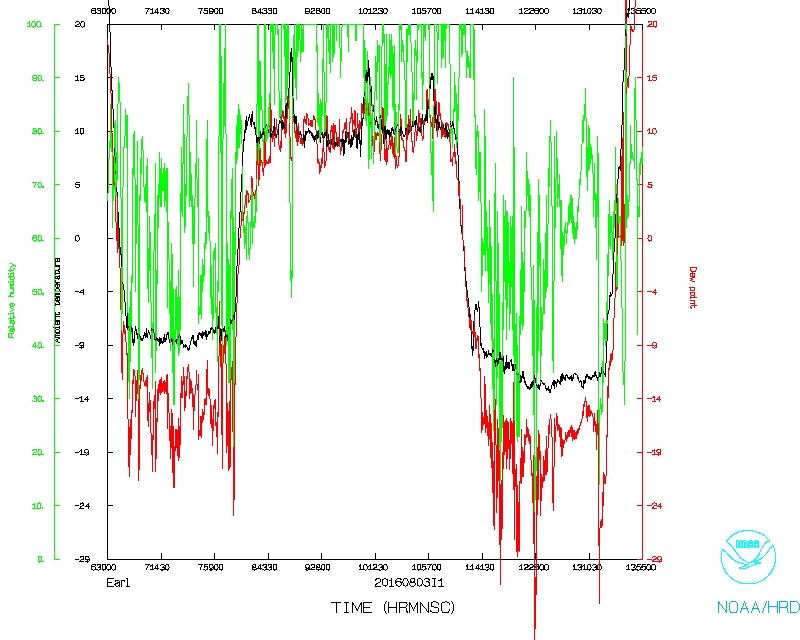 Temperature and Moisture |
 Flight track |
 Flight track detail |
 Wind and Atlitude |
||
Plot of raw High Density Obs | ||