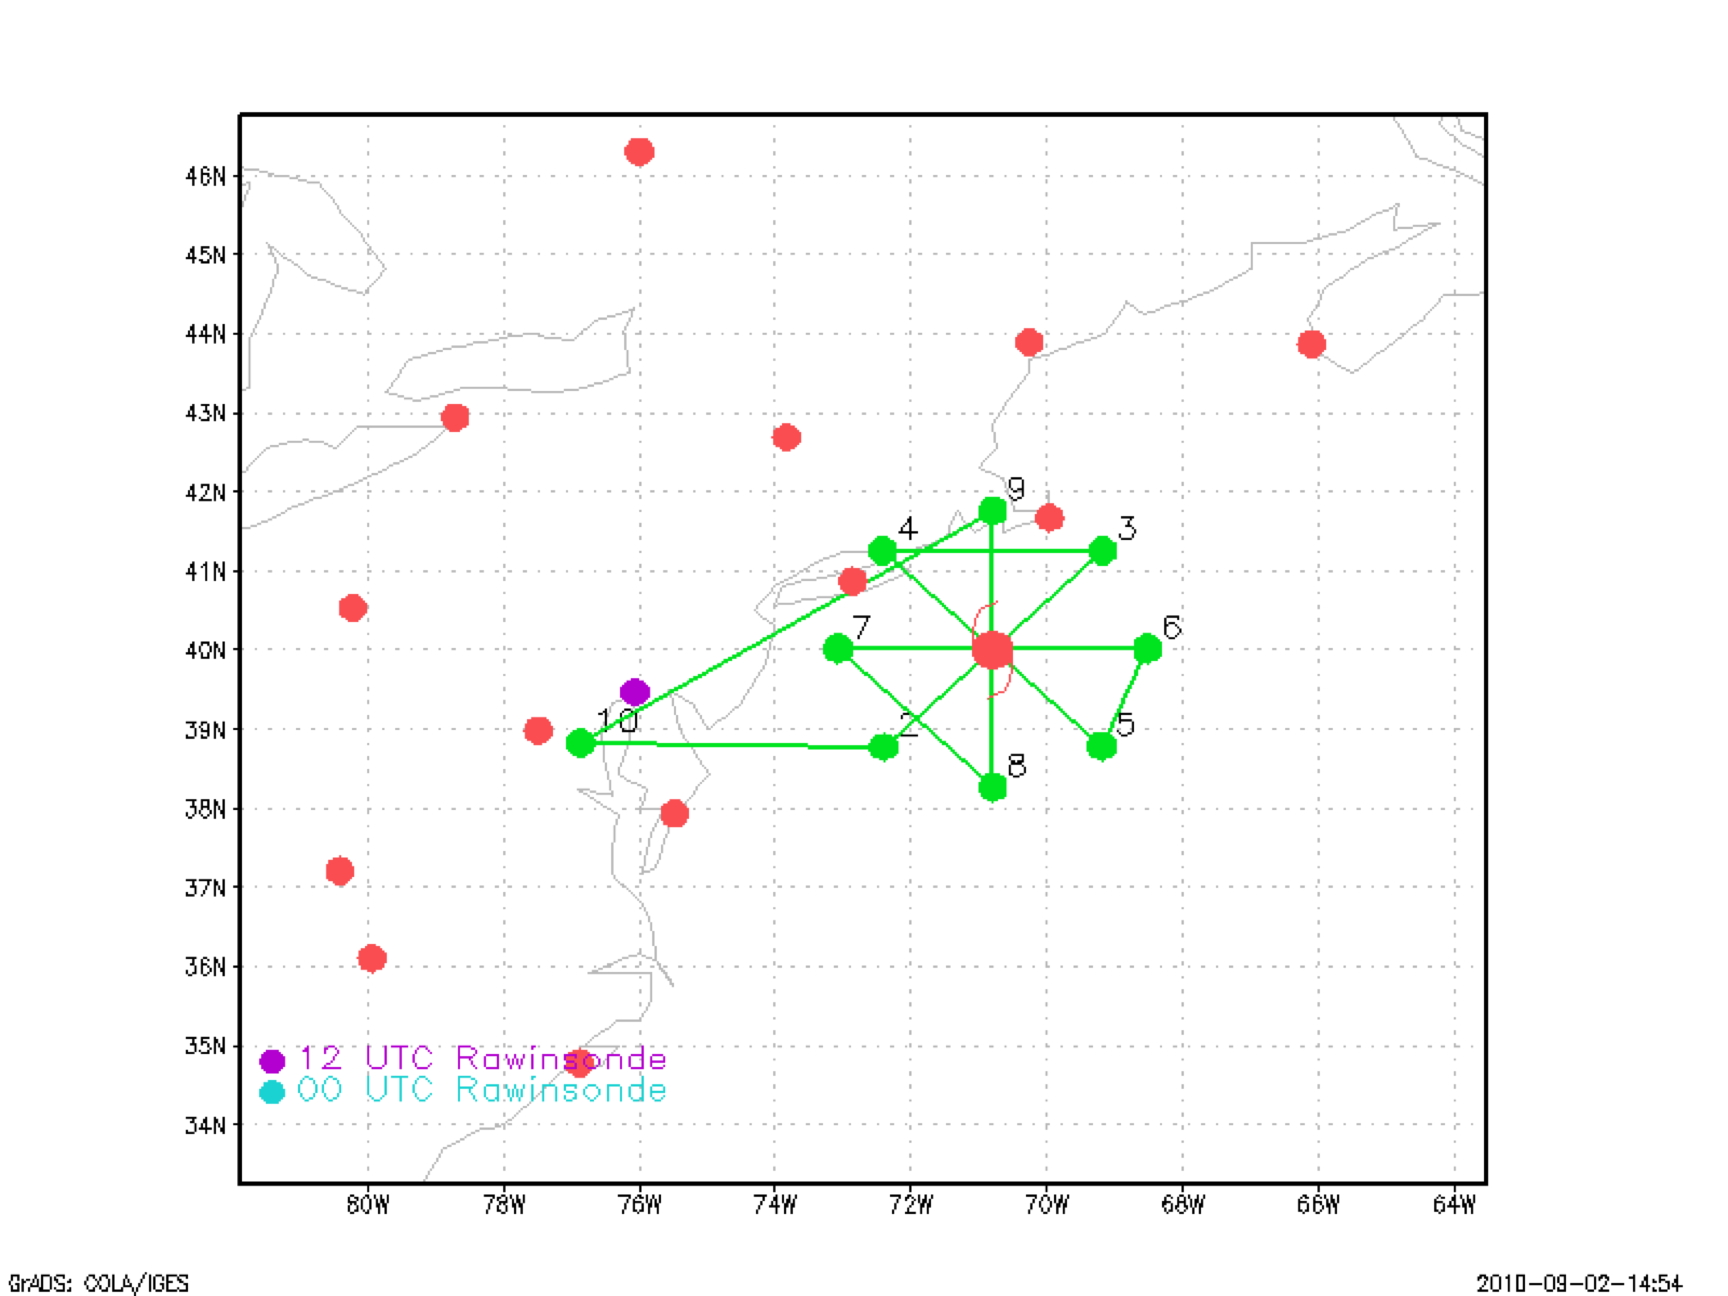
Fig. 1. Planned flight track for NOAA 43, Flight ID: 100903I, Mission ID: WX07A Earl 14
| Aircraft Commander | Mark Nelson |
| Co-pilot | Harris Halverson |
| Co-pilot | Justin Kibbey |
| Flight Engineer | Greg Bast |
| Navigator | Mark "Bubba" Sloan |
| Flight Director | Paul Flaherty |
| Data Technician | Dana Naeher |
| Electronics Technician | Damon San Souci |
| Electronics Technician | Bobby Peak |
| Lead Scientist | Rob Rogers |
| LPS/Radar/Cloud Scientist | Shirley Muriilo |
| Dropsonde Scientist | Paul Leighton |
| Ocean Winds Scientist | Paul Chang (NESDIS) |
| Ocean Winds Scientist | Zorana Jelenak (NESDIS) |
| Ocean Winds Scientist | Jason Davorsky (NESDIS) |
|
|
Mission Plan :
At 1500 UTC 3 Sep, the NHC indicated that Hurricane Earl had a central pressure of 961 mb, sustained winds of 75 kt, was located at 36.8 N and 73.1 W, and was moving north-northeast at 18 kt. Earl is beginning the extratropical transition process as it moves into cooler waters. Our plan called for flying a rotated figure-4 (Fig. 1) pattern with 105 nm flight legs for EMC to sample Earl. Figure 1 has the take off and landing at Andrew AFB but we took off and landed in Richmond, VA. The tkmap flight track drawing software program doesn't have Richmond as a landing option. Since this was a combination TDR and Ocean Winds experiment, the experiment was conducted at 12kft (radar) for the first figure 4 at which point the aircraft descended to 8Kft (radar) and remained there for the duration of the mission. The plan is to start on the SE side of the storm and end on the west side, which is just a little different than the proposed flight pattern (Fig. 1). We may shorten the legs on the southeast side since the storm is deteriorating quickly. At the end of our flight pattern we will perform a few repeated eye penetrations for the Ocean Winds experiment. This was the final flight into Earl.

Mission Summary :
| Take off | Landing
| Richmond VA
| 03/20:00 UTC
| Richmond VA
| 04/04:00 UTC
| | ||
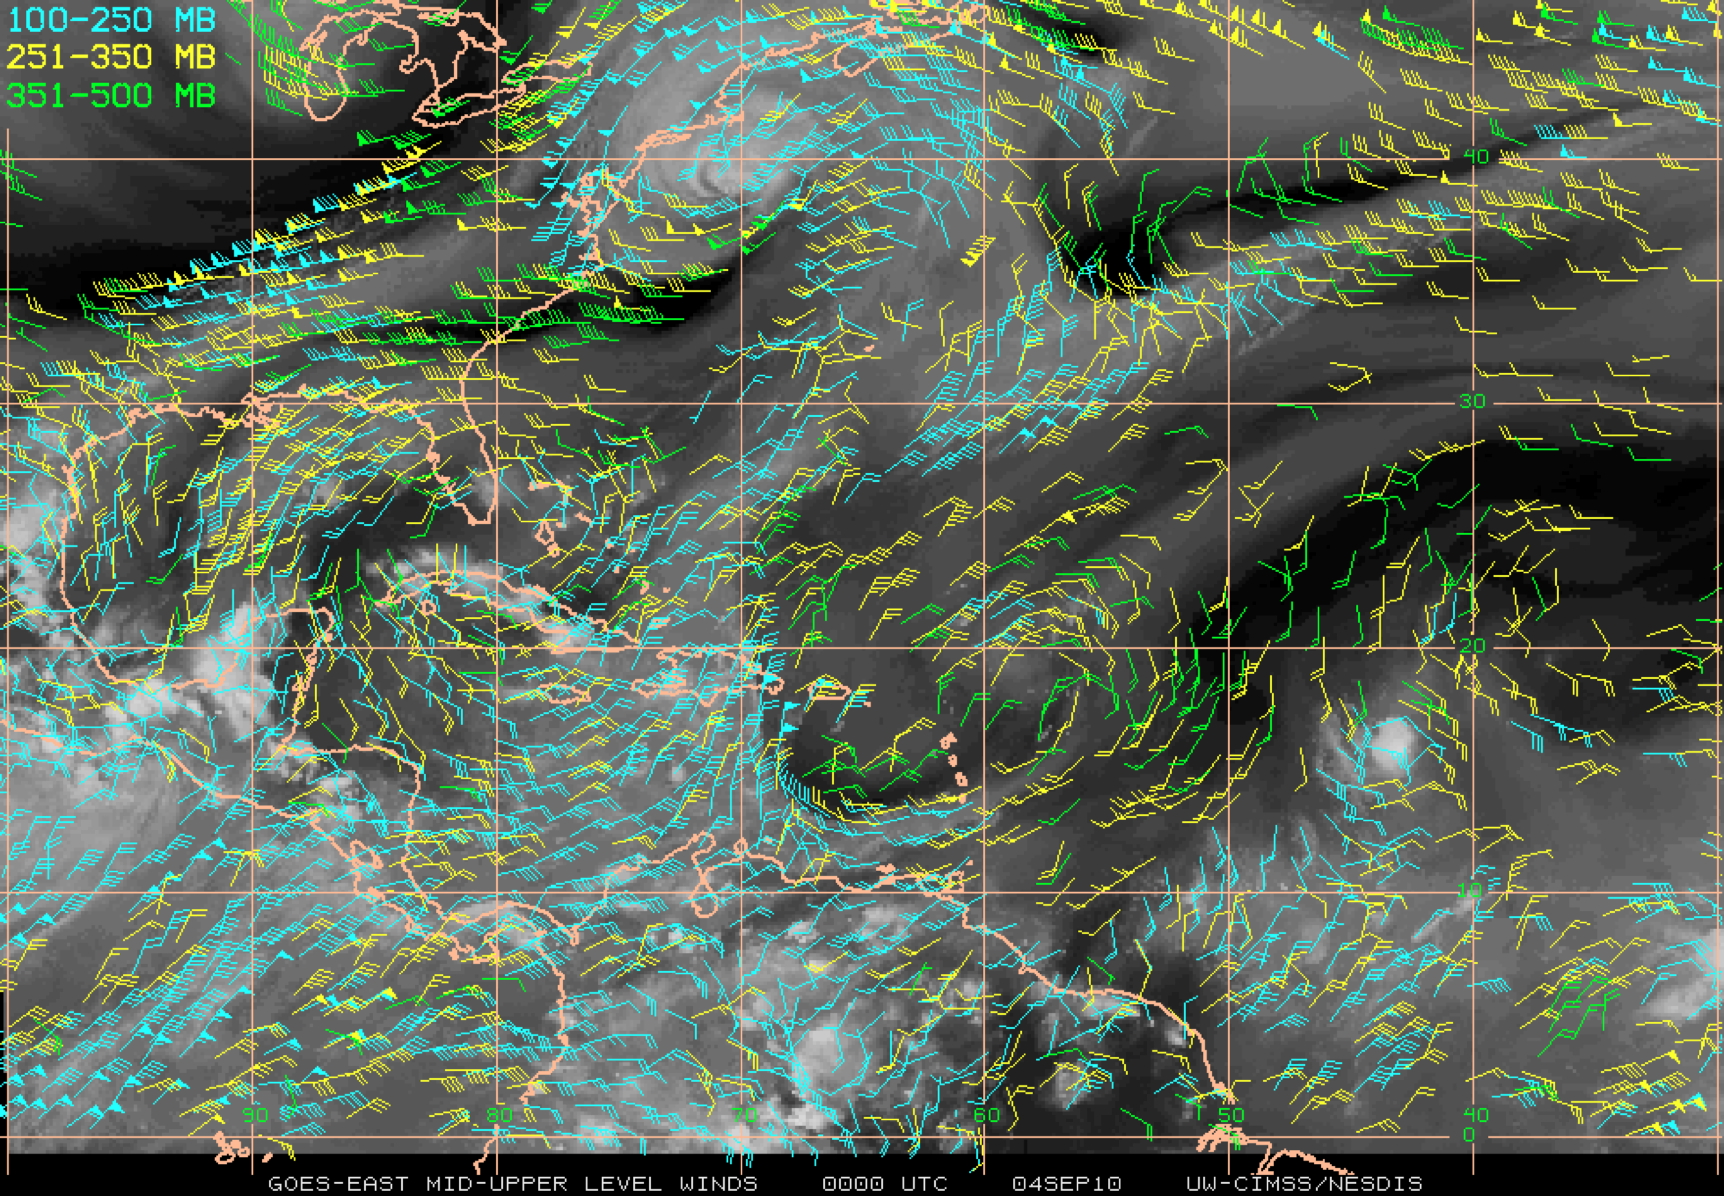
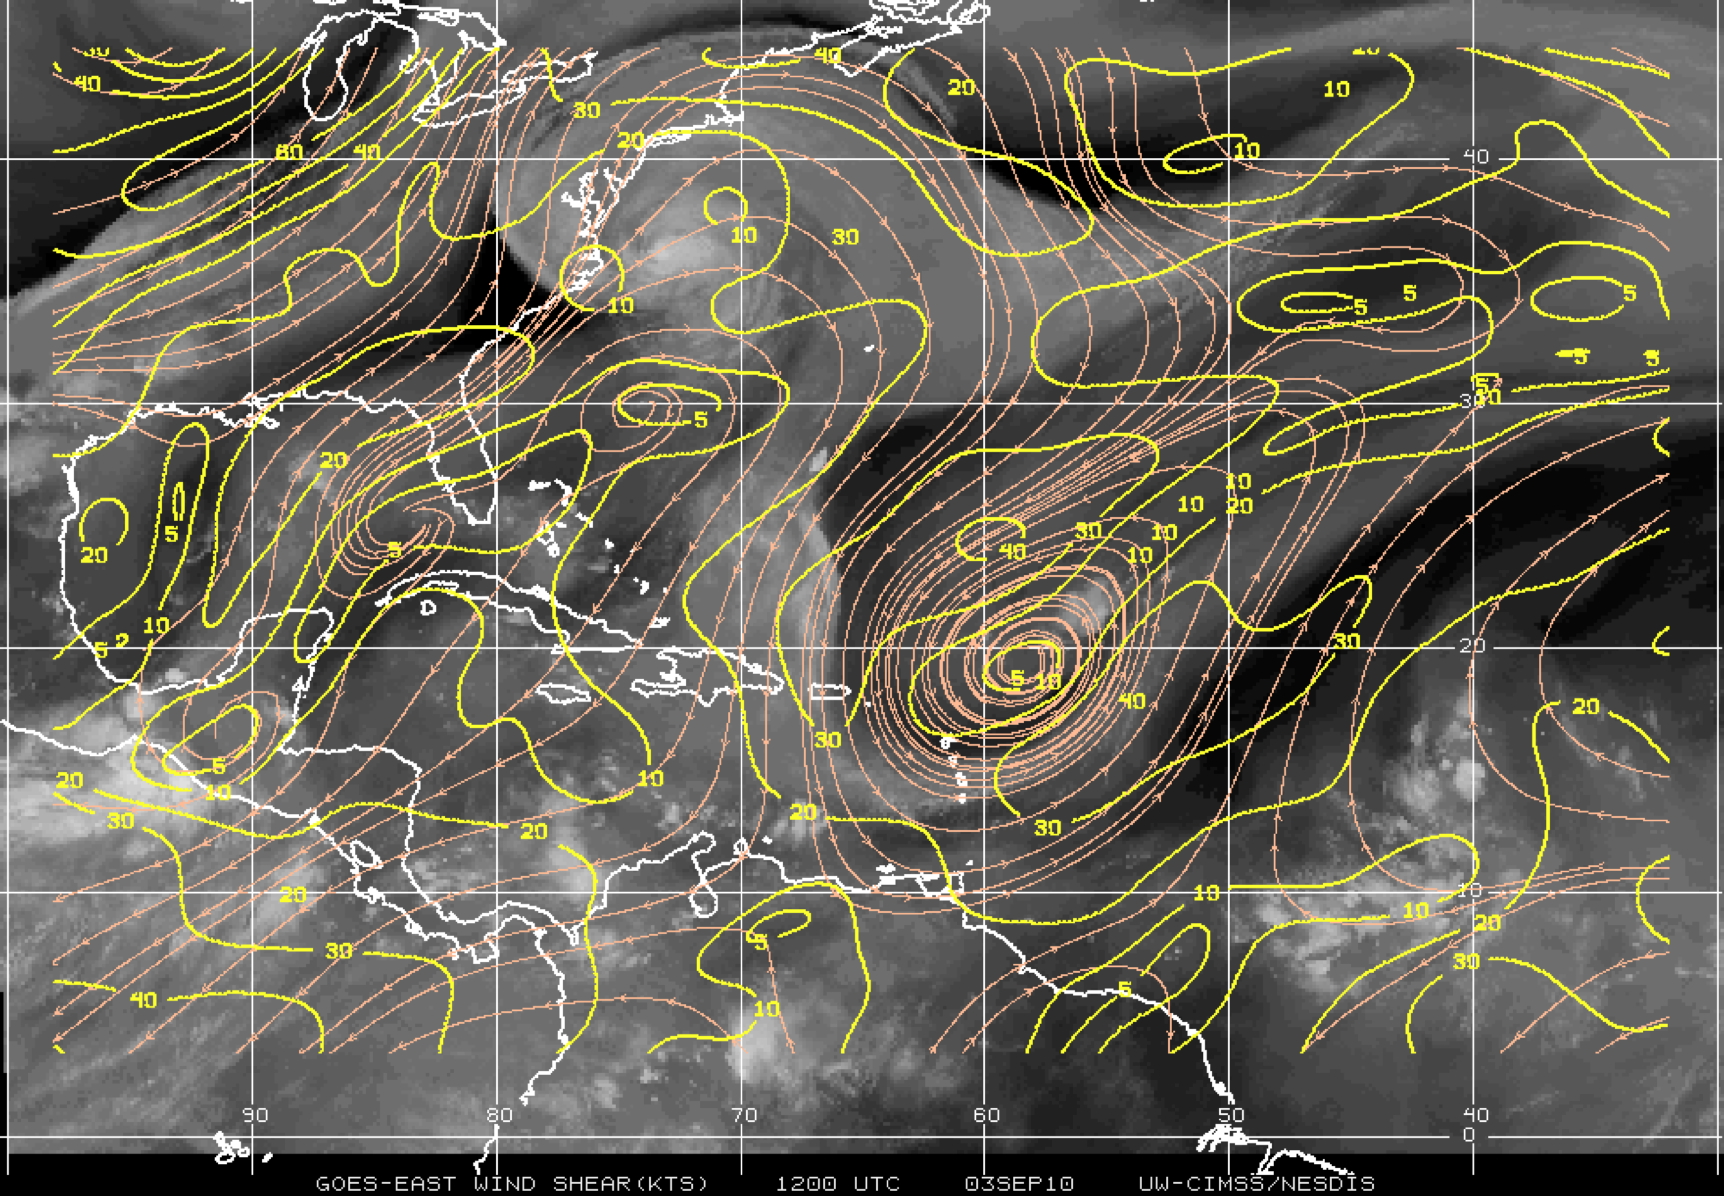
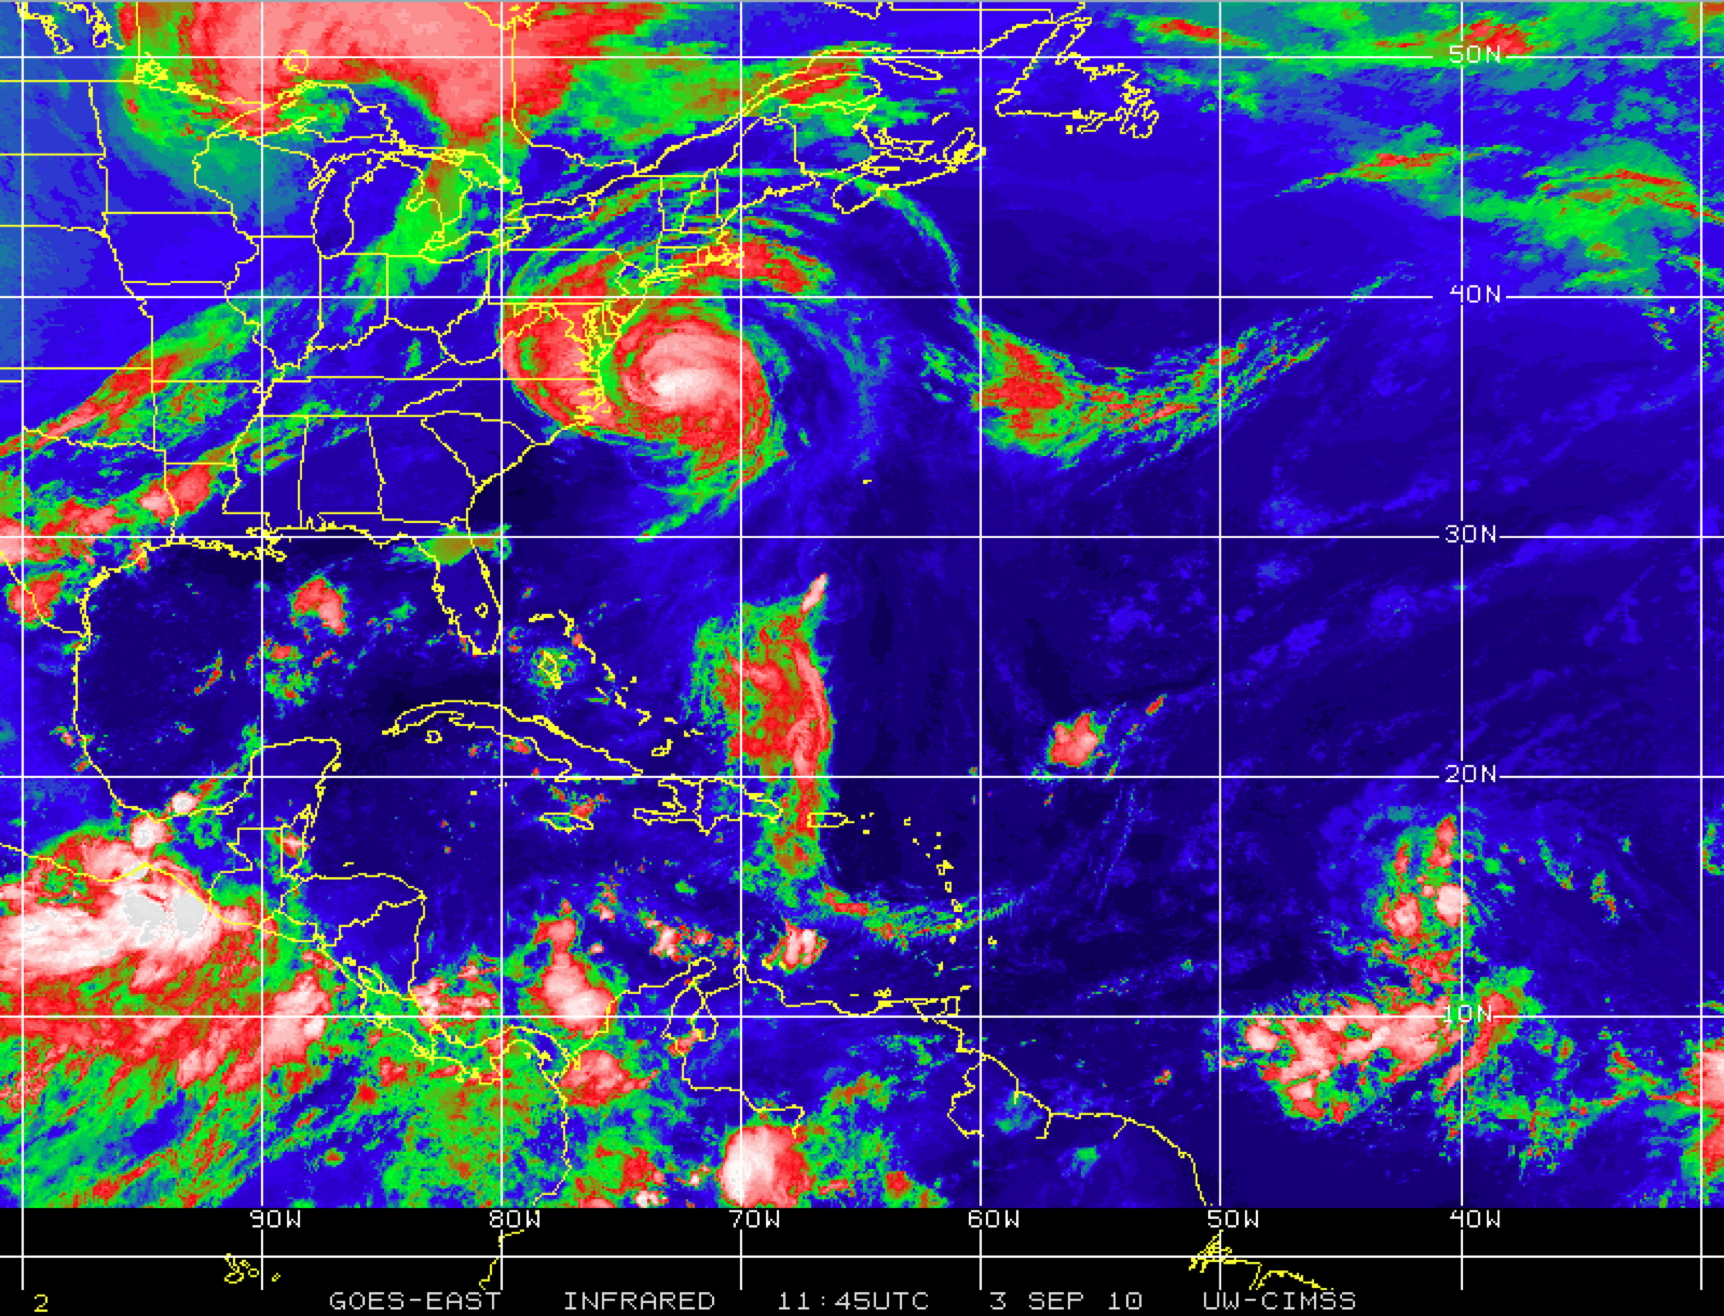
Prior to beginning our mission, it was of interest to assess the overall large-scale environment in and around Earl as depicted by satellite (Figure 2a-c). Earl is embedded in an upper level cyclonic circulation. A mid-upper level trough that is located over the Great Lakes area (Fig. 2) is expected to accelerate Earl towards to the NE. The water vapor image depicts some dry air coming into the storm from the SW. Hurricane Earl is experiencing moderate levels of wind shear 10-20 kt (Fig. 3). The GOES IR image shows that Earl has a healthy outflow. The New England coast is already experiencing the outer bands of Earl.
These two images (Fig. 5) below courtesy of the TC NRL web site show that the strongest convection in Earl is in northern half of the storm. Based on this, Earl has a highly asymmetric convective cloud signature.
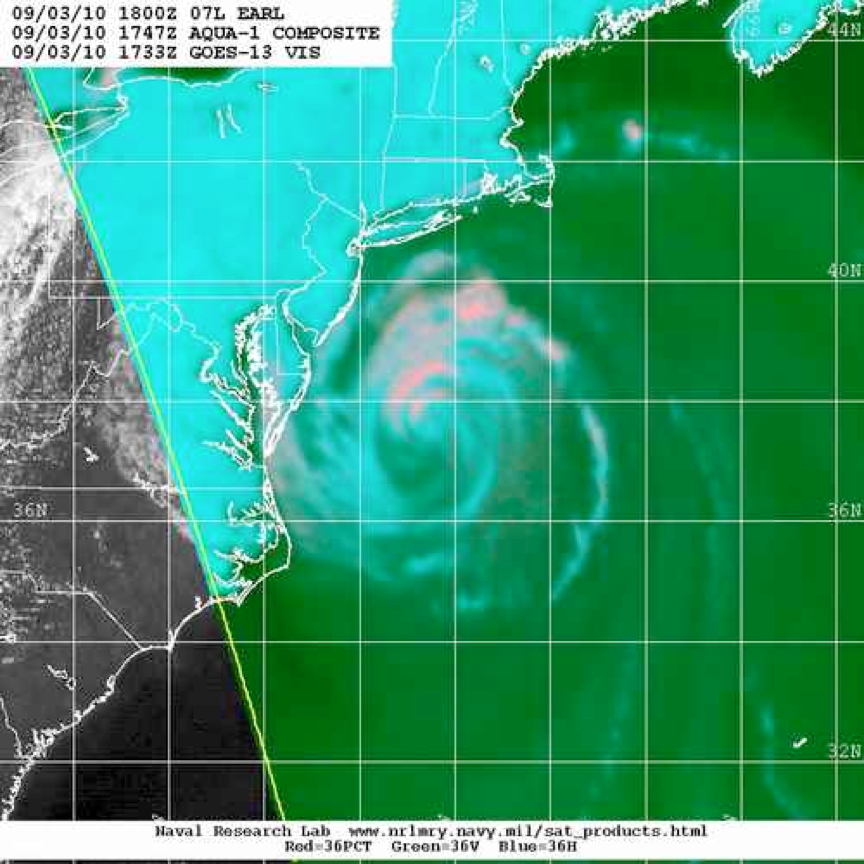
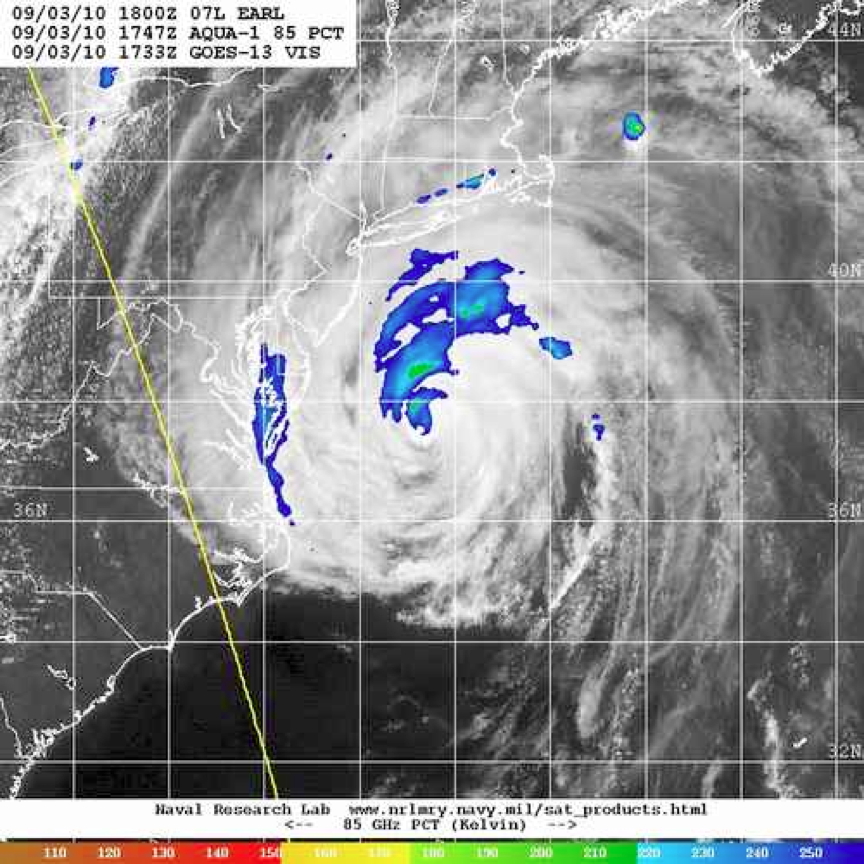
N43 took off from Richmond, VA at 2000UTC and headed to the IP. There were very little scatters on the south side of the storm. Our first pass through the storm was smooth. The SFMR values barely peaked above 50 kt. The following passes showed a weakening system. The inner core wind field has collapsed. Peak winds were found in the northern part at the turn points rather than the eyewall. Most scatters were in the NW quadrant of the storm.
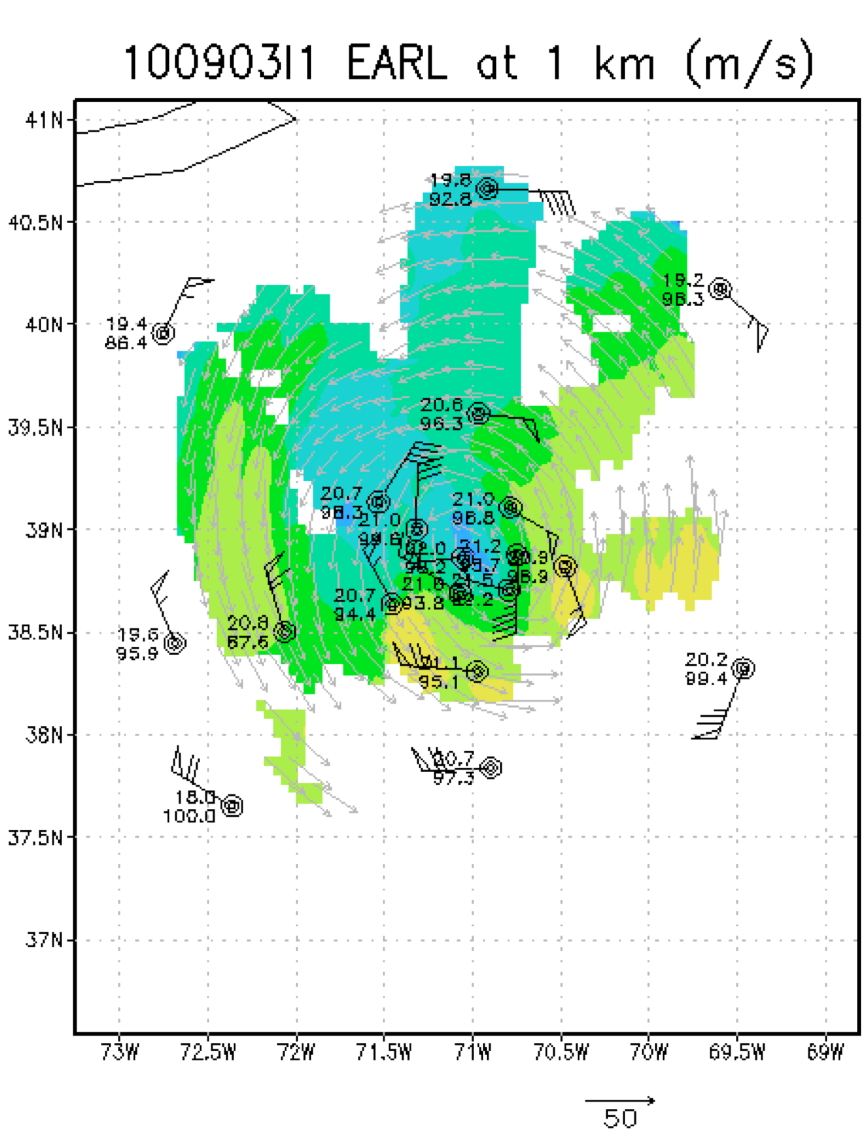
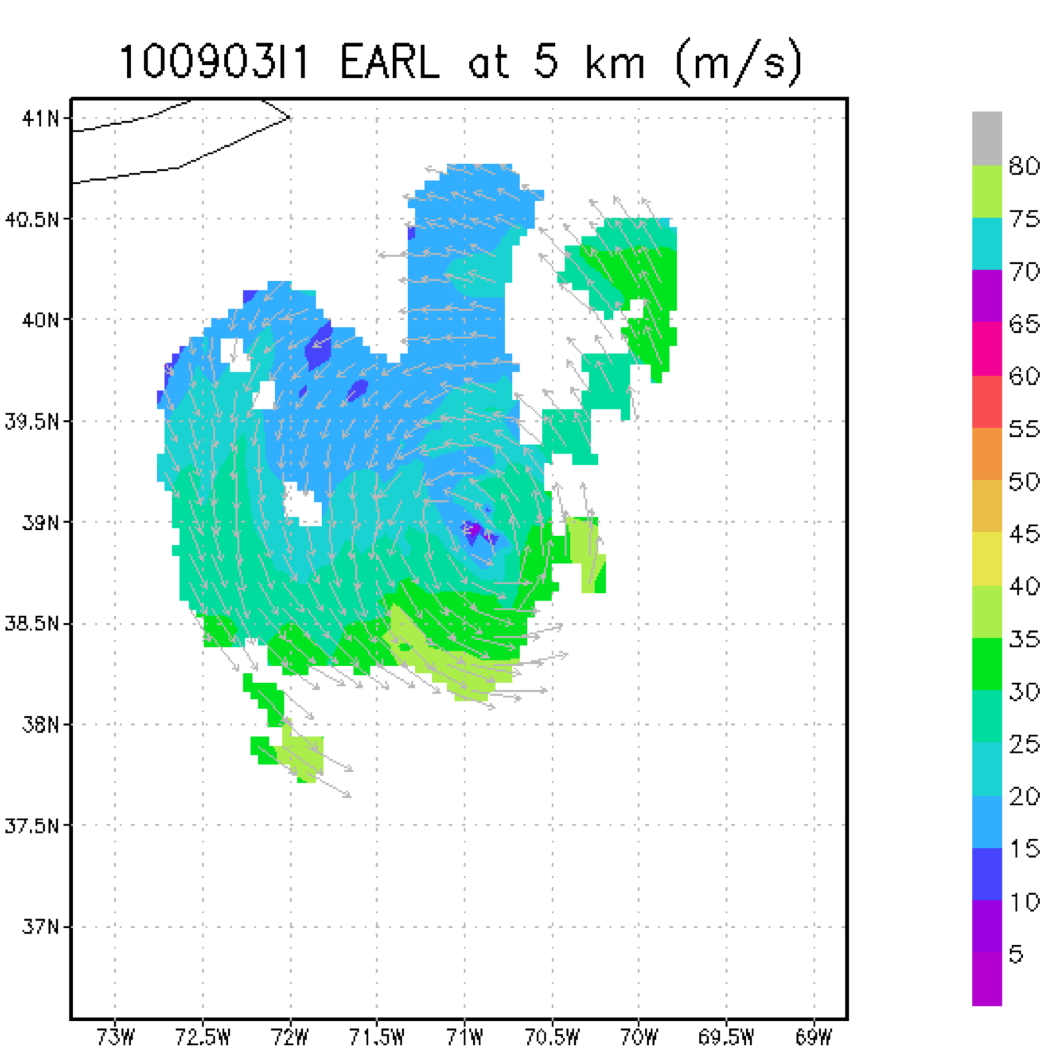
Below are two radar "quick looks" at 1 and 5 km.
|
|
| Fig. 6. Quick-look (1 and 5 km altitude) Doppler wind analyses from NOAA 43 during flight 100903I1. | |
Earl continued to accelerate northeastward and weaken as it passed southeast of Long Island (depicted by the black line in the upper left of the images). The images show the horizontal winds within the inner core of Earl. These images are at 1 km and 5 km, using a composite of winds from four legs oriented southwest-northeast, northwest-southeast, east-west, and south-north. Wind, temperature and relative humidity from GPS dropsondes dropped from the P-3 are also visible at 1 km altitude. Like in the previous mission the strongest winds are located on the southeast side of the storm at 1 km altitude, rotating only slightly clockwise in azimuth with increasing altitude until it is southeast of the center at 5 km. This asymmetry in the wind maximum with increasing altitude is suggesting that Earl is encountering vertical shear of the horizontal wind over the vortex from the increasing westerlies aloft impacting the storm as it moves further northward. The peak winds continue to weaken and the radius of the maximum wind is continuing to increase, suggesting Earl is weakening rapidly as the vertical wind shear over the center continues and the storm accelerates northeastward. Other changes evident are a much more asymmetric wind field with stronger winds on the southeast side of the storm. These changes suggest the storm is likely becoming more extra-tropical in nature.
Our drop pattern was to drop sondes at the turn points, midpoint, eyewall and center drops at 1st and last pass through the eye. In the middle our flight pattern, after our second pass, before the third pass we descended to 8,000 ft (radar) for the final figure 4 (Ocean Winds). Also, in order to minimize interference between the TDR and Ocean Winds hardware, the LF radar was run in "sector scan mode" when the aircraft was at lower altitude during the final figure 4 pass through the storm.
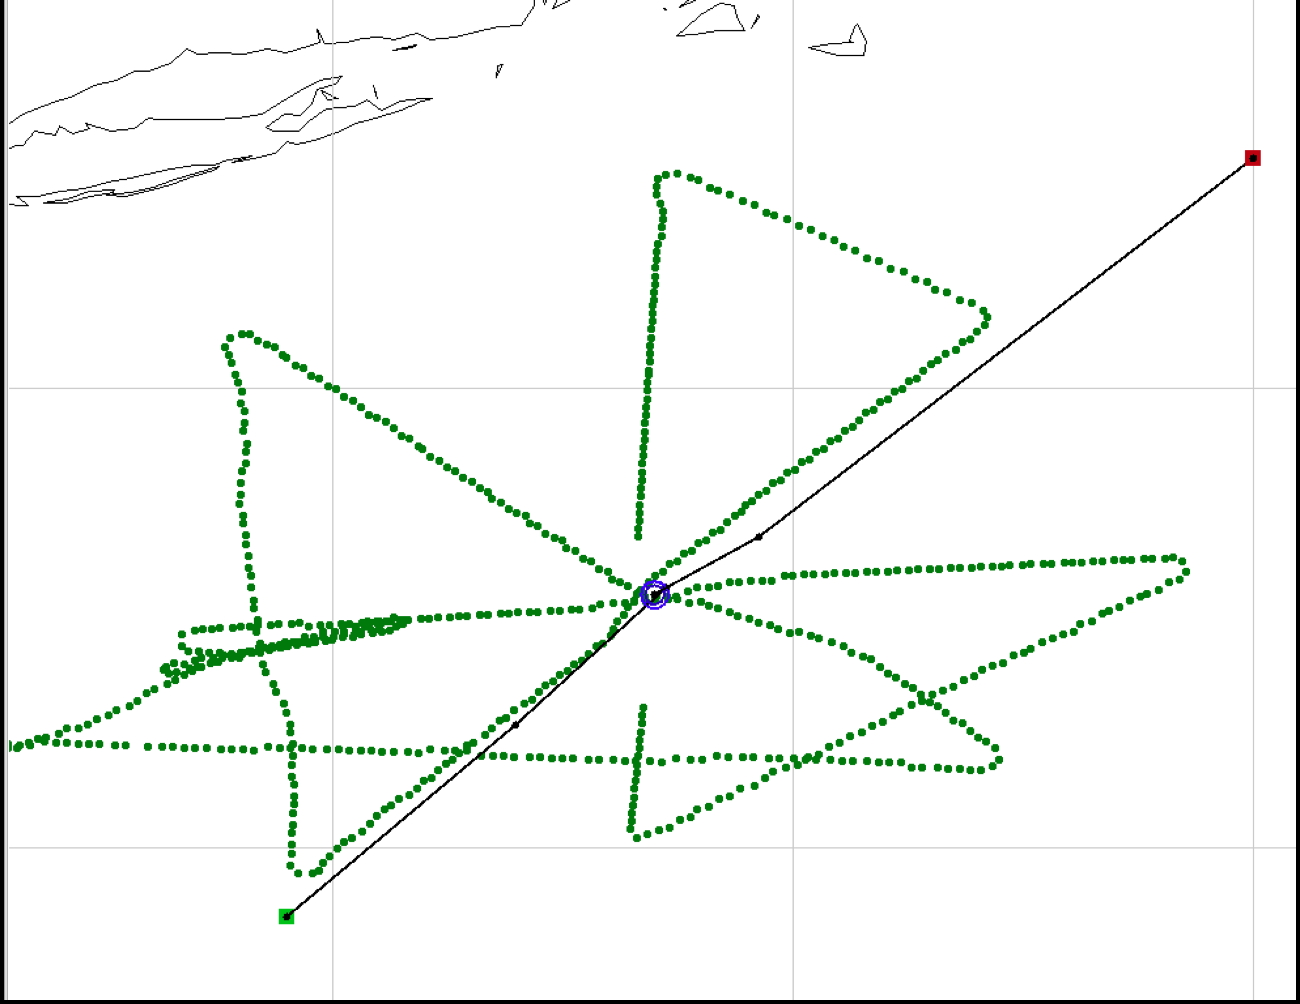
Figure 7 shows the actual flight track we flew. We shorten the legs on the SE side of the storm. After our last pass (E-W), we did a few repeated eye penetrations for the Ocean Winds experiment.
Problems :
The radar, flight-level, SFMR, and dropsonde systems for the most part all worked well on this flight. Doppler analyses were conducted and successfully sent off the plane in real-time. There were times that the TDR froze and that is noted in the radar logs. The radar was quickly brought back up. The CCN counter was running well.
Suggestion:
There should be a way to add a new take-off and landing location on tkmap. Richmond, VA was not in the predetermined list of places we typically land/take-off so we picked the closest airport on the list (Andrews AFB).
Shirley Murillo
10/1/10
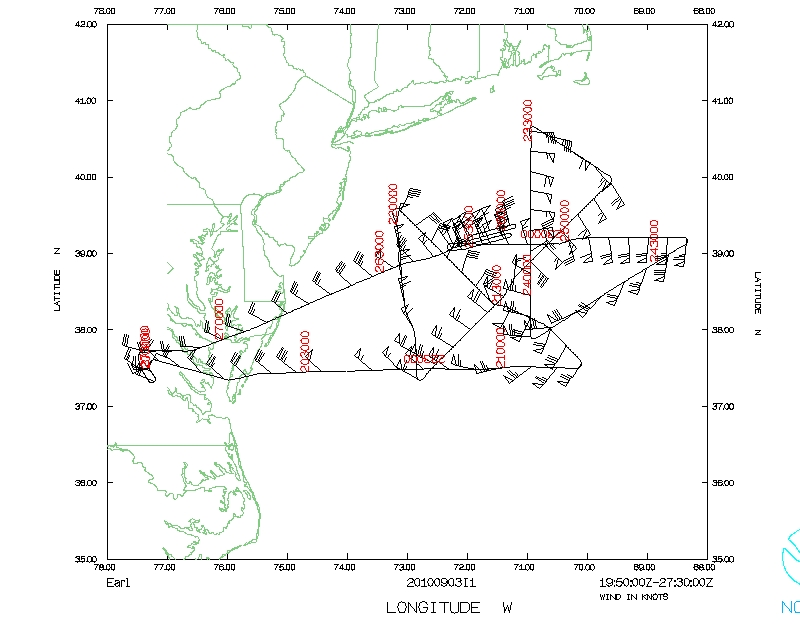 Flight track |
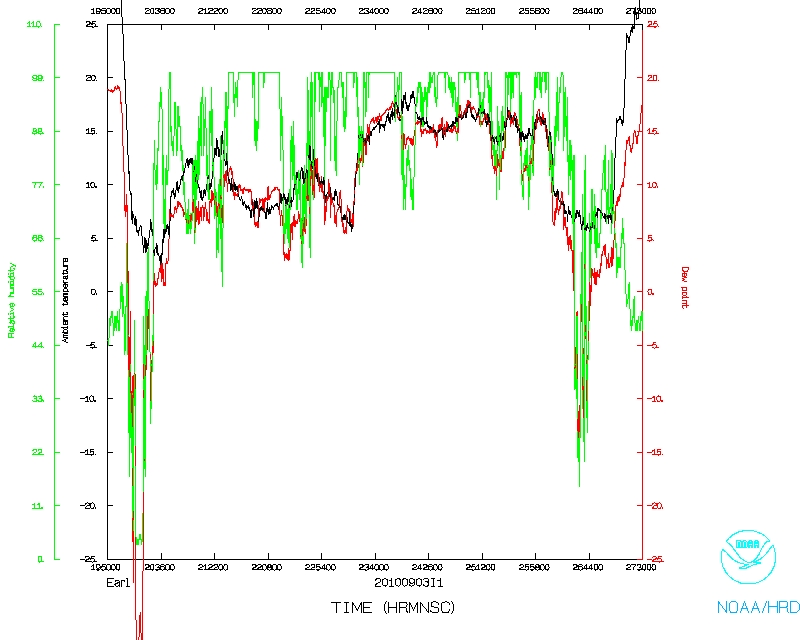 Temperature and Moisture |
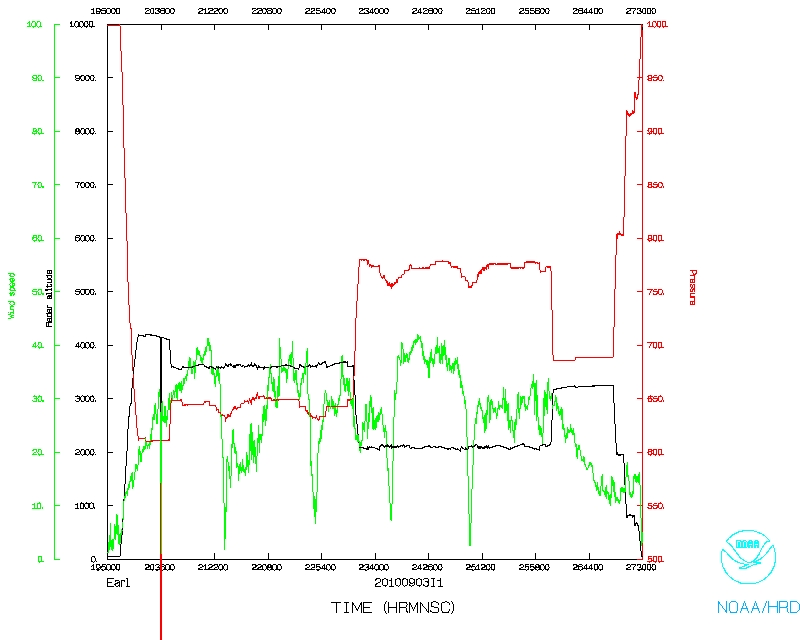 Wind and Atlitude |
Page last updated January 10, 2011
Return to Mission page.