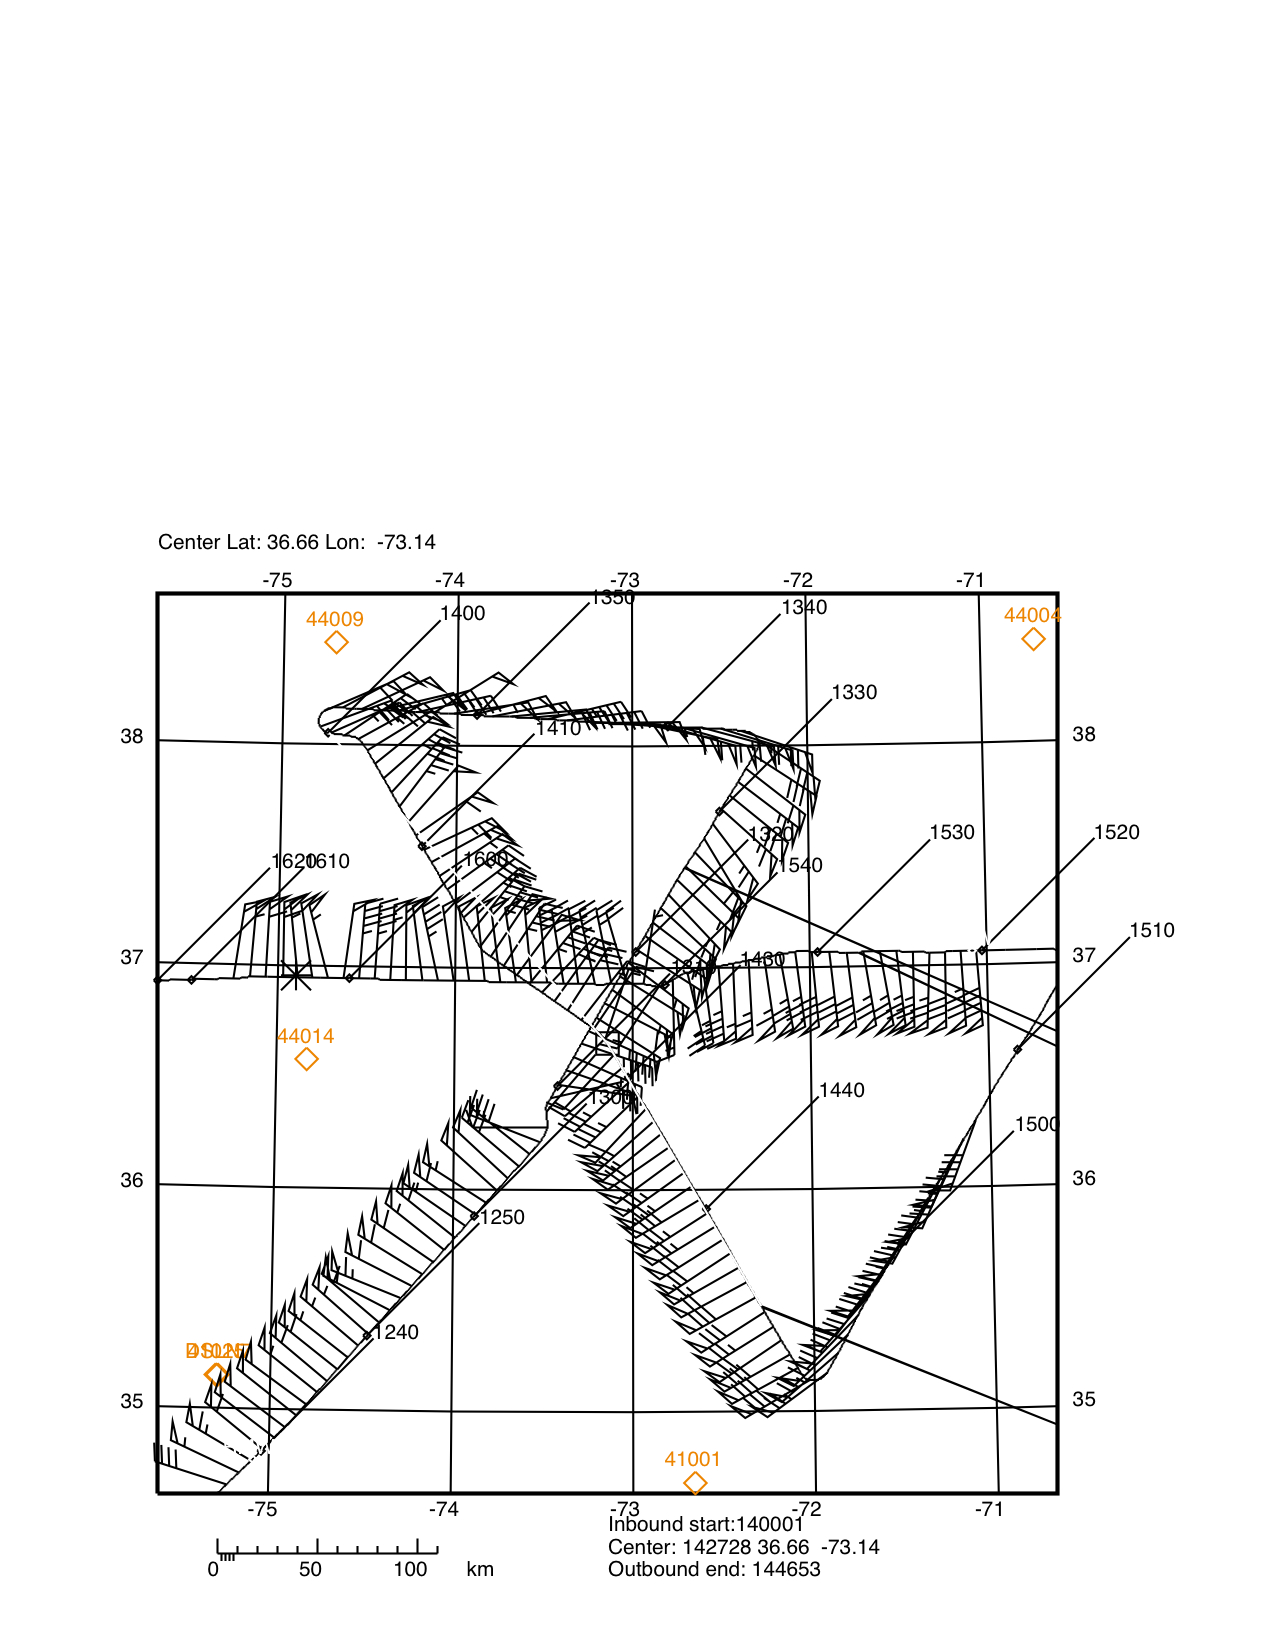
Figure 1. Proposed flight plan
| Aircraft Commander | Carl Newman |
| Co-pilot | Cathy Martin |
| Co-pilot | Mark Sweeney |
| Co-pilot | Tanner Sims |
| Flight Engineer | Joe Klippel |
| Flight Engineer | Paul Darby |
| Navigator | Devin Brakob |
| Flight Director | Ian Sears |
| Flight Director | Barry Damiano |
| Data Technician | Joe Bosko |
| Data Technician | Terry Lynch |
| Electronics Technician | Todd Richards |
| Electronics Technician | Bill Olney |
| Dropsonde Operator | James Warnecke |
| Lead Scientist | John Gamache |
| Radar Scientist | Paul Reasor |
| Dropsonde Scientist | Eric Uhlhorn |
Mission Plan :
Continued monitoring of Earl structure and intensity change, and the very beginnings of extratropical transition. The plan was to fly a 105-nm butterfly pattern, taking off and landing at MacDill AFB. The ferry time to and from the in-pattern portion of the flight would both be about 2.4 h. Time in pattern would be about 3.4 h. Radial flight legs would again be from (bearing from storm center) 210° to 030°, followed by 330° to 150°, and the third would be from 090° to 270°. A sonde was to be dropped in the eye during the second pass through the hurricane. This was the second of two NOAA42 flights to drop AXBTs, to document the sea-surface-temperature structure following Earl. This flight was an IFEX flight, in this case a tail-Doppler radar mission designed to document the structure and intensity change of Earl, and requested by the NWS Environmental Modeling Center, to augment the Doppler data sets on which to develop/refine/test HWRF Doppler data assimilation.
Mission Summary :
| Take off | Landing
| MacDill AFB FL | 03/10:42 UTC
| MacDill AFB FL | 04/18:36 UTC
| | ||
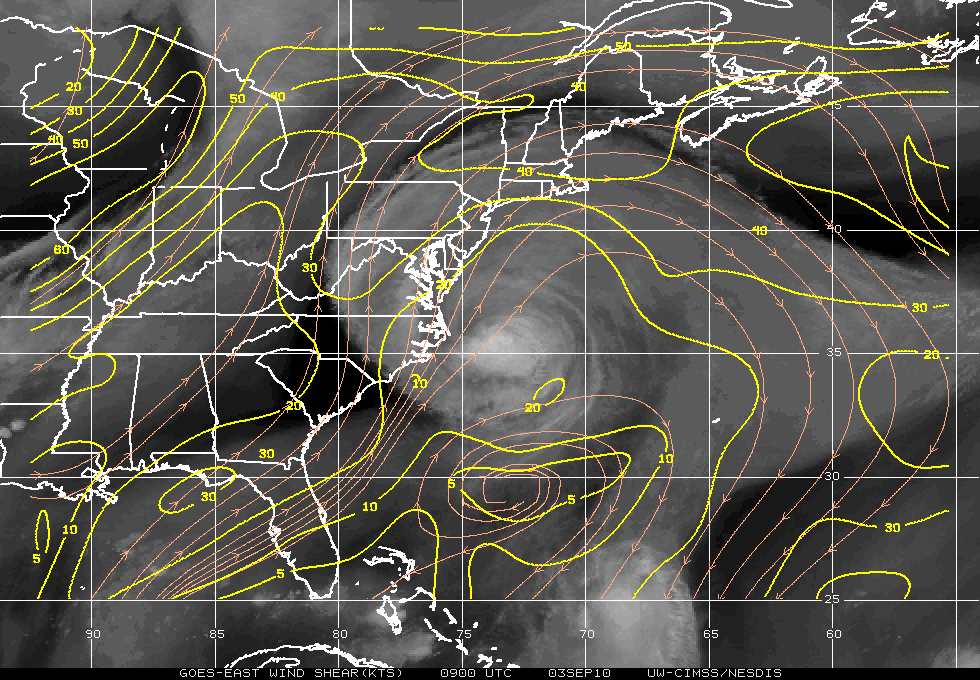
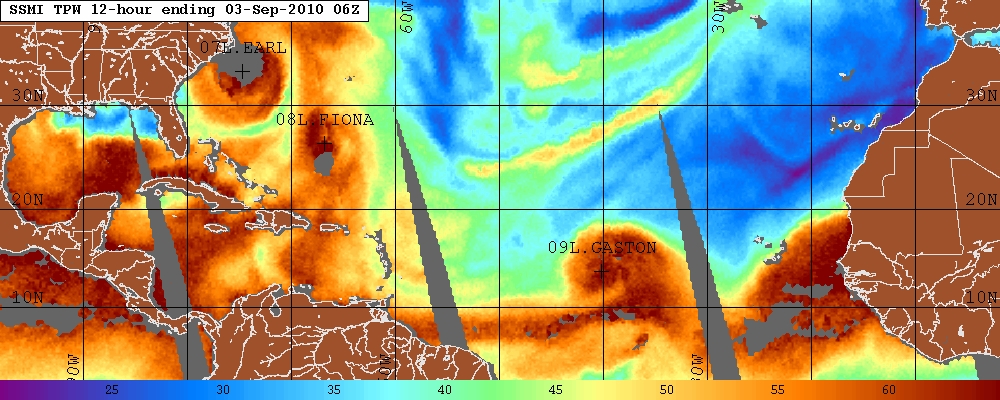
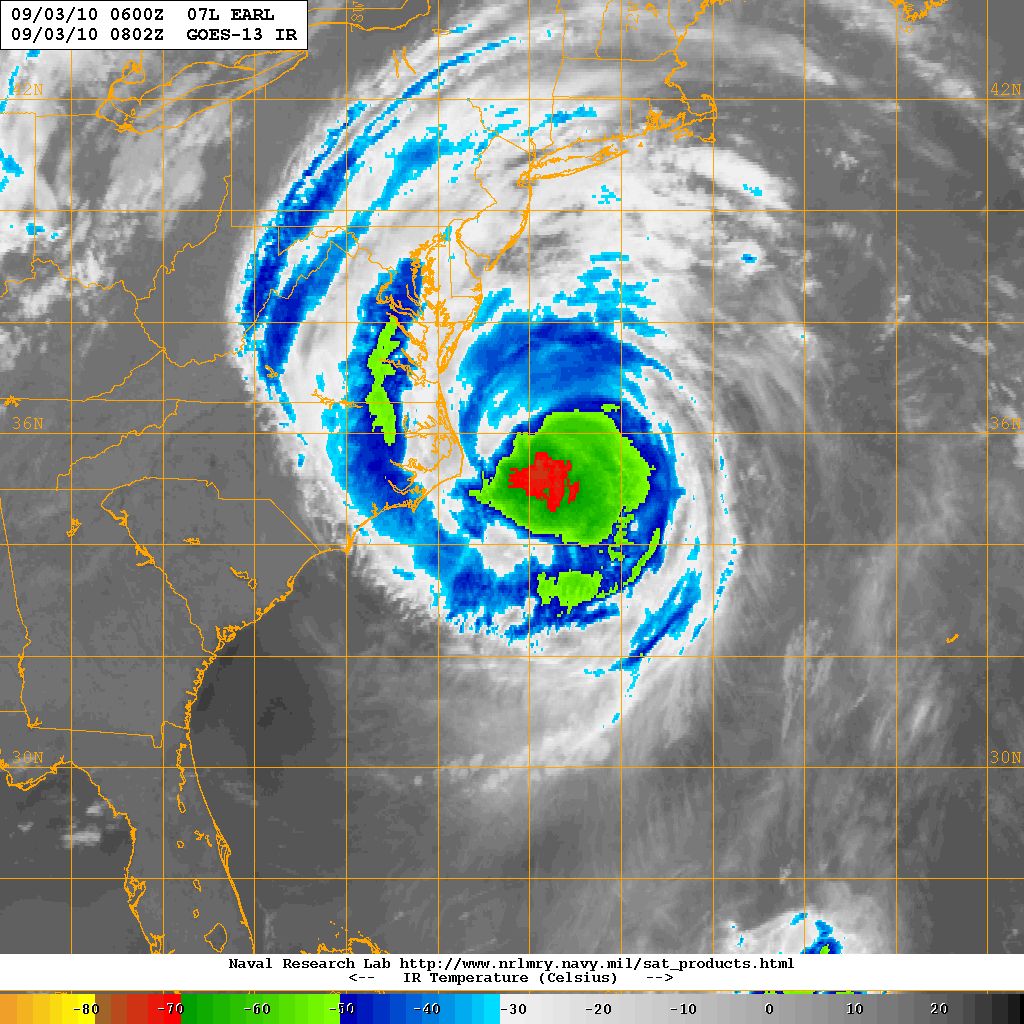
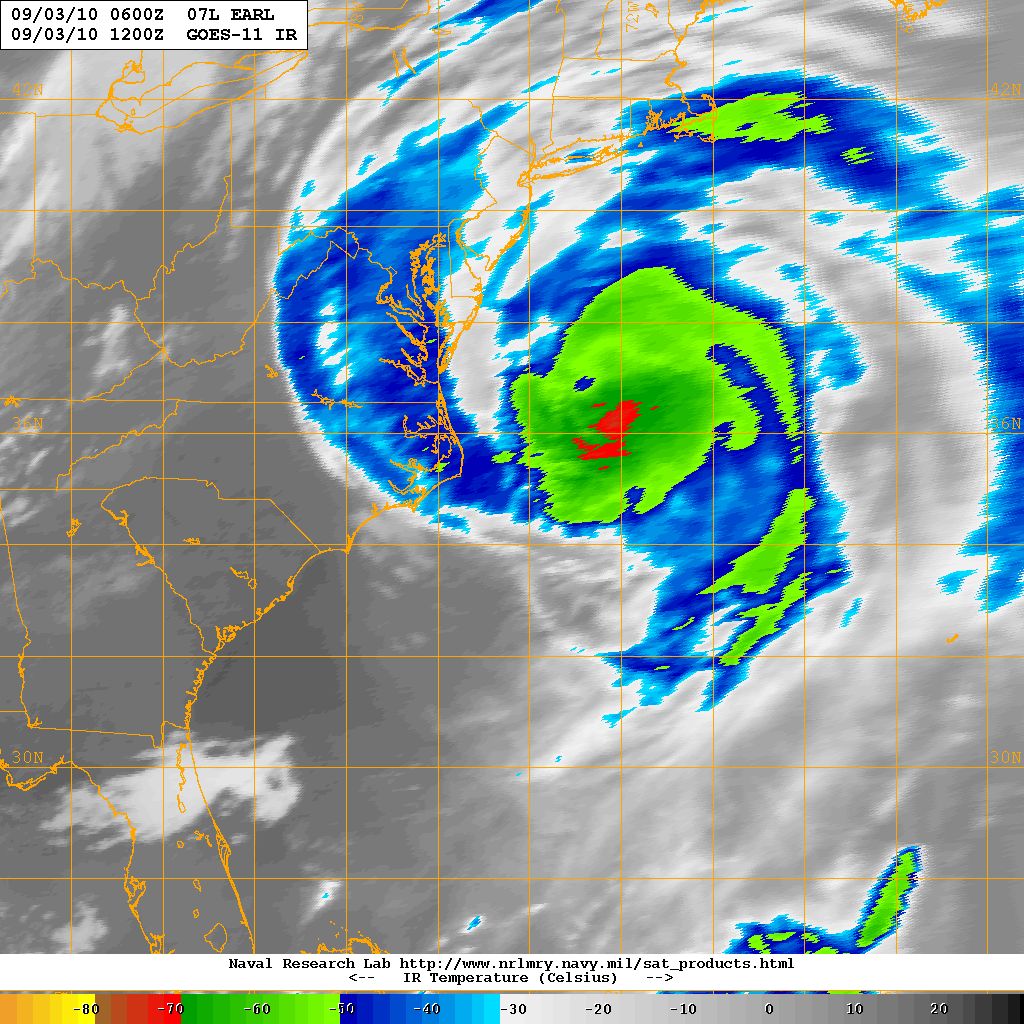
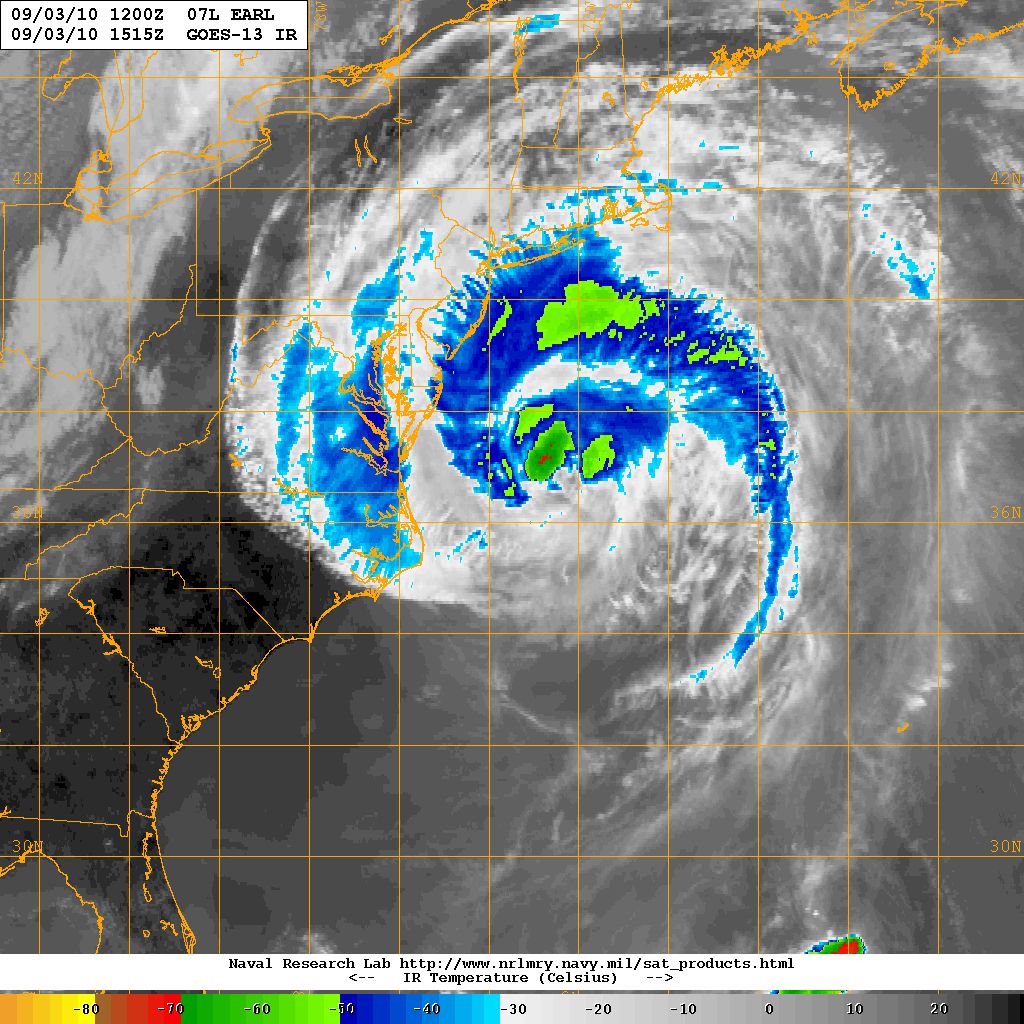
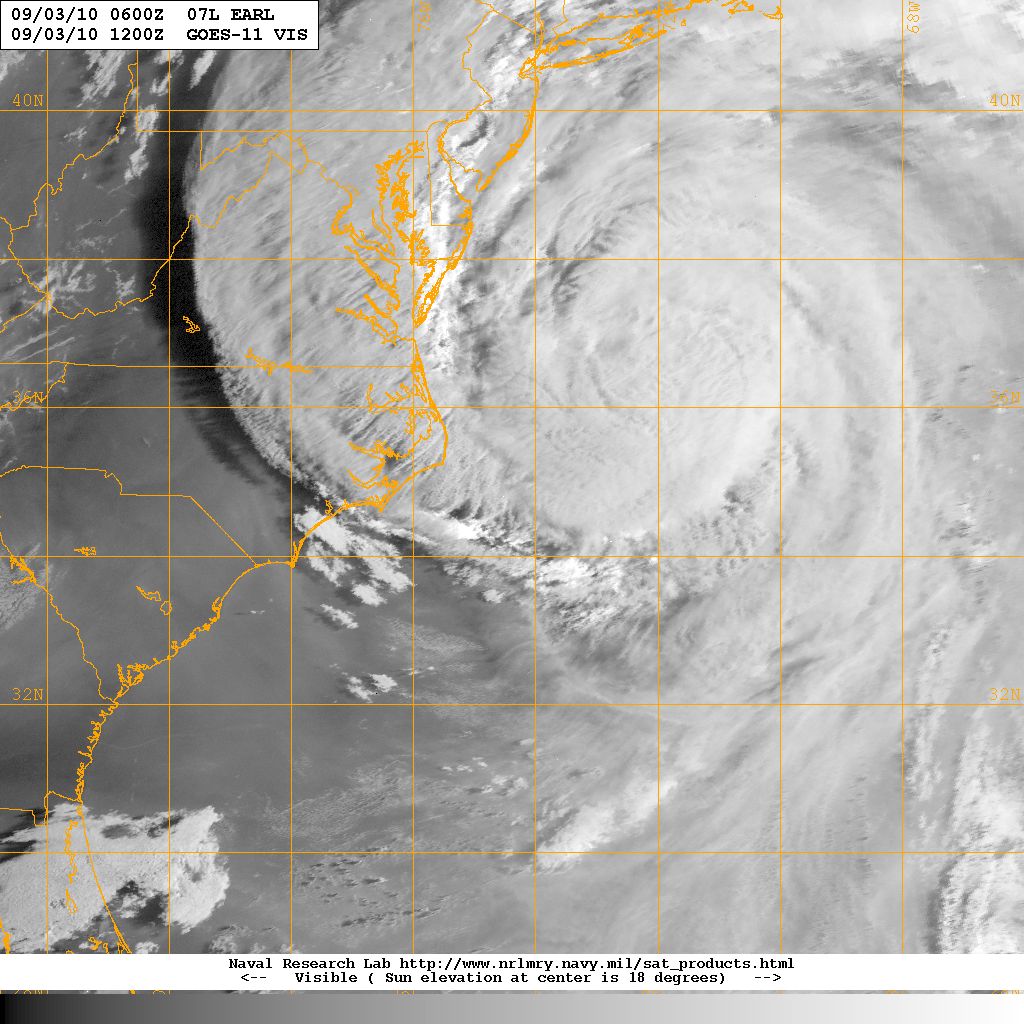
Earl was still a 90-kt hurricane at takeoff time. CIMMS imagery in Fig. 3 indicates that Earl was experiencing about 15 kts of deep SW shear. Except for air coming off the continent, it appears that Earl was still relatively protected from any very dry air (Fig. 4). By the end of the flight, the infrared image of Earl was beginning to deteriorate rapidly, probably as the storm encounter the colder waters north of the Gulf Stream.
NOAA 42 took off 2.7 h late from MacDill at 1042 UTC, as a result of a need to deal with one major data issue, and then one major mechanical issue. When asked if this mission should continue, the LPS stated that this was one in a series of 6 12-hourly missions documenting the structure and intensity of Hurricane Earl, and it was important to fly this mission if safety and crew rest allowed. Since this was the last mission of NOAA 42 into Earl, it was decided that the mission did not need to be shortened to keep the crew to a 12-h schedule. The aircraft had also been fueled for a 9-h flight requiring the aircraft to fly for approximately 8 hours to avoid any need for fuel dumping. Thus, in spite of a very late start the entire proposed 8+ hour pattern was flown. The official intensity of Hurricane Earl was estimated to be 90 kt at the beginning of the flight and the intensity at the end of the flight was estimated to be 75 kt. The storm averaged a motion toward a heading of 20° at 18 kt (9 m/s).
a |
b |
c |
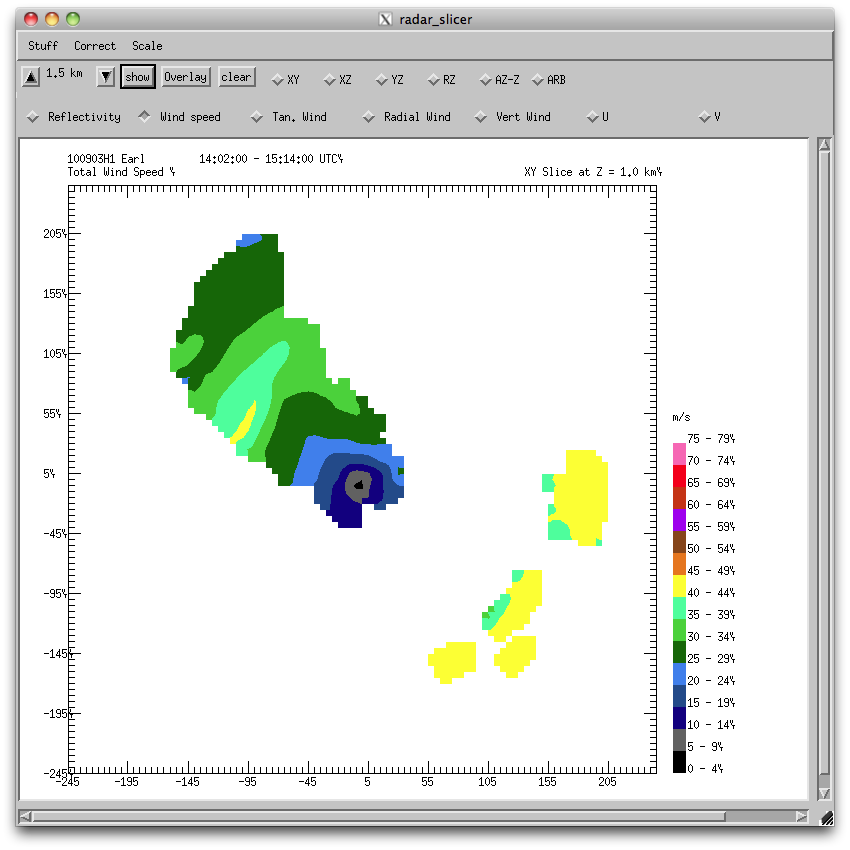
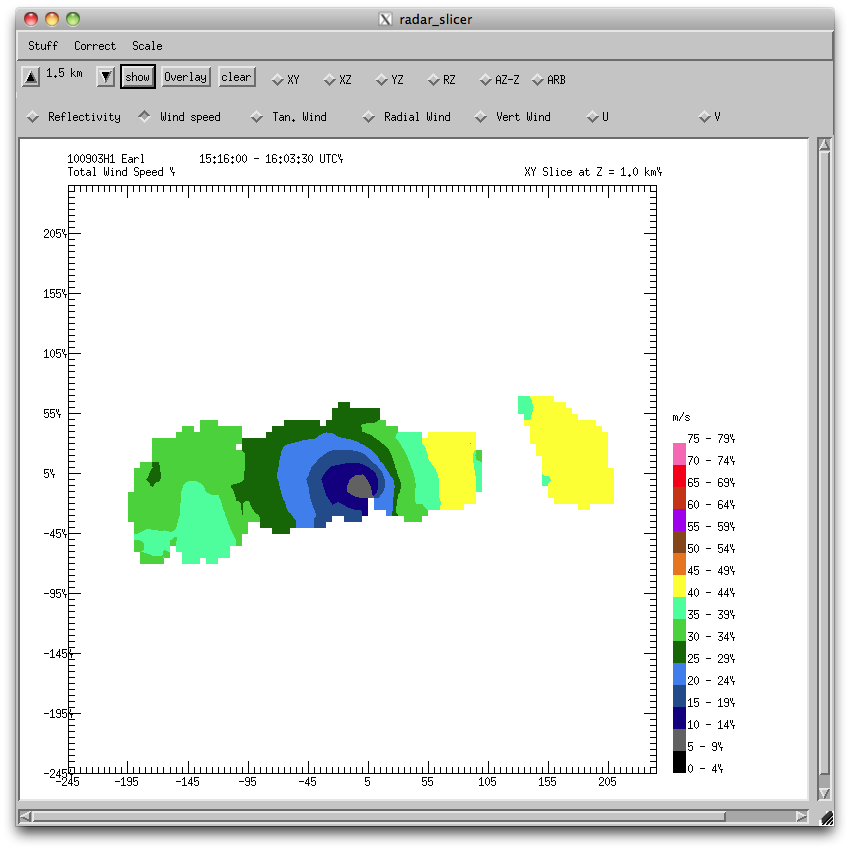
As planned, NOAA 42 made three penetrations of Hurricane Earl, with nominal radial leg lengths of 105 nm. The first was from a bearing from storm center of 210° to a bearing from storm center of 030° (SSW to NNE). At 1232 UTC we encountered a rainband that was quite stratiform in nature. The inbound leg from 210° had a very flat wind profile, being nearly 60-65 kt extending out to 80 nm or so. Maximum FL and SFMR winds on this side were about 65 kts. The sondes indicated nearly saturated conditions at both 105 nm and at the radius of maximum wind. The 105 nm also showed a wind speed of 87 kt near the 850 mb level. The outbound leg toward 030 also had a fairly flat wind profile, with maximum SFMR winds (60 kt) well inward of the maximum FL winds (80 kt). The maximum FL winds were near the turn point, or about 100 nm from the storm center. Both sondes, near the turn point and near the surface RMW, showed essentially saturated conditions from flight level to the surface.
The next inbound penetration leg was from 330°. Maximum surface RMW was again well inward from the maximum FL wind, and the maximum FL and SFMR were 67 and 55 kt, respectively. Again sondes showed near saturation at 105 nm and at the RMW. 82 56. On the outbound leg, toward 150°, the maximum flight level and surface SFMR winds were 82 and 56 kt, respectively. Both sondes again showed nearly saturated conditions from near flight level to the surface. On the following downwind leg, slightly higher winds were found than on the previous penetration, maximum FL and SFMR winds being 90 and 60 kt, respectively.
The final pass was from 090° to 270° (east to west). The sonde 105 nm to the east of storm center showed 3-4° TD depression from flight level to the surface. There was one short spike of 10-s FL winds at 98 kt. Otherwise the maximum seen was about 80 kt, and the maximum SFMR winds about 60 kt. On the outbound leg to the west maximum FL winds of 65 kt were well outward of maximum SFMR surface winds of 60 kt. Both RMW and 105 nm sondes showed essentially saturated conditions from flight level to the surface.
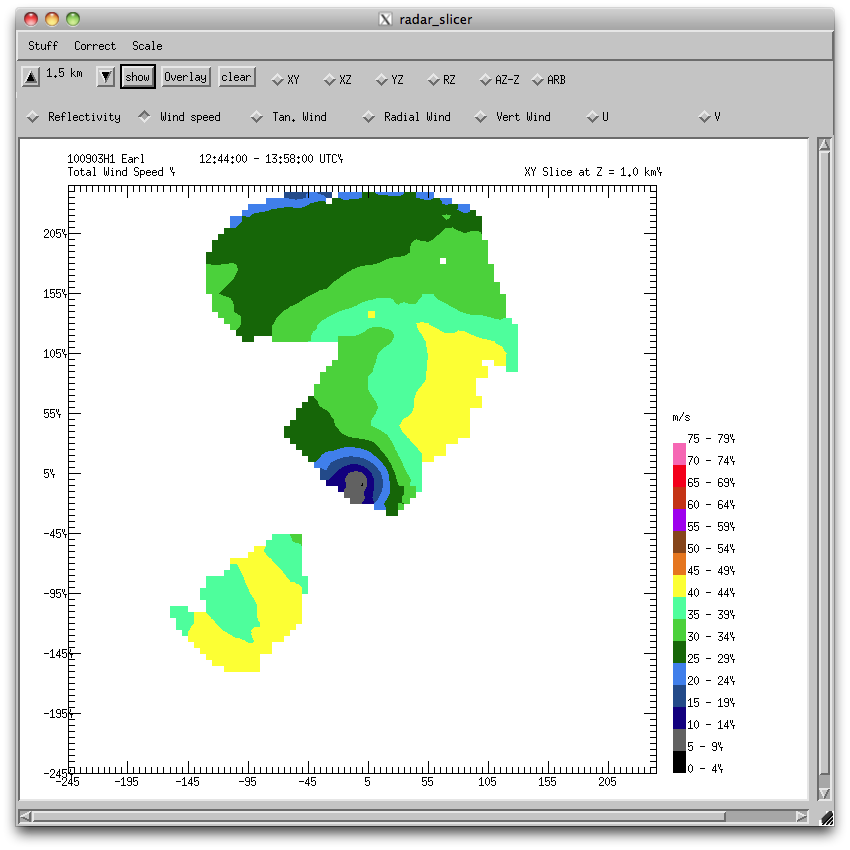
The highest winds during this flight actually seemed to be on the downwind leg on the SE side of the storm at approximately 100 nm from the center, showing extended periods of winds approaching 90 kt at flight level and 60 kt at the surface.
The sondes at 105 nm again showed nearly saturated conditions from all 6 directions with maximum dewpoint depressions being about 3-5 degrees on the east side, with all the others being perhaps 2° or less.
a |
b |
c |
a |
b |
c |
This mission was again very successful, thanks to the dogged determination of AOC crew to get the aircraft flightworthy, both mechanically and scientifically (see problem section below).
Problems :
The flight was first delayed by the failure of a main data circuit board, requiring the engineers to do a major replacement, rewiring job, which was done in approximately an hour plus. When the aircraft then rolled out for takeoff, it was discovered that a door to the APU was not fully retracted. The aircraft returned to AOC, and through a major effort of ground and flight personnel, a temporary fix was made to the APU to make the aircraft flightworthy, but also making the UPS unavailable (generally not used) during the flight. The first engine was started with the help of ground power, something called a "huffer." Once electrical power was being generated by the engine, all other engines could be restarted, and plenty of electrical power was available for science.
A weather related problem affected the radar analysis as well: the lack of scatterers above flight level on the SE side (more intense from wind point of view) of Hurricane Earl. Since sondes also cannot fill in above flight level, this affects the availability of winds in the three-dimensional analyses.
John Gamache
Sept. 20, 2010
serial | NetCDF | 1 seocnd data | |
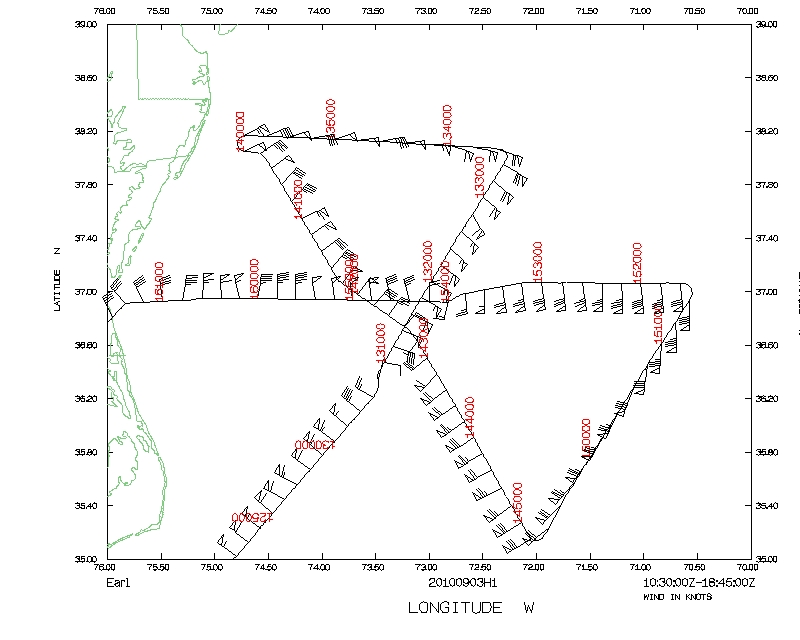 Flight track |
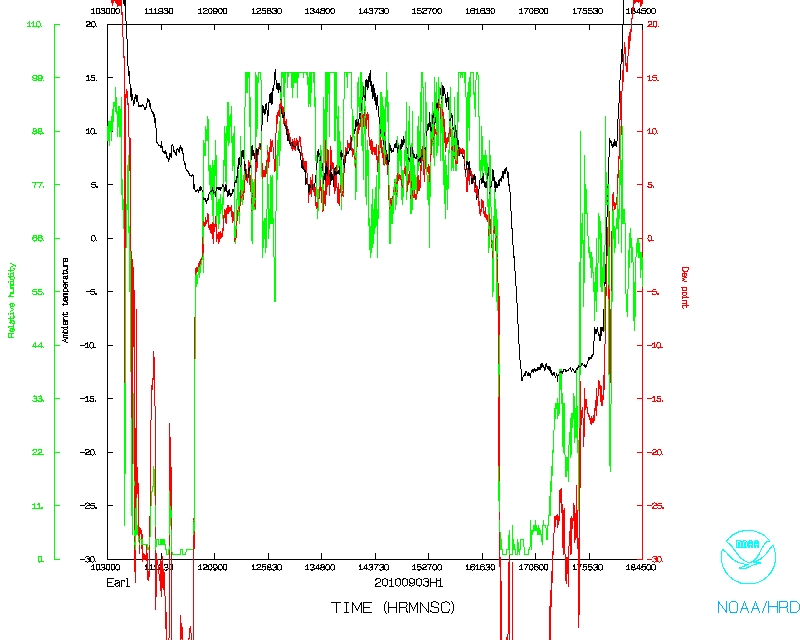 Temperature and Moisture |
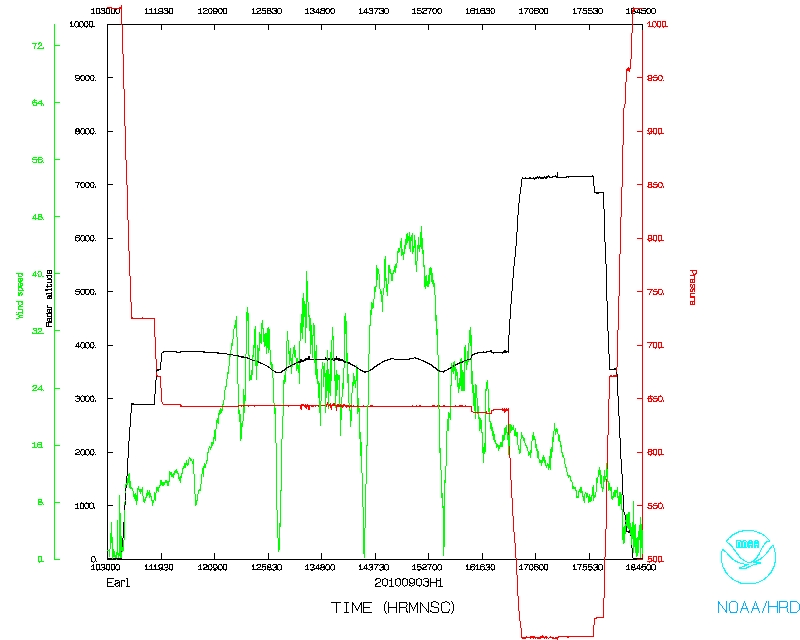 Wind and Atlitude |
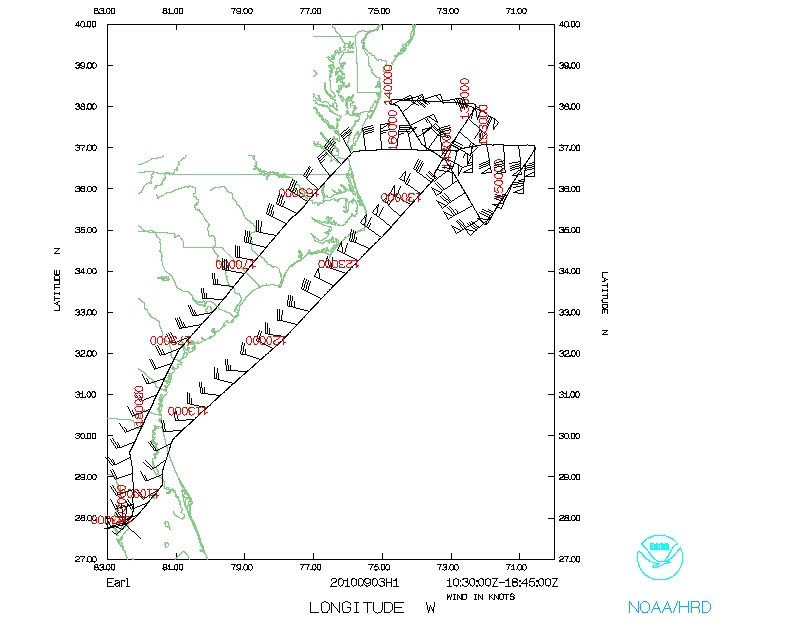 Flight track |
Page last updated Nov. 19, 2010
Return to Mission page.