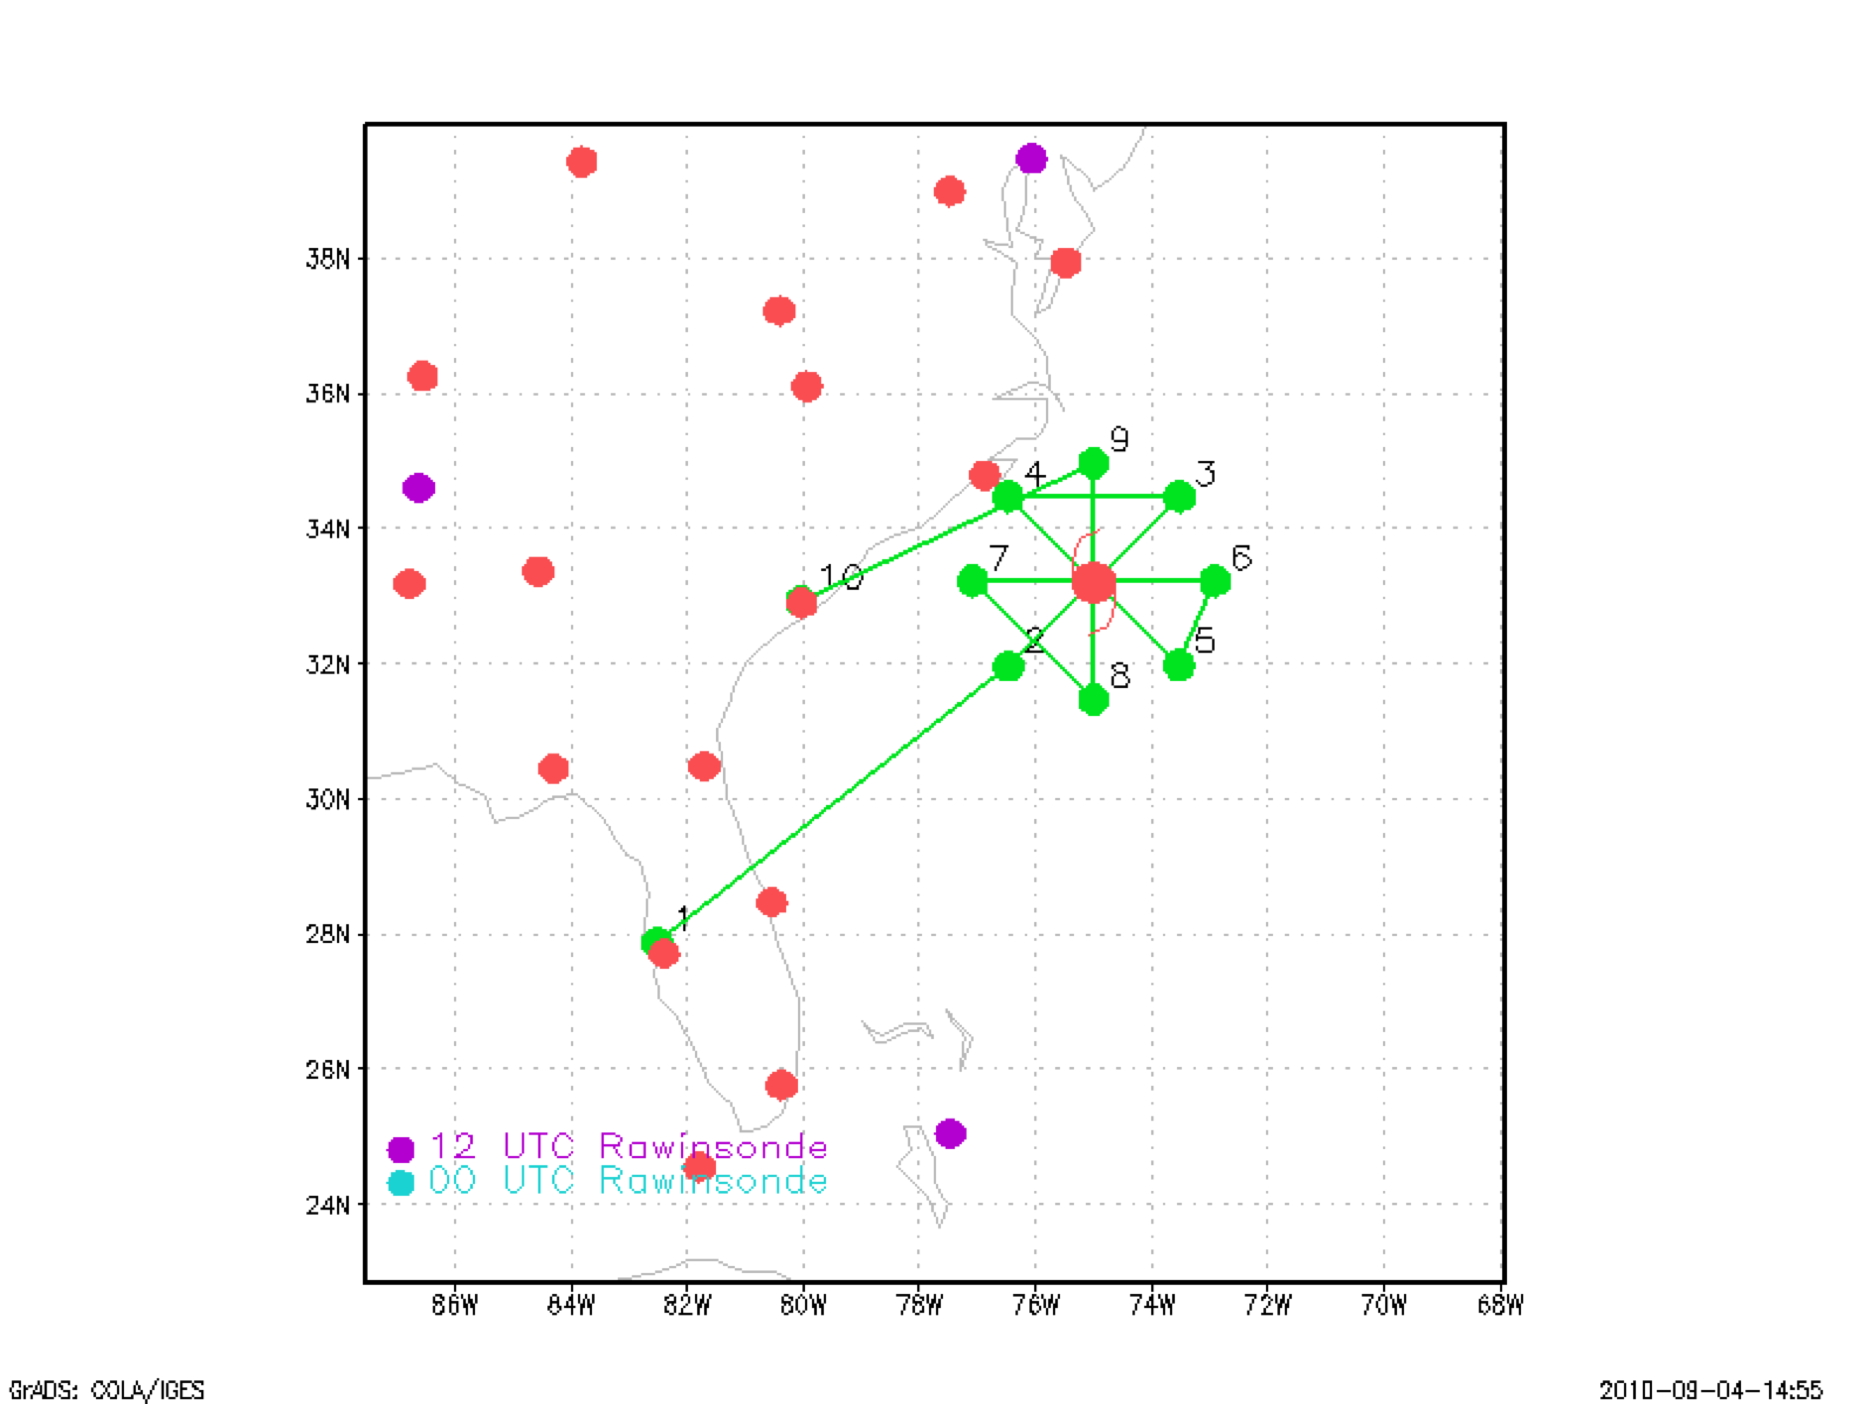
Figure 1. Proposed flight track for 100903I.
| Aircraft Commander |
| Co-pilot |
| Flight Engineer |
| Flight Engineer |
| Navigator |
| Flight Director |
| Flight Director |
| Data Technician |
| Engineer |
| Engineer |
| Electronics Technician |
| Dropsonde Operator |
| Lead Scientist | Rob Rogers |
| Radar Scientist | Shirley Muriilo |
| Dropsonde Scientist | Paul Leighton |
|
|
Mission Plan :
Conduct an EMC-tasked IFEX/TDR mission into Hurricane Earl, located off the South Carolina coast as a Category 3 hurricane. Fly a rotated Figure-4 (Fig. 1), with 105-nm legs and the IP on the southwest side. Fly the first leg at 12,000 ft radar altitude, then descend before the second figure-4 to 7000 ft for Ocean Winds interests. End up on the north side of the storm. If there is time, fly a few legs in and out of the eyewall. Land in Richmond, VA.
Mission Summary :
| Take off | Landing
| MacDill AFB FL | 02/20:06 UTC
| Richmond VA | 03/03:50 UTC
| | ||
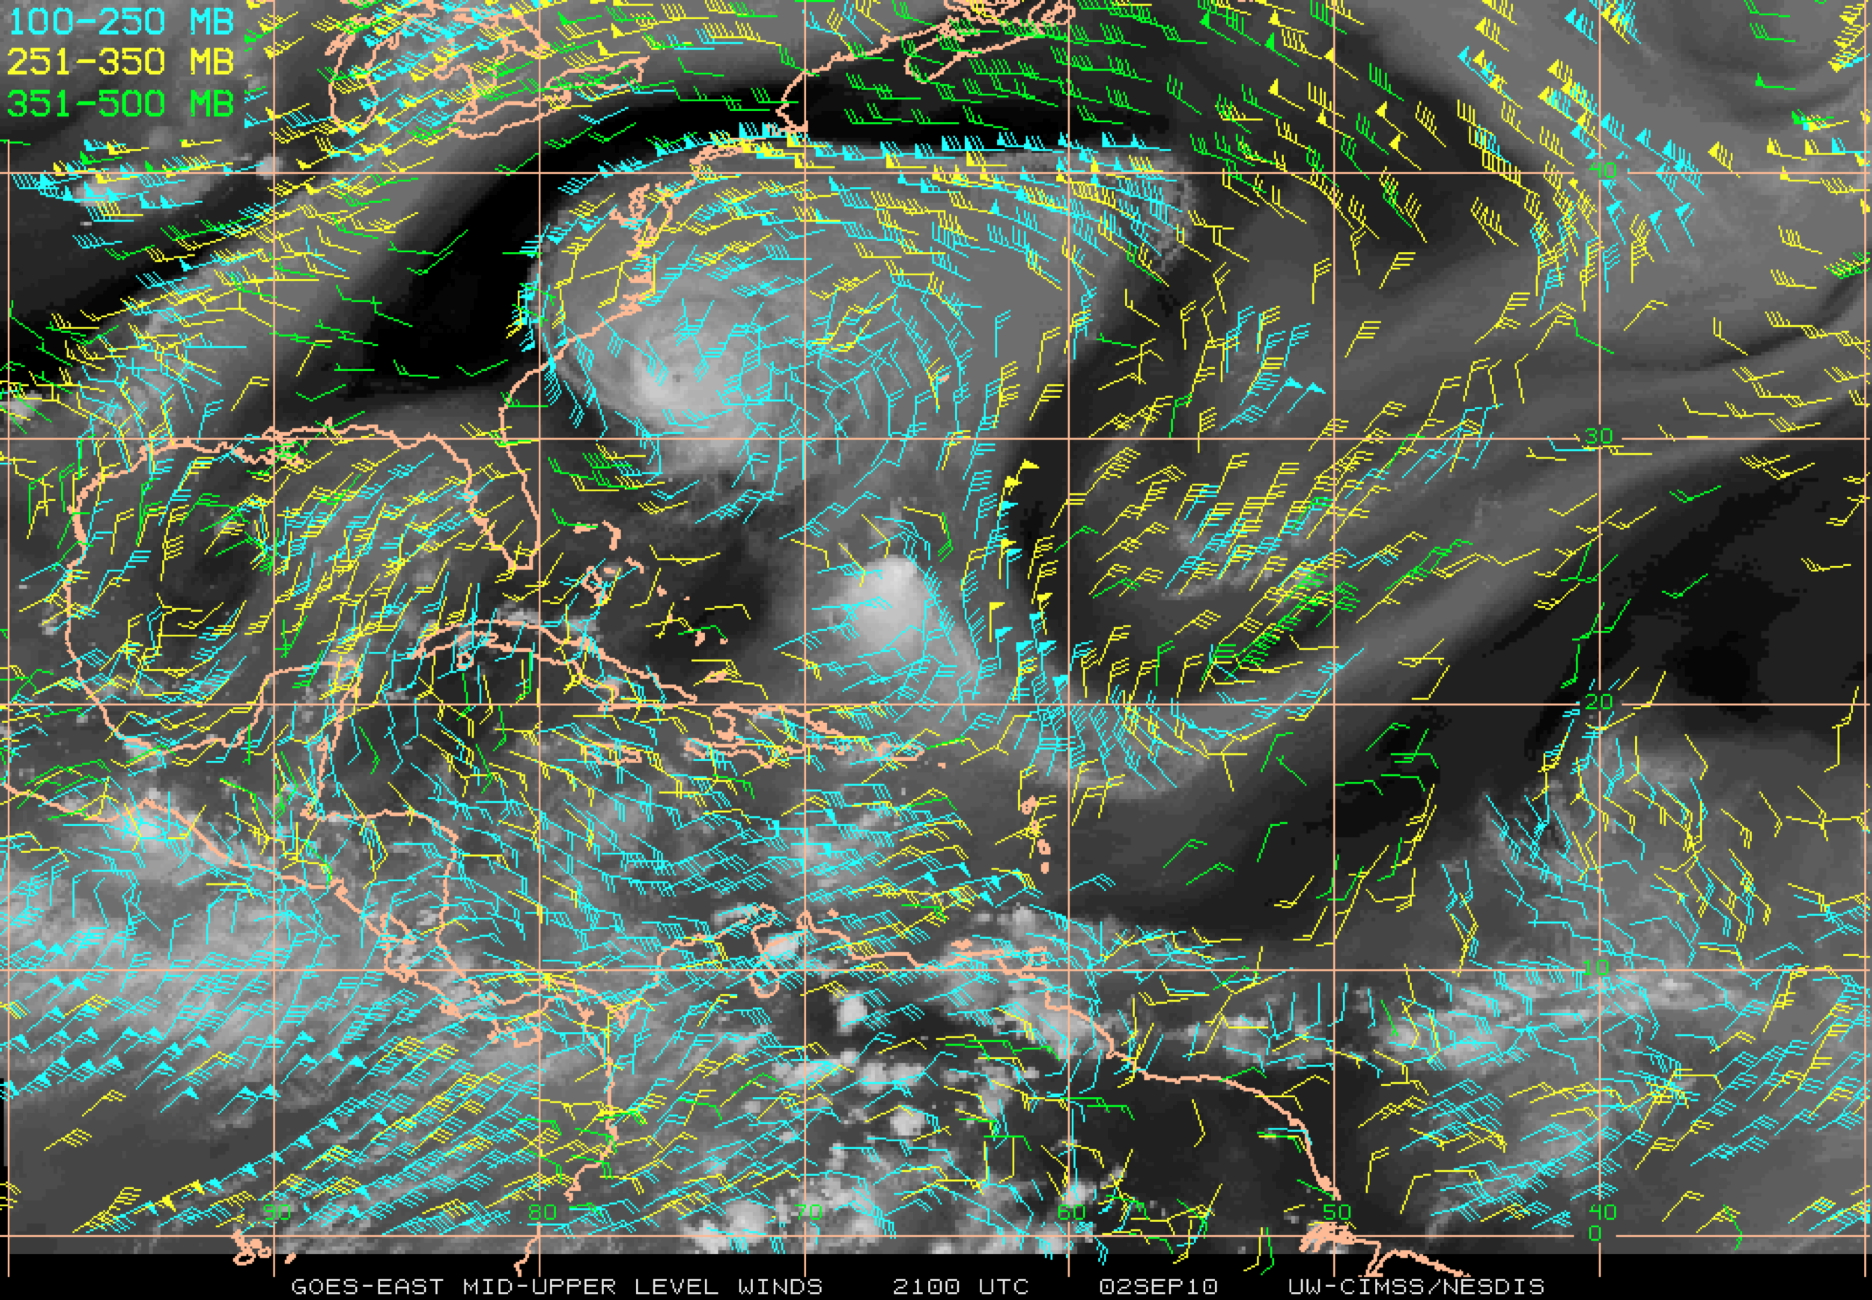
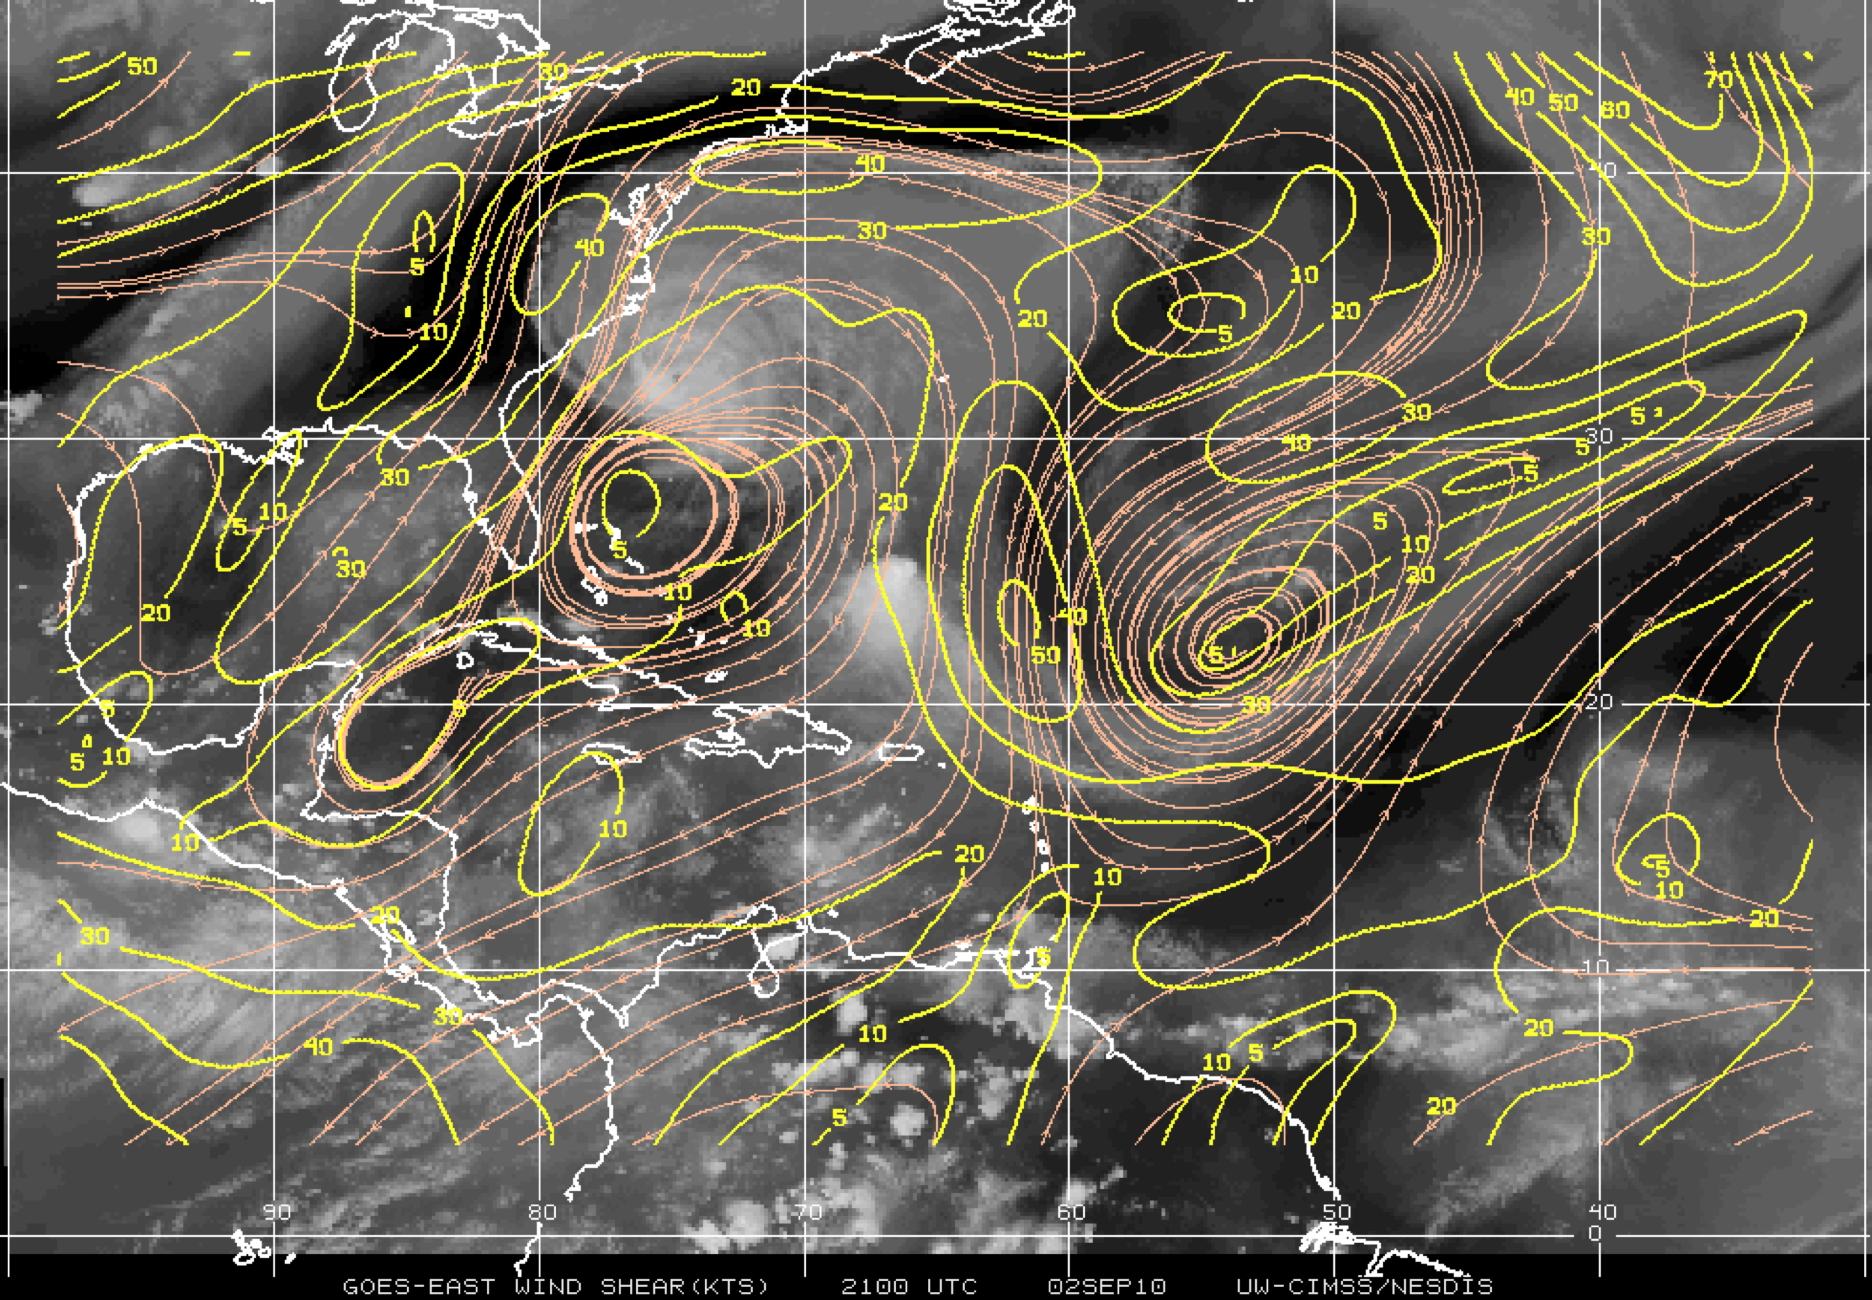
Earl was in located within a broad upper-level anticyclonic flow pattern (Fig. 2) with a trough approaching from the central U.S. The deep-layer shear over the storm center was analyzed by CIMSS to be southwesterly with a magnitude of about 15-20 kt (Fig. 3).
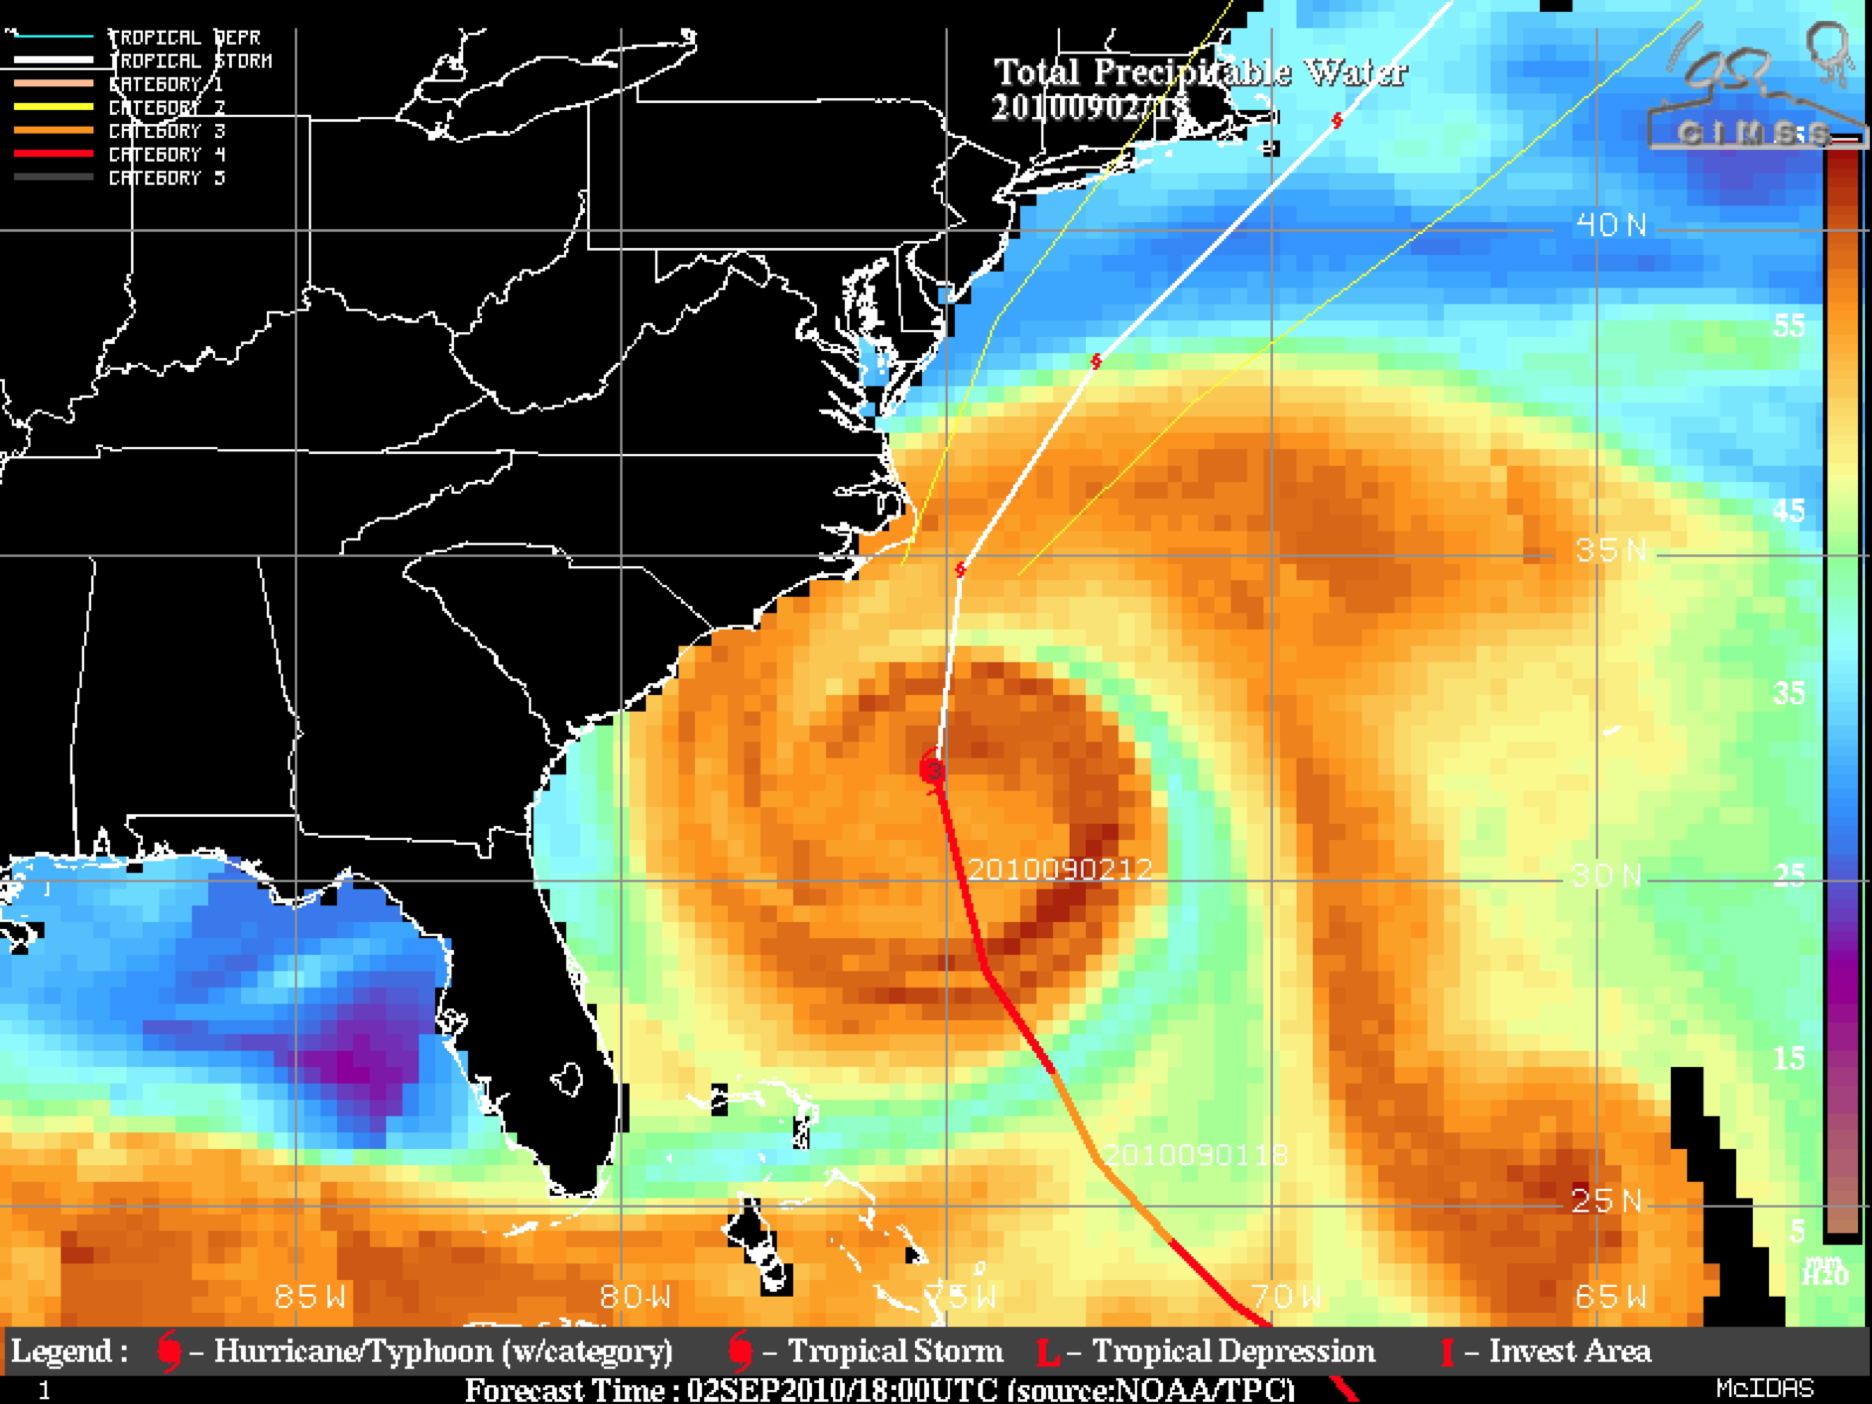
A ribbon of dry air is also seen from the Georgia coast and spiraling around the center to a narrow strip around the northeast side of the storm. On the visible image (Fig. 5) a central dense overcast is clear, though the eye has filled a bit from previously. There is some indication that the outflow is starting to be inhibited on the southwest side of the storm.
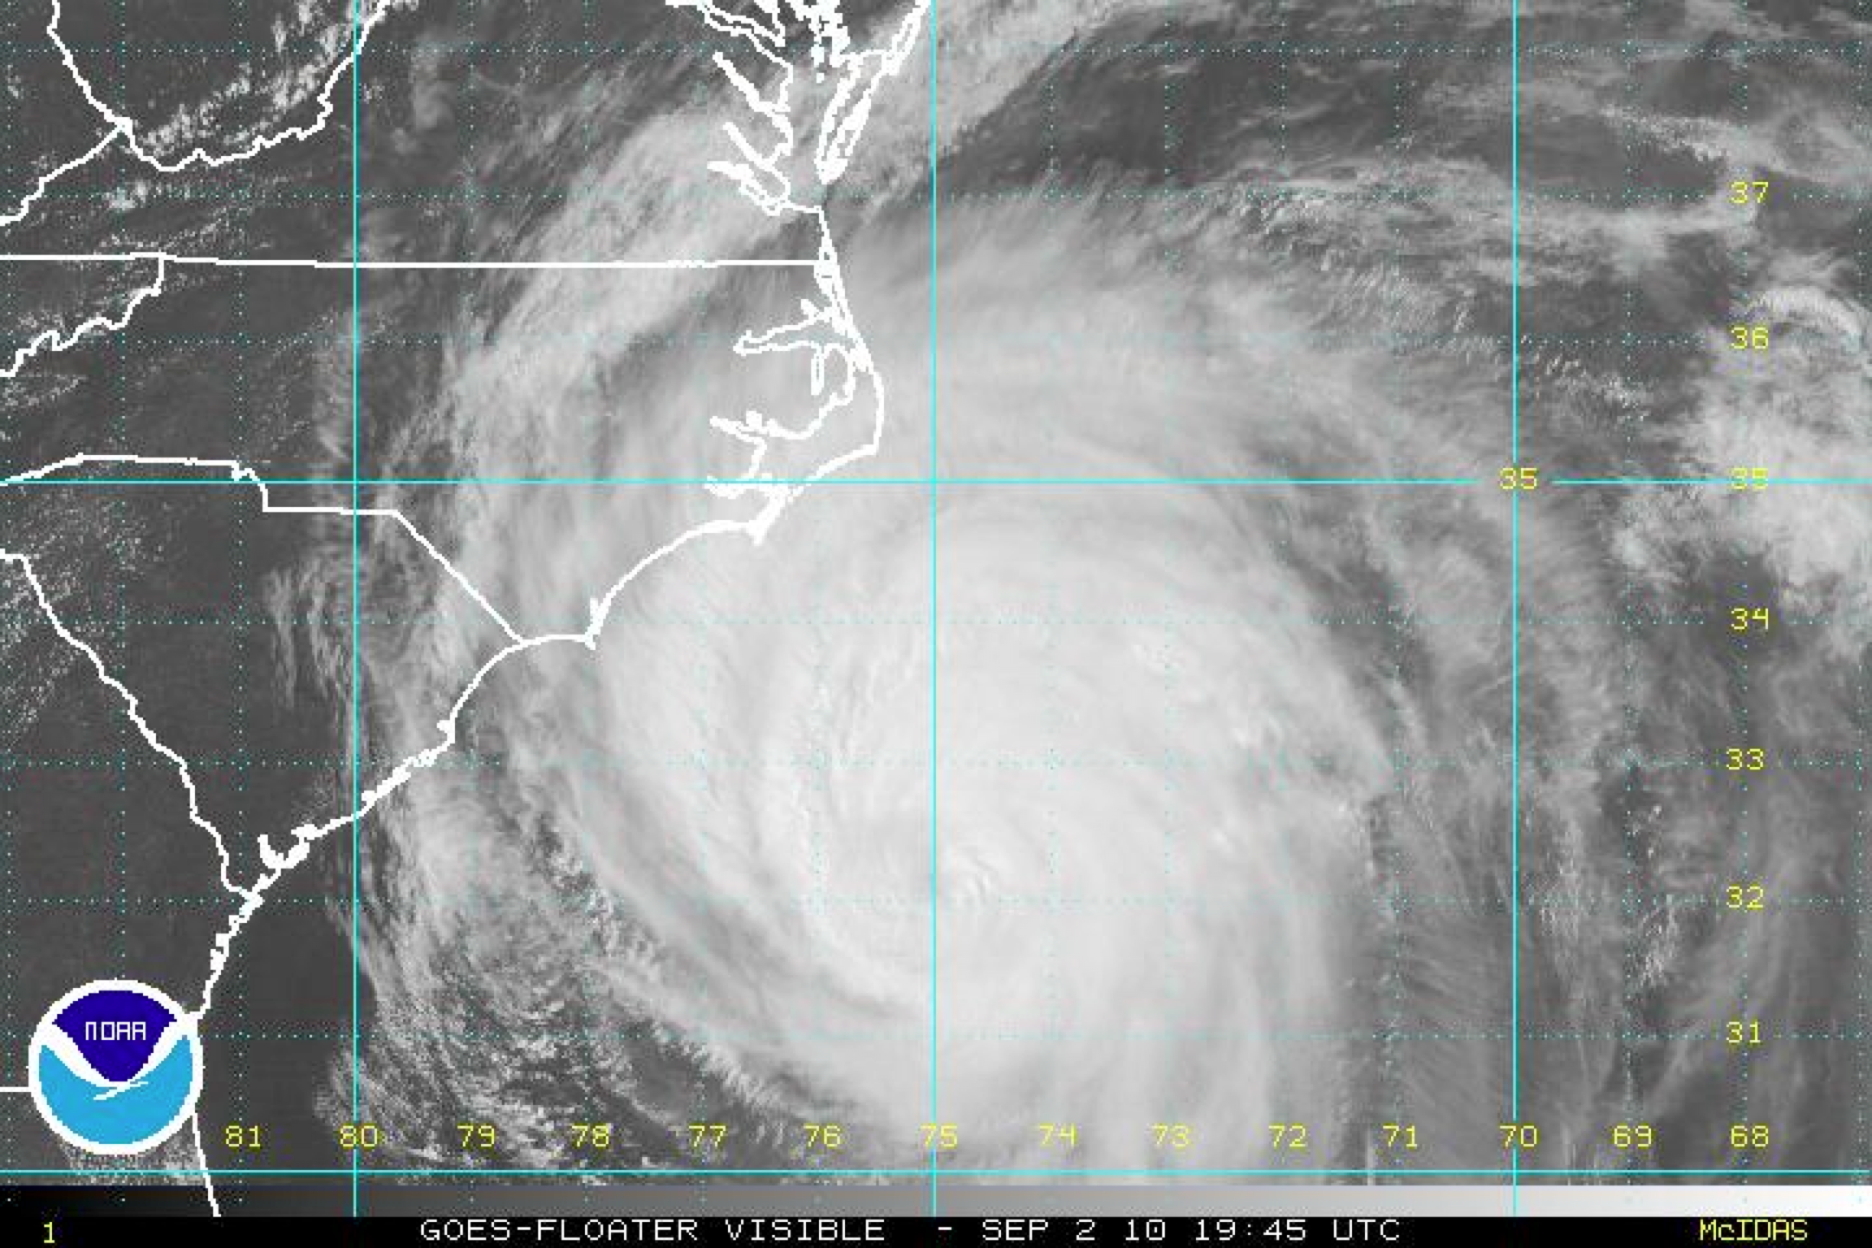
A sequence of infrared images also supports the deteriorating appearance of the storm (Fig. 6). At 1945 UTC Sept. 2, cold cloud tops remain fairly symmetrically distributed around the storm, with an area of cloud tops < -80°C apparent in the western eyewall.
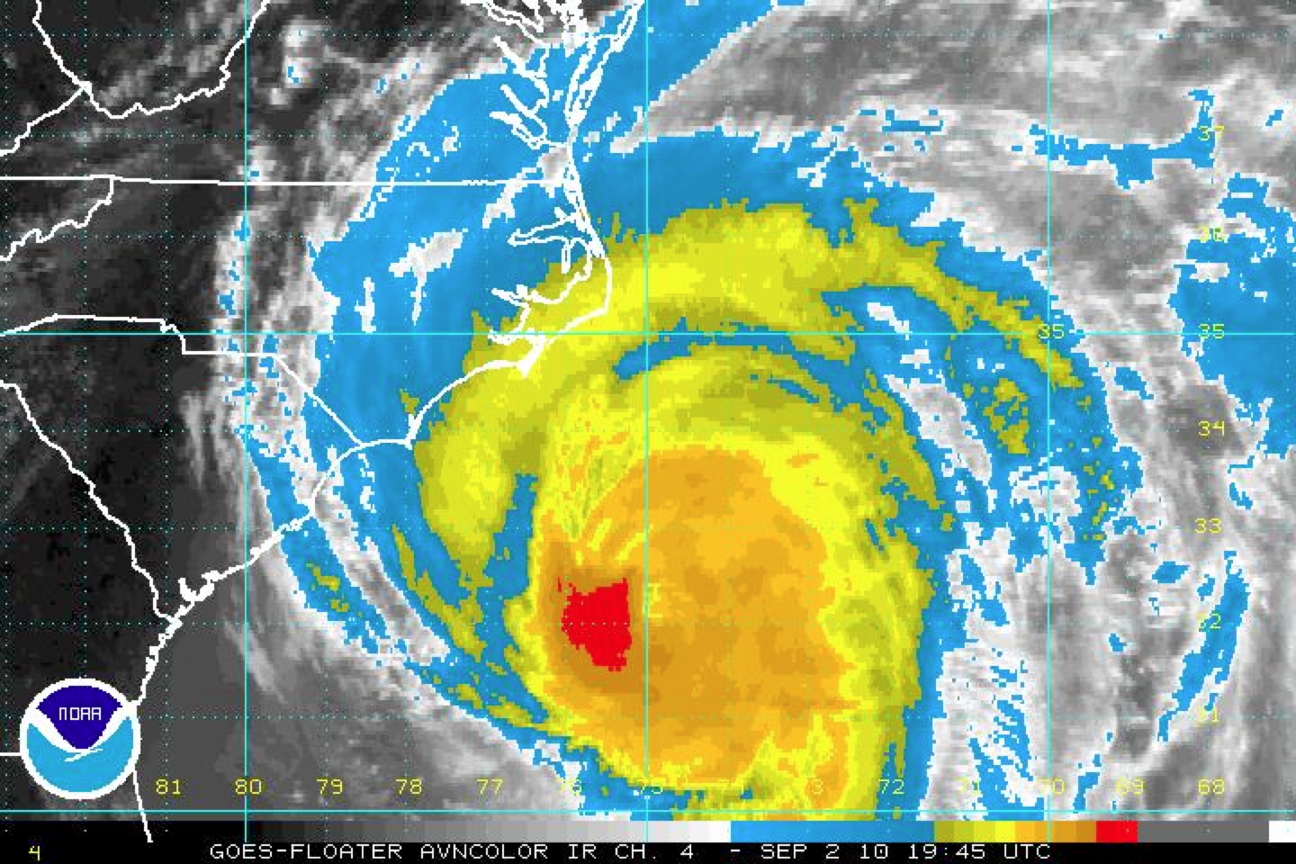 (a) |
 (b) |
| Figure 6. GOES enhanced infrared image valid (a) 1945 UTC September 2, (b) 0045 UTC September 3. | |
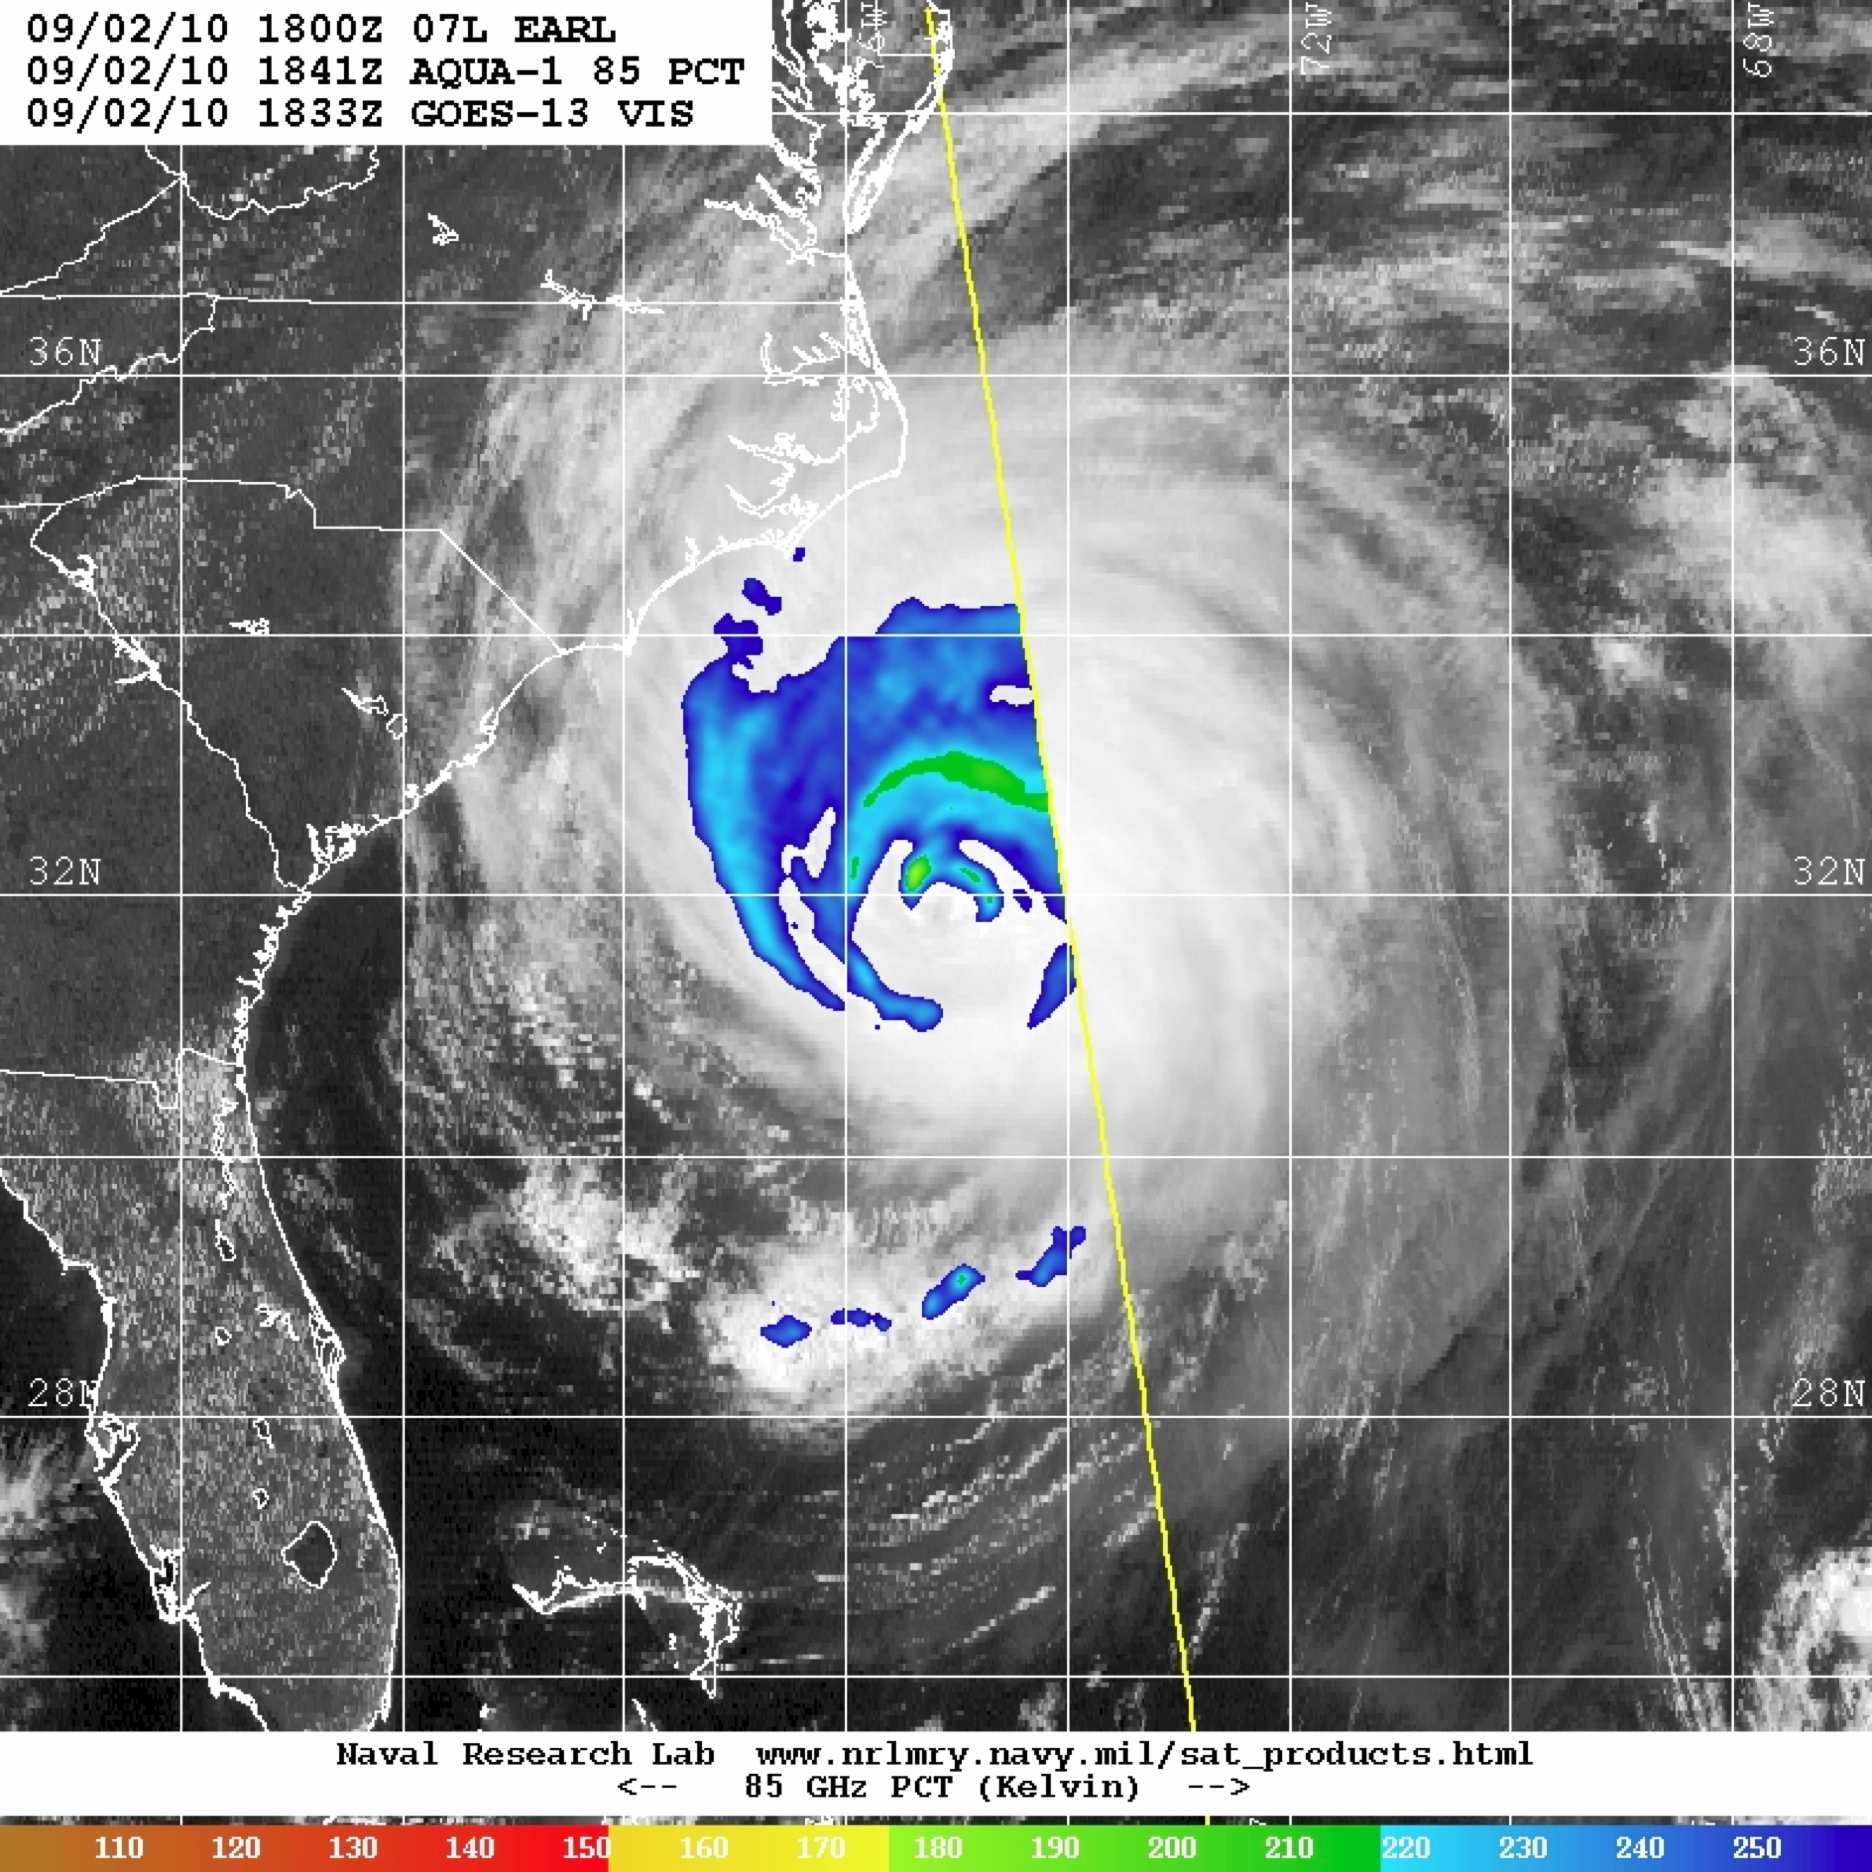
By 0045 UTC Sept. 3, the coldest cloud tops have warmed, and the cloud tops are asymmetrically distributed around the storm. An 85 GHz microwave image at 1841 UTC Sept. 2 (Fig. 7) shows this asymmetric distribution of convection as well.
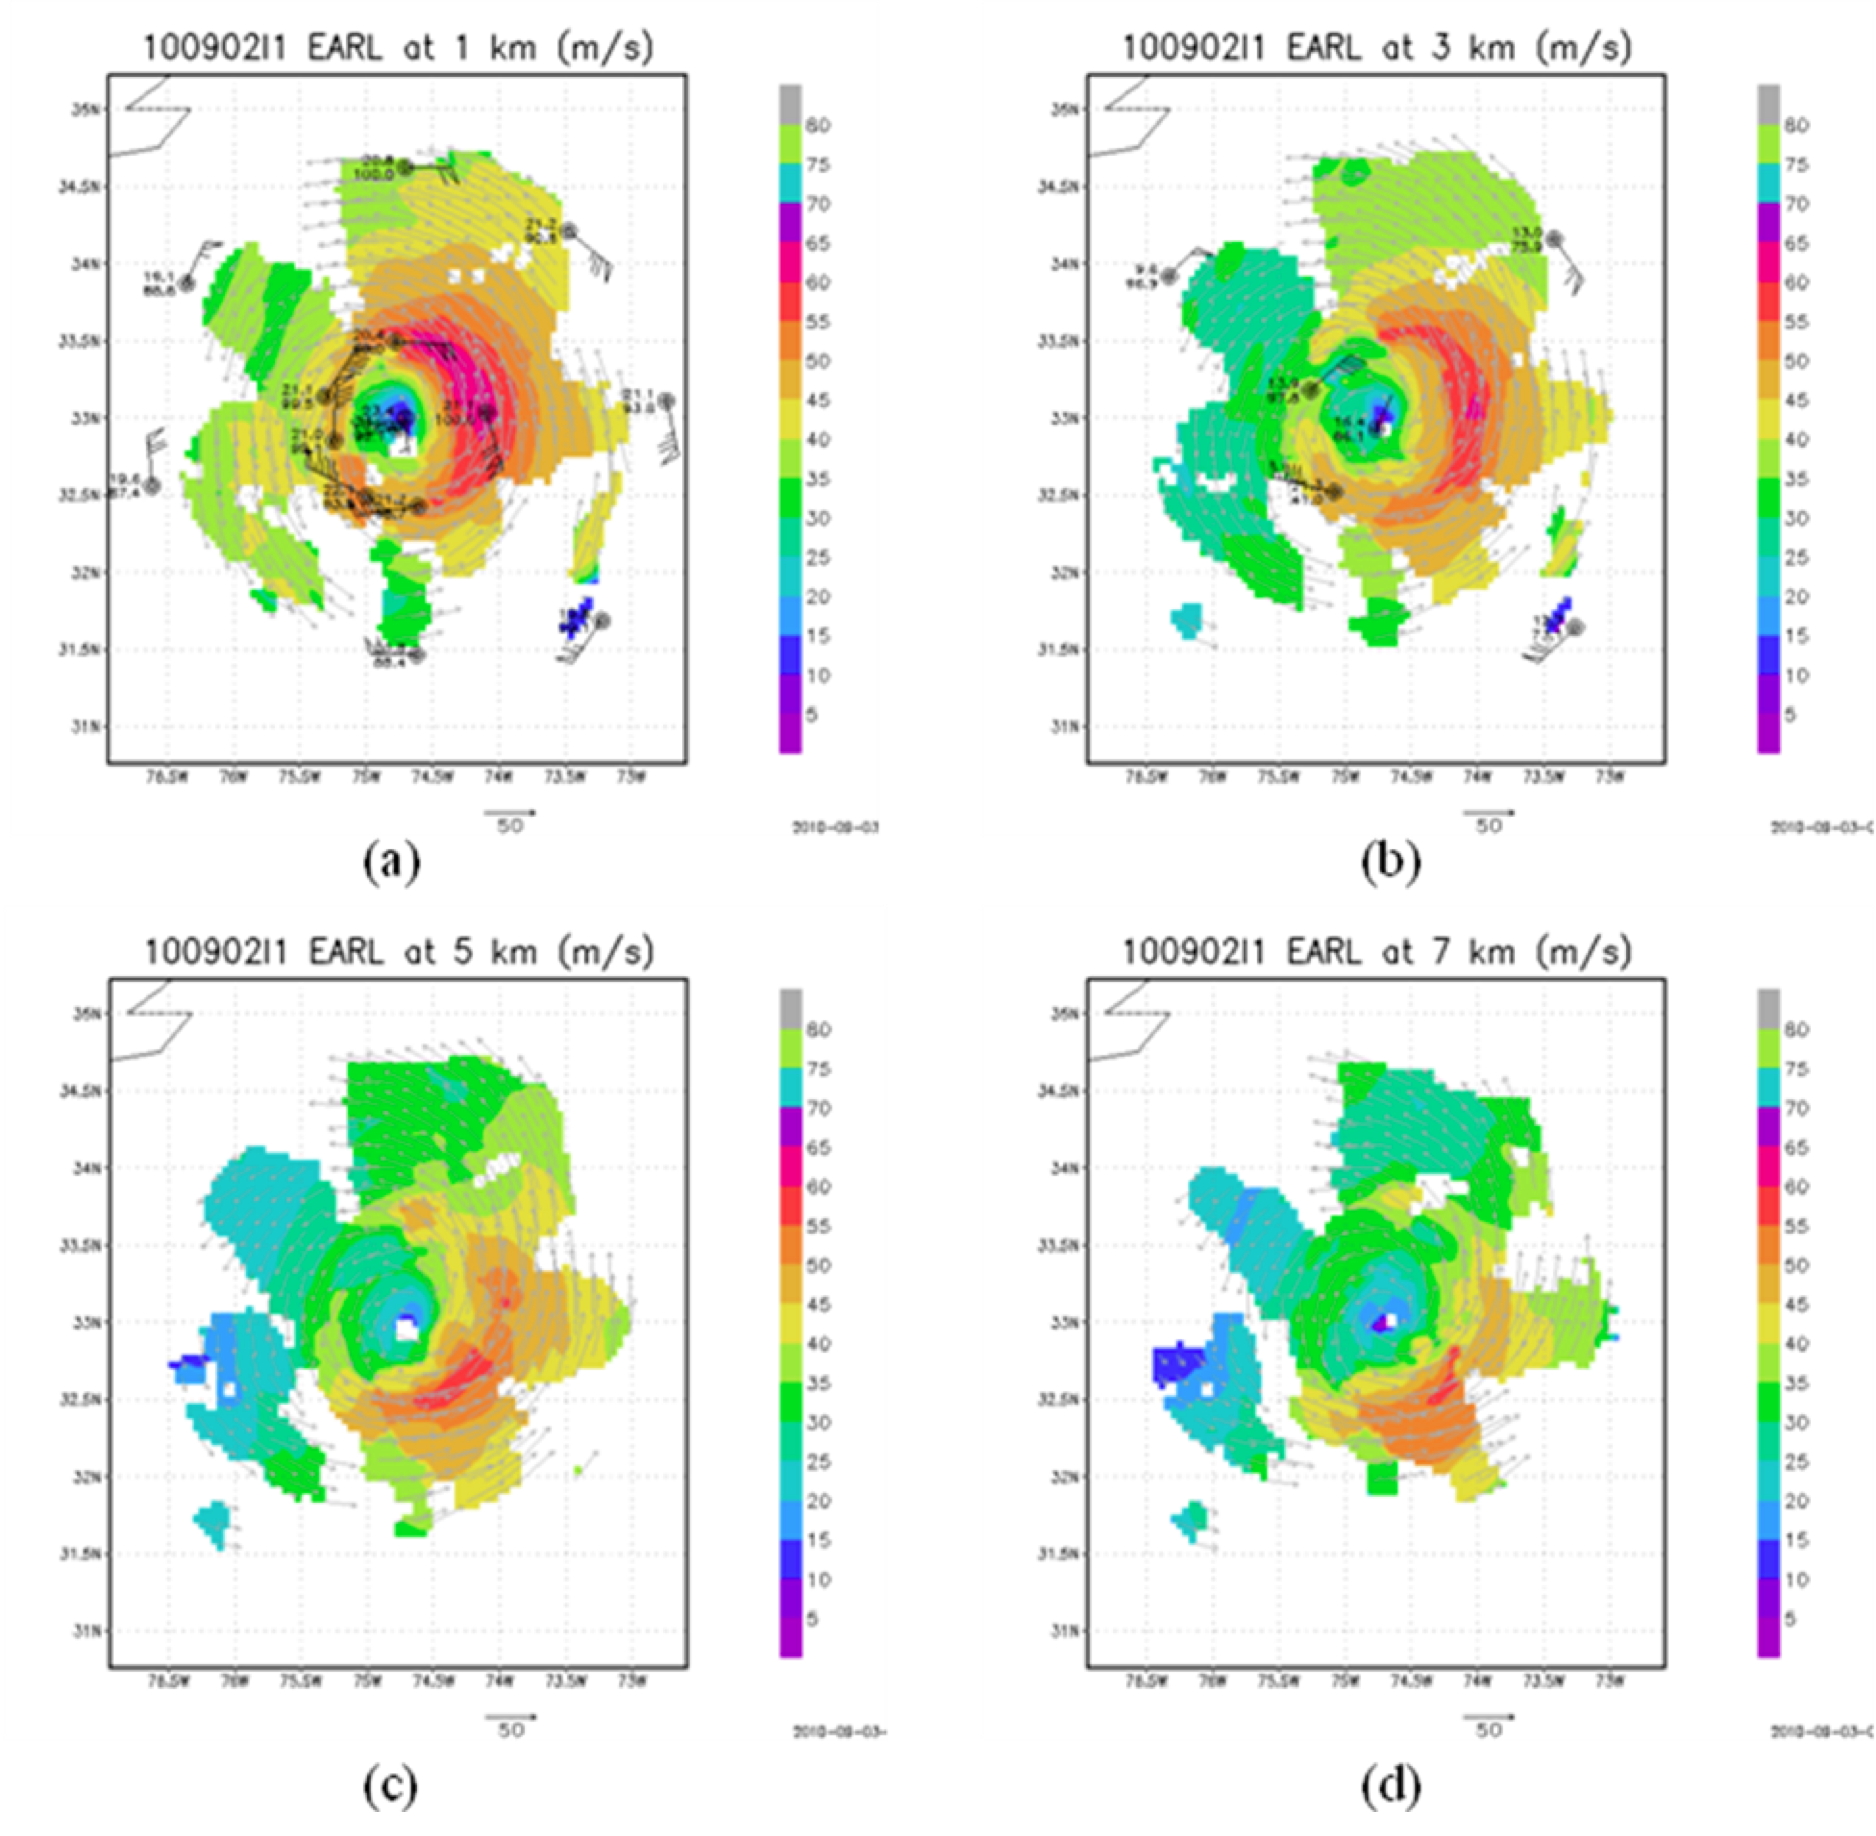
Takeoff was at 2006 UTC. The pattern was generally flown as planned. The wind field was highly asymmetric, with the SFMR showing the strong surface winds in the SW eyewall of 85 kt and the strongest flight-level winds in the E eyewall at 115 kt. These wind patterns are generally consistent with analyses of Doppler data at 1, 3, 5, and 7 km (Fig. 8), except for the maximum at 1 km on the east side. The eye was large during the flight, with a diameter > 60 nm, as the remnants of the inner eyewall collapsed. There was a broad shield of primarily stratiform precipitation on the north side of the storm.
Mission Evaluation :
The mission did accomplish the objectives quite well. Doppler data was collected in a weakening hurricane that was possibly beginning extratropical transition. The response of a mature hurricane to increasing vertical shear was also well-sampled, and it can be combined with the P-3 missions prior to and afterward to depict the evolution of the hurricane in an increasingly unfavorable environment.
Problems :
There were no problems with this flight. All sondes worked, and the radar worked well. A total of 19 GPS sondes were dropped, and 4 radar analyses were transmitted.
Rob Rogers
Sept. 10, 2010
NetCDF | 1 second data | |
 Flight track |
 Temperature and Moisture |
 Wind and Atlitude |
 Flight track |
Page last updated February 11, 2011
Return to Mission page.