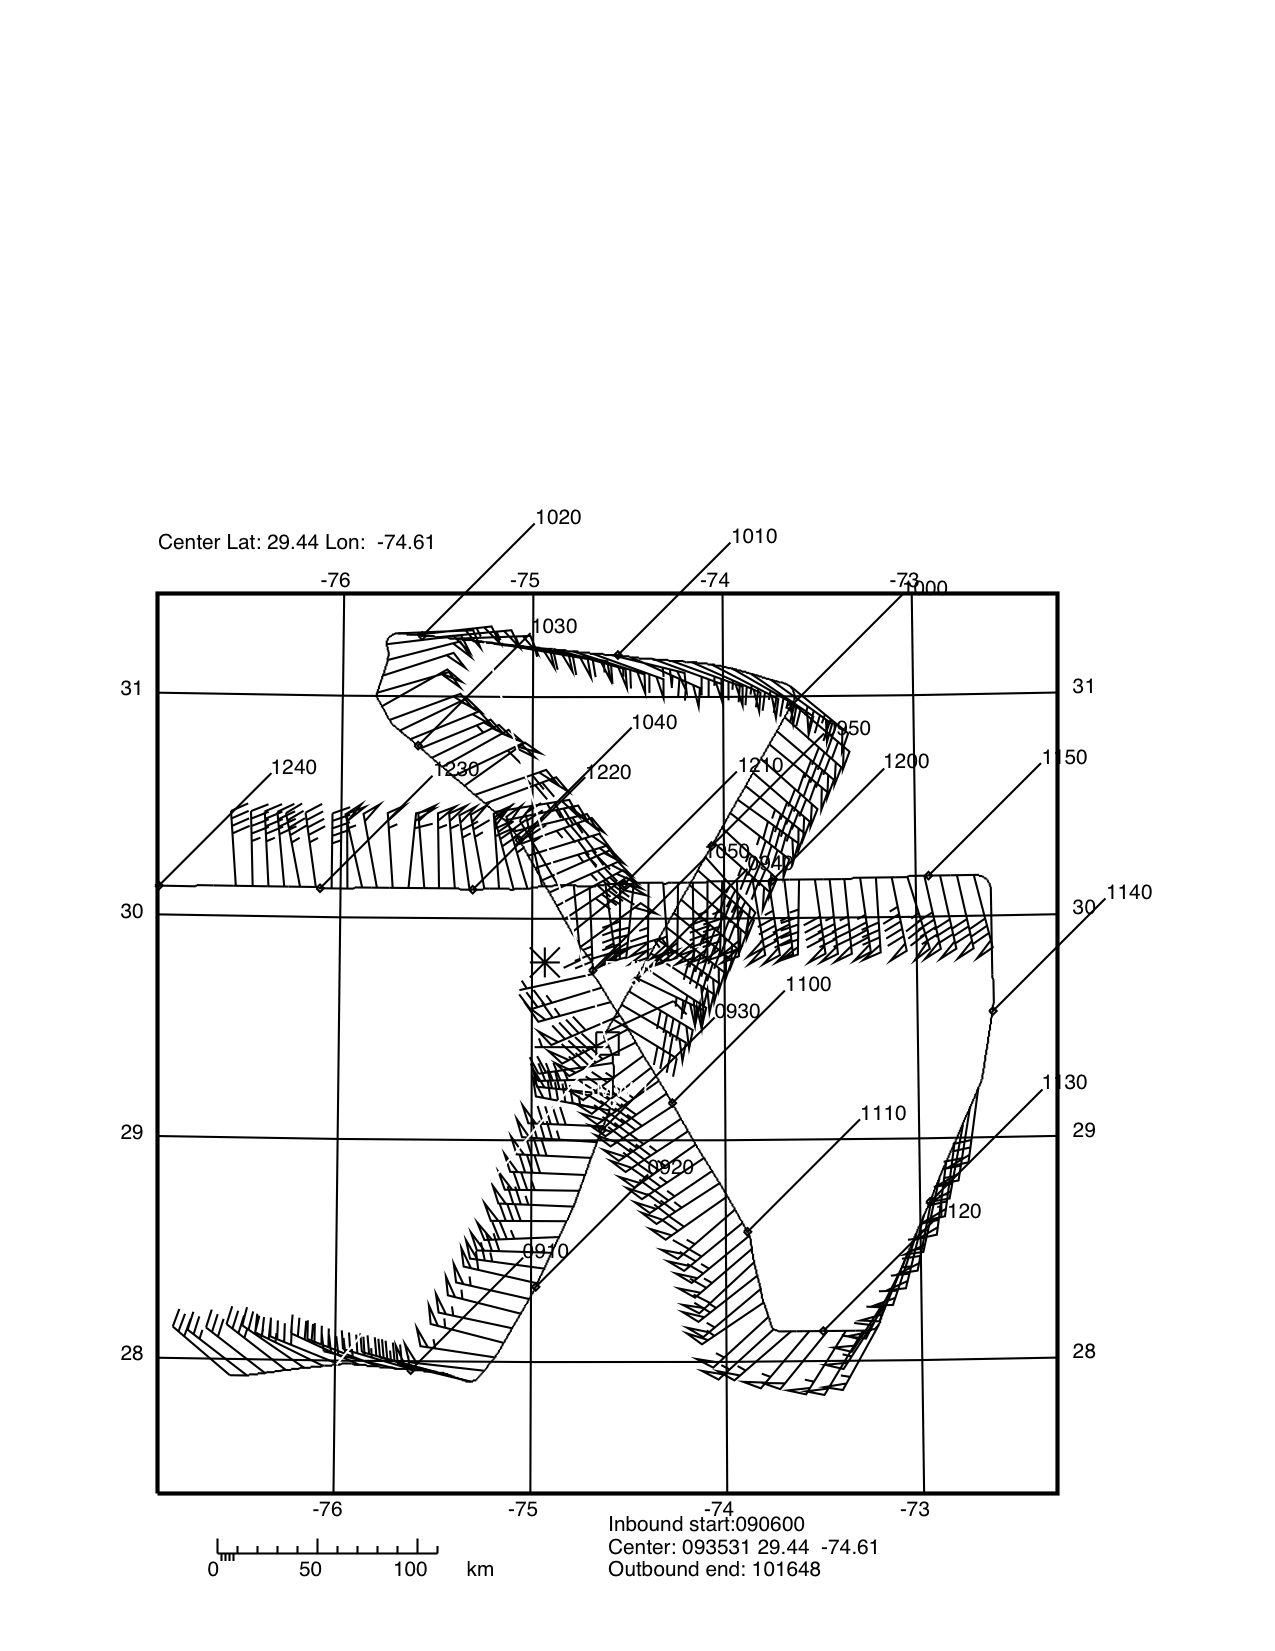
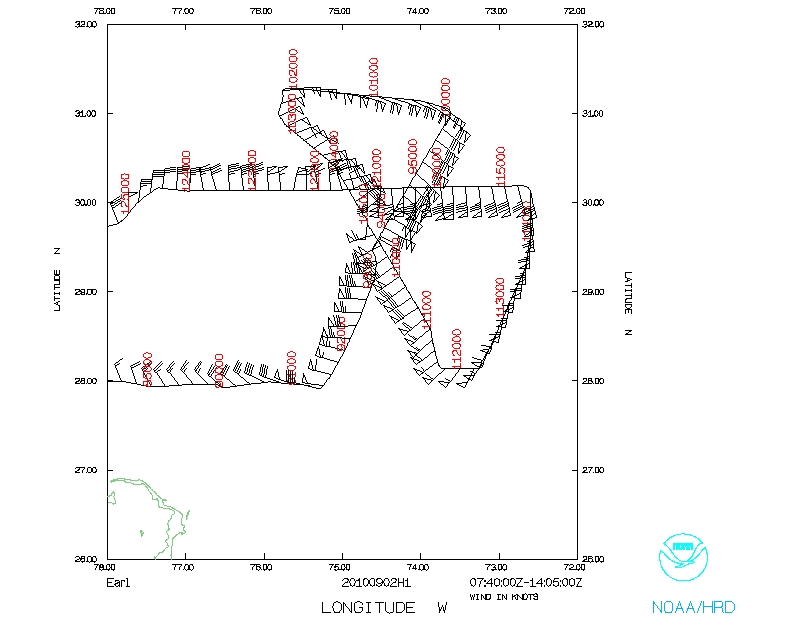
Figure 1. Proposed flight plan
| Aircraft Commander | Carl Newman |
| Co-pilot | Cathy Martin |
| Co-pilot | Mark Sweeney |
| Co-pilot | Brad Kearse |
| Flight Engineer | Joe Klippel |
| Flight Engineer | Paul Darby |
| Navigator | Devin Brakob |
| Flight Director | Ian Sears |
| Flight Director | Barry Damiano |
| Data Technician | Joe Bosko |
| Data Technician | Terry Lynch |
| Electronics Technician | James Warnecke |
| Electronics Technician | C Lynch |
| Engineer | Steve Paul |
| Lead Scientist | John Gamache |
| Radar Scientist | Paul Reasor |
| Dropsonde Scientist | Eric Uhlhorn |
| Guest Scientist | Fuqing Zhang (PSU) |
| Guest | Asha Tribble (NOAA HQ) |
| Guest | Richard Reed (White House) |
Mission Plan :
Continued monitoring of Earl structure and intensity change. The plan was to fly a 105 nm butterfly pattern, taking off and landing at MacDill AFB. Flight penetration legs were to be from SSW-NNE, NNW-SSE, and E-W. Drops were to be done at all 6 105-nm-radius corners of the pattern, and at the radius of maximum winds during the penetrations. An eye sounding was also to be taken during the second of three passes through the eye. This flight was the first of two P3 flights to drop AXBTs, to document the sea-surface-temperature structure following Earl, and the third out of 6 consecutive 12-hourly P3 flights. This flight was a part of IFEX, in this case a tail-Doppler-radar mission designed to document the structure and intensity change of Earl, and requested by the NWS Environmental Modeling Center, to augment the Doppler data sets on which to develop/refine/test HWRF Doppler data assimilation.
Mission Summary :
| Take off | Landing
| MacDill AFB FL | 02/07:52 UTC
| MacDill AFB FL | 02/14:01 UTC
| | ||
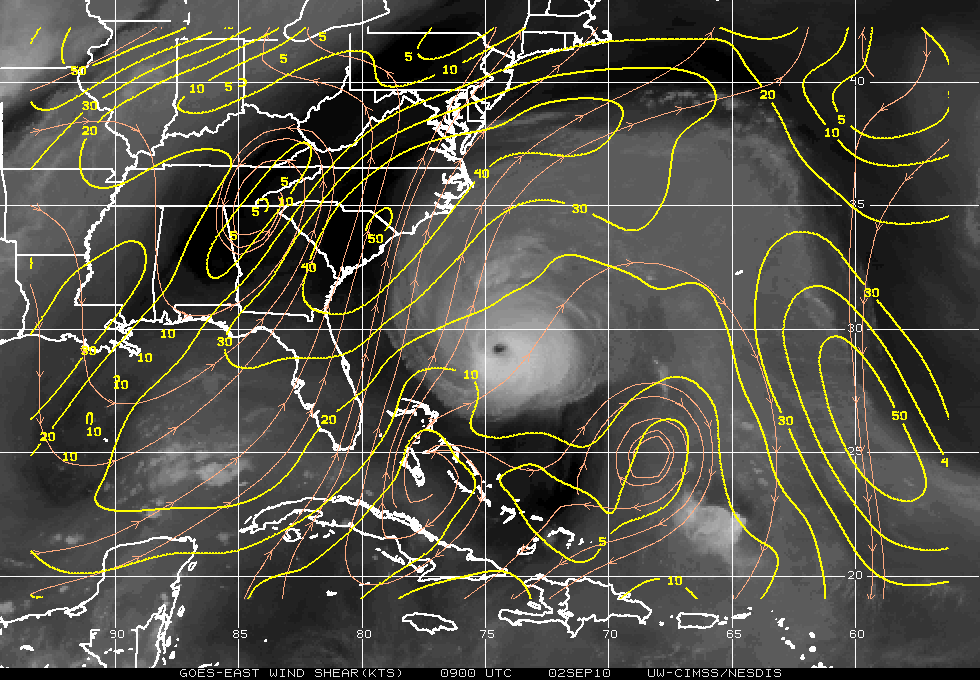
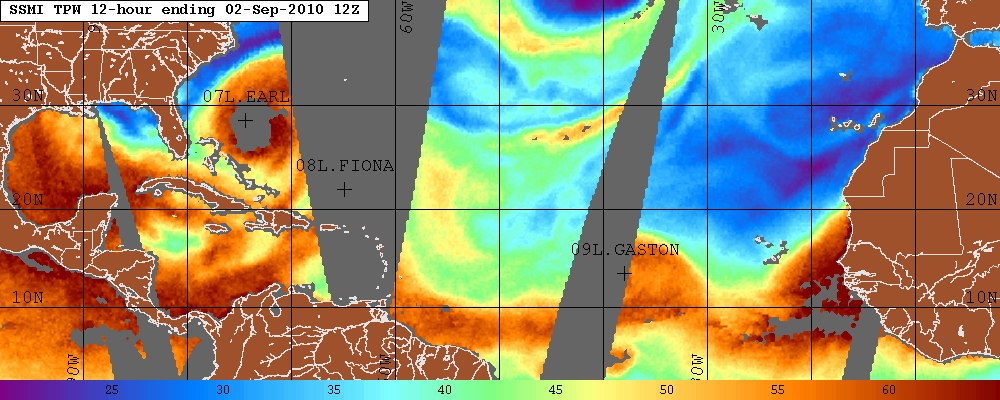
Officially Earl was a 125-kt storm at the beginning of the flight, and a 120-kt storm at the end of the flight. CIMMS imagery (Fig. 3) showed deep shear of approximately 15 kts from the SW, and the NRL satellite TPW imagery (Fig. 4) showed the area immediately around Earl was very moist. Official storm motion was estimated to be 16 kt at 330 near the beginning of the flight and 16 kt toward 355 near the end of the flight.
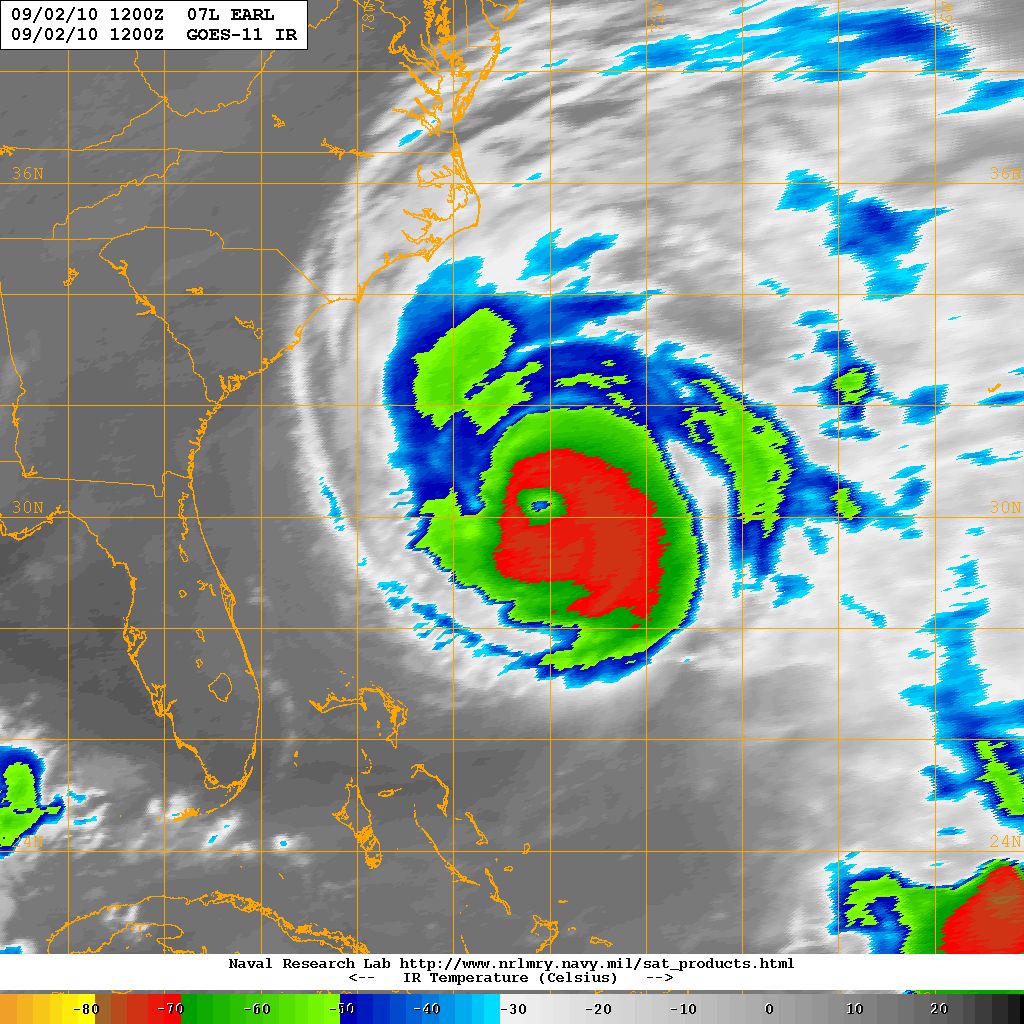
a |
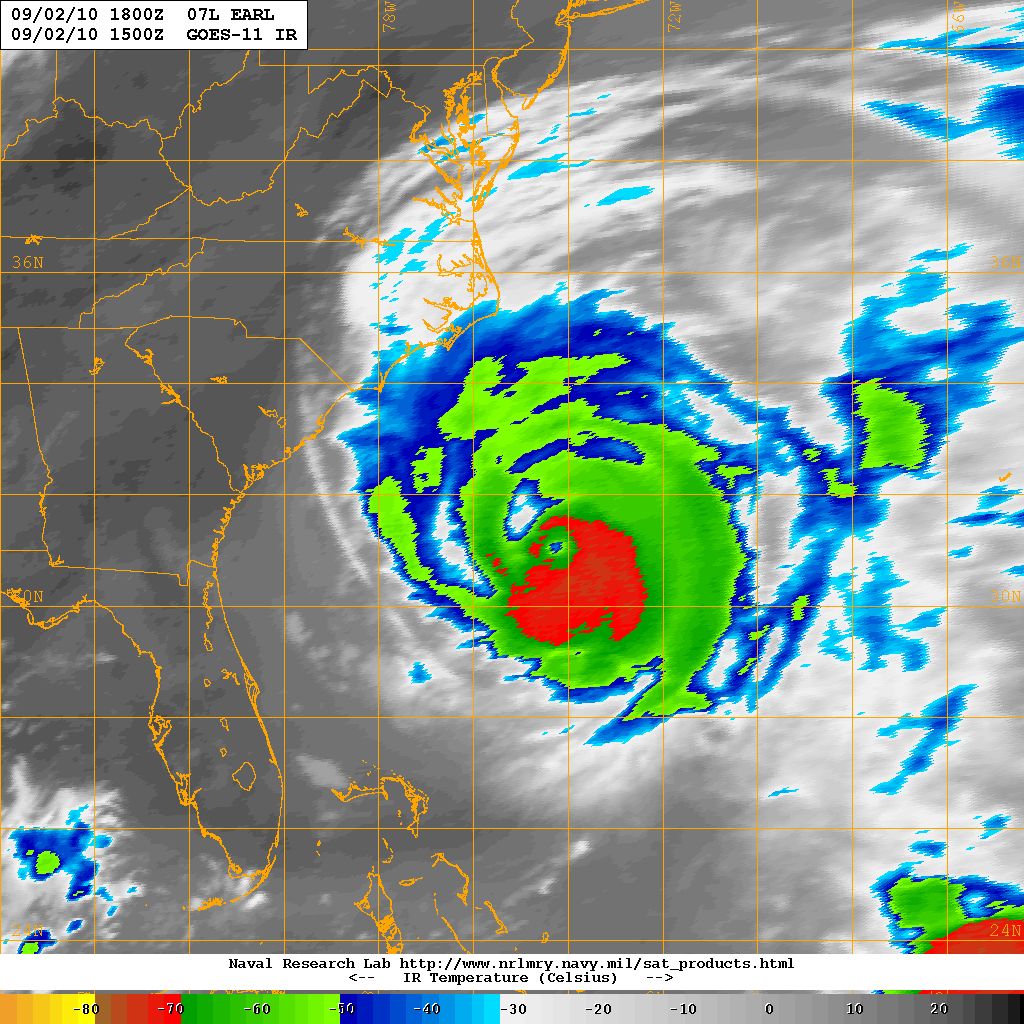
b |
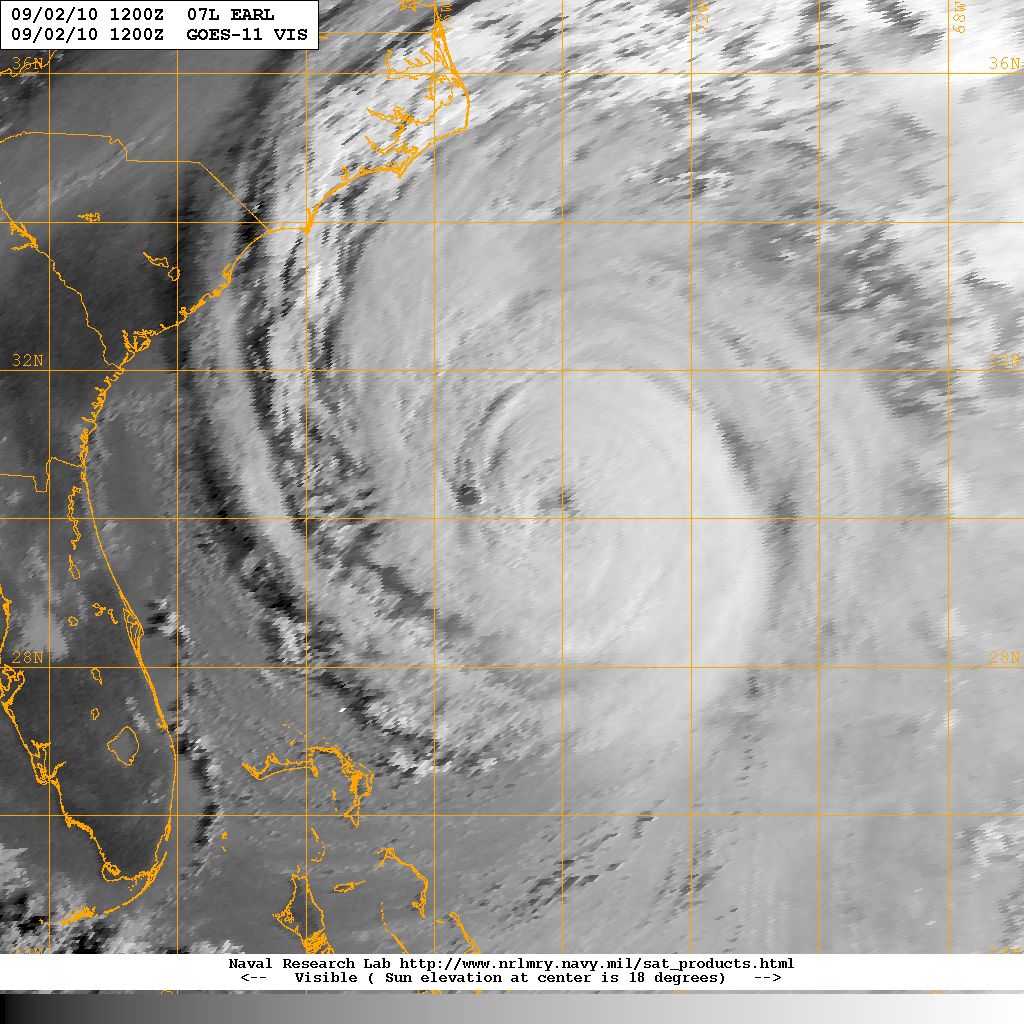
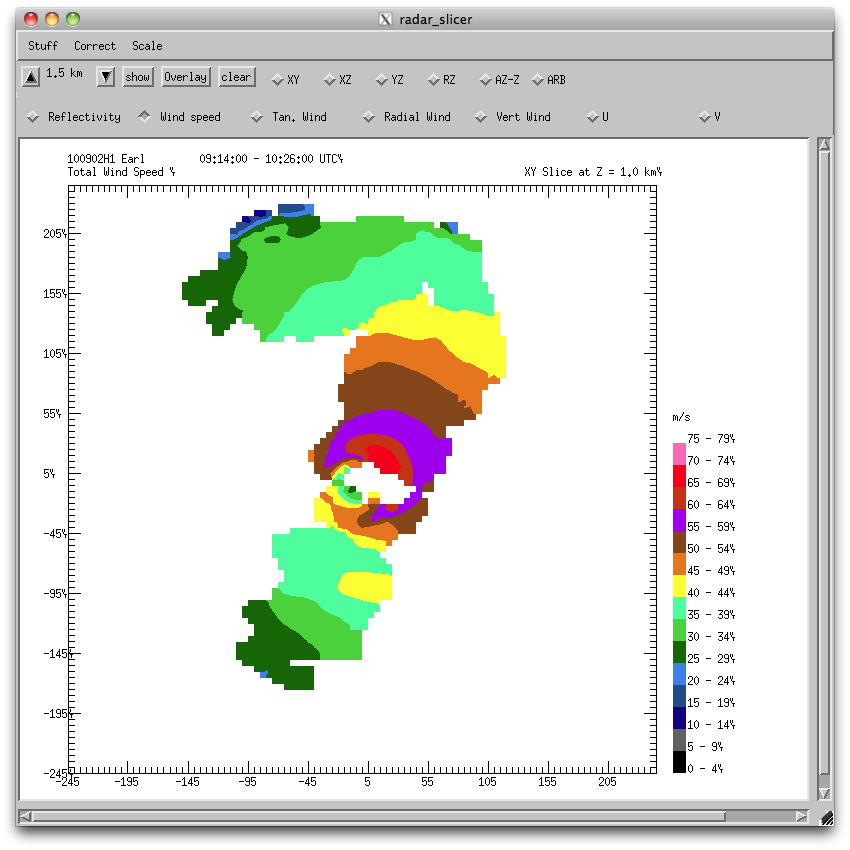
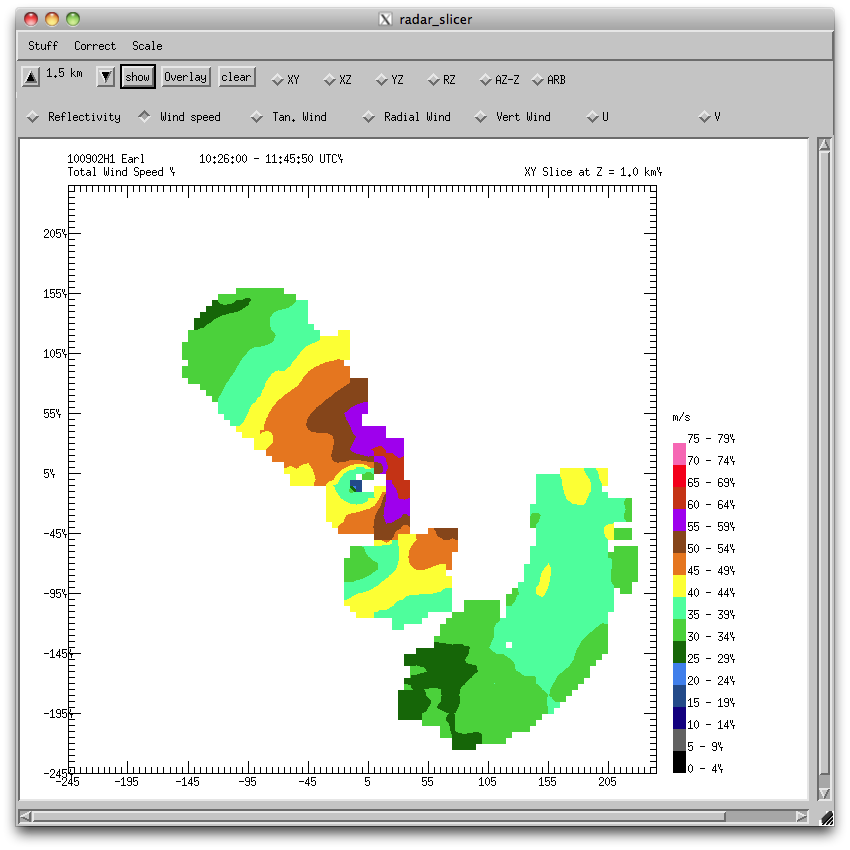
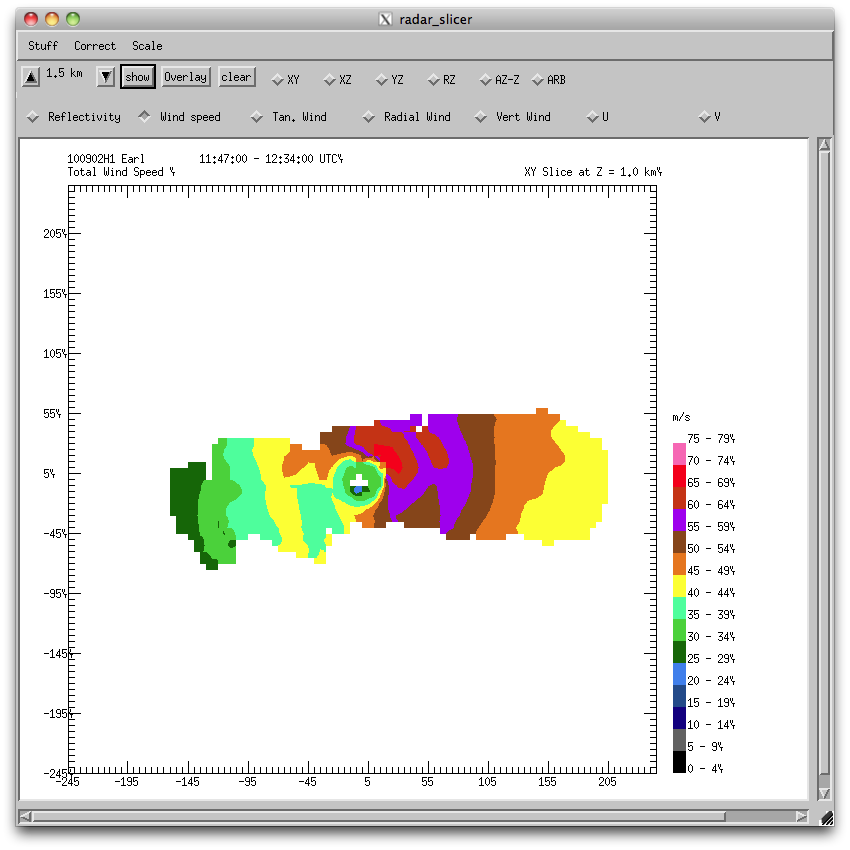
NOAA 42 took off at 0752 UTC from MacDill AFB for what was to be a 6-h flight, 3.5 h of which would be in pattern. They arrived at the IP at 0914 UTC, and remained in pattern until 1239 UTC. The first pass was from the nominal bearing of 210 from the storm center to a nominal bearing of 30. On the SSW side the pilots remarked, from outside the radius of maximum winds, that they could see all the way into the eye, suggesting no cloud on the SSW side. Flight-level dewpoint depression was 6-8 degrees near the radius of maximum wind. Nevertheless maximum FL winds on the SSW side were 100 kt, and the maximum SFMR wind was 80 kt. On the NNE side, maximum FL winds were 130 kt, and the maximum SFMR surface wind was 107 kt. On the N side of the storm during the E-W downwind leg, was a very large area of deep (> 12 km echo top) stratiform reflectivity, with plenty of scatterers. The second pass was from bearing 330 from storm center to bearing 150. The FL winds on the inbound leg were 93 kt, while the max shown by the SFMR was 100 kt.. On the SSE side the FL winds were 97 kt, while the SFMR showed 82 kt. The last pass was directly from east to west. The eastern half of this flight leg showed a maximum FL wind of 123 kt, and a maximum SFMR surface wind speed of 100 kt. To the west of the center the maximum FL wind was 92 kt, and the maximum SFMR wind was 77 kt. Thus maximum FL wind measured by NOAA 42 during this mission in Earl was about 130 kt, while the maximum SFMR wind was about 107 kt.
 a |
b |
c |
a |
b |
c |
Sondes launched at 105 nm radius from all 6 points of the butterfly showed essentially saturation from flight level to the surface, in spite of the dewpoint depression farther inward on the 210-bearing radial leg. The sounding along this same leg near the radius of maximum winds showed saturation near the surface and nearly 10 degrees of dewpoint depression near flight level. Sea surface temperatures measured by the AXBTs all appeared to be between 27.0° and 28.5°Celsius, with the maximum 28°+ temperatures being on the W and SSW sides.
This was another very successful flight to capture the structure and intensity of Hurricane Earl.
Problems :
Radar worked well during the storm penetrations, allowing a good 3D analysis. Sondes were also able to document the thermodynamic and wind environment over the lower troposphere at the 105-nm radius from storm center. Problems during this mission were very minor.
John Gamache
Sept. 20, 2010
serial | NetCDF | 1 second | |
 Flight track |
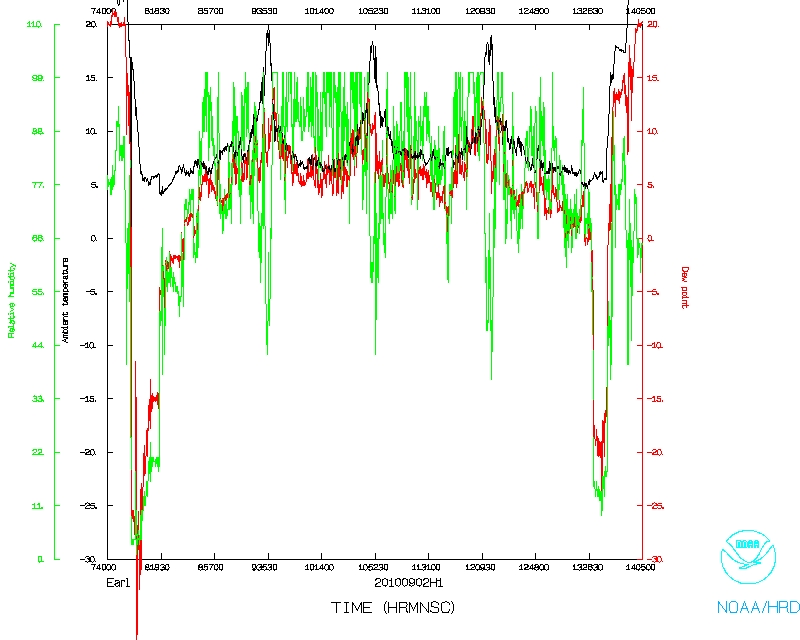 Temperature and Moisture |
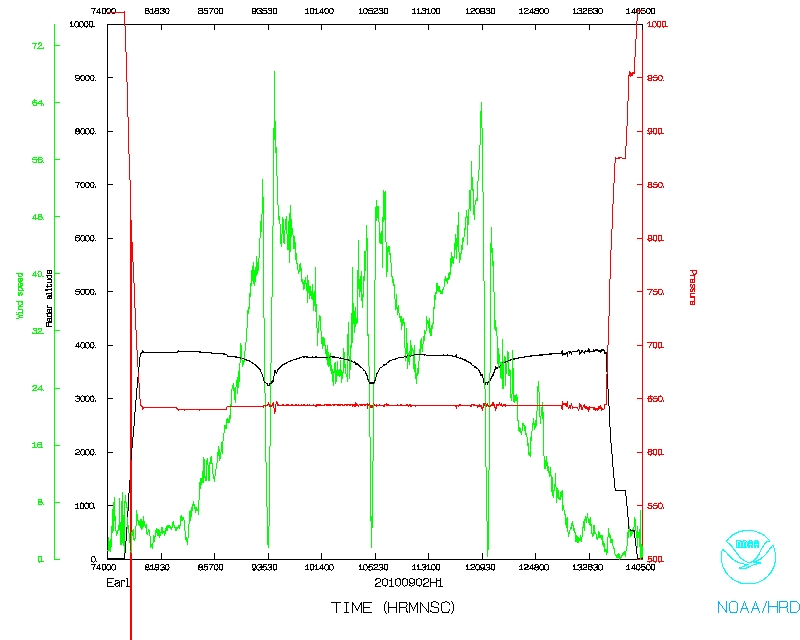 Wind and Atlitude |
Page last updated Sept. 21, 2010
Return to Mission page.