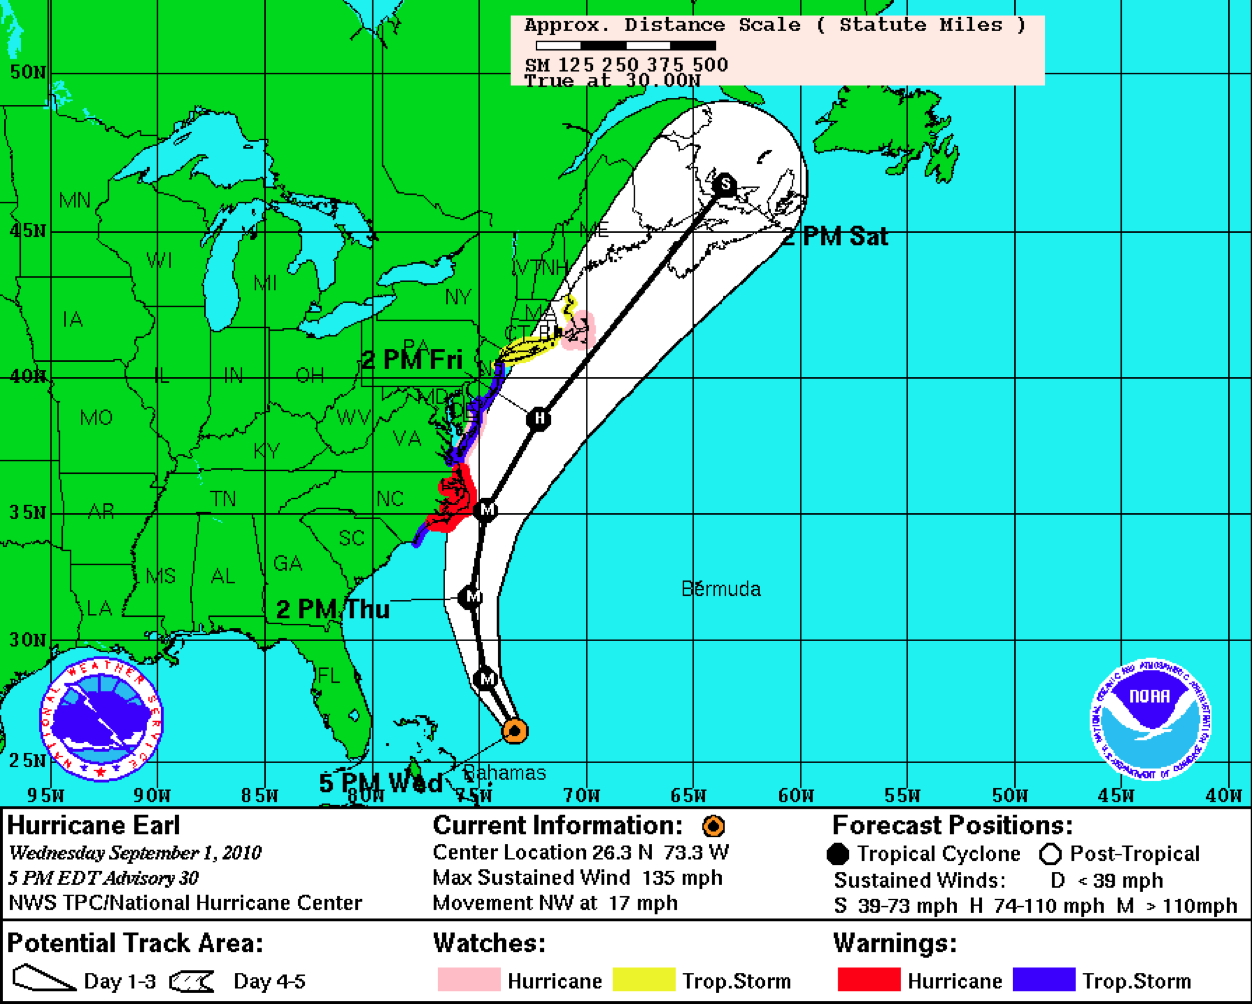
Figure 1. NHC 3-day track guidance for Hurricane Earl valid 21Z 01 September, 2010.
| Aircraft Commander |
| Co-pilot |
| Flight Engineer |
| Flight Engineer |
| Navigator |
| Flight Director |
| Flight Director |
| Data Technician |
| Engineer |
| Engineer |
| Electronics Technician |
| Dropsonde Operator |
| Lead Scientist | Joe Cione |
| Radar Scientist | Shirley Muriilo |
| Dropsonde Scientist | Paul Leighton |
| Field Program Director | Rob Rogers |
Mission Plan :
Soon after takeoff (1922Z) Hurricane Earl was still classified by NHC as category 3 (115kt) major hurricane. At 21Z 01 September 2010, Earl's center of circulation was located near 26.3°N 73.3°W, 400 nmi ENE of Miami.
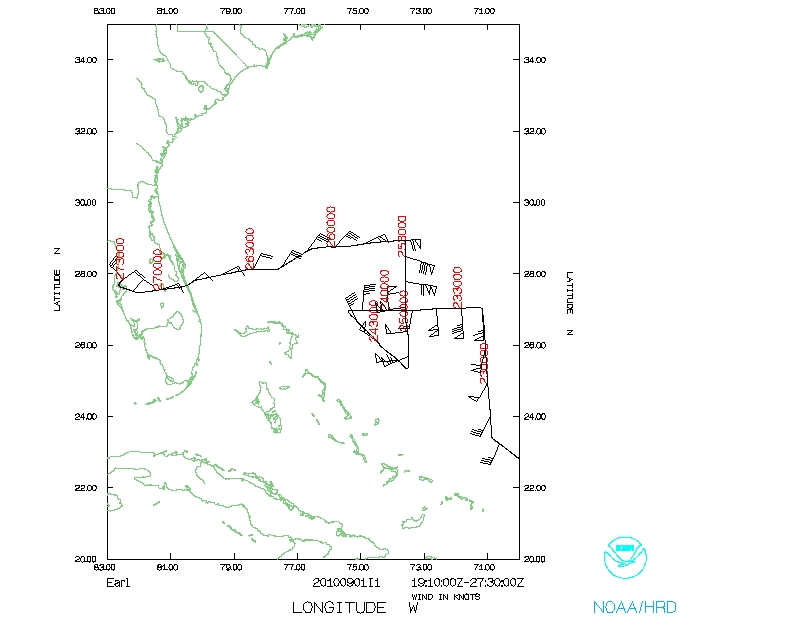
Since this was a combination science and Ferry flight from Barbados to Tampa FL, the pattern was limited to a 2-penetration, single figure 4 pattern with 105nmi legs. The flight track geometry is given below (Figure 2).
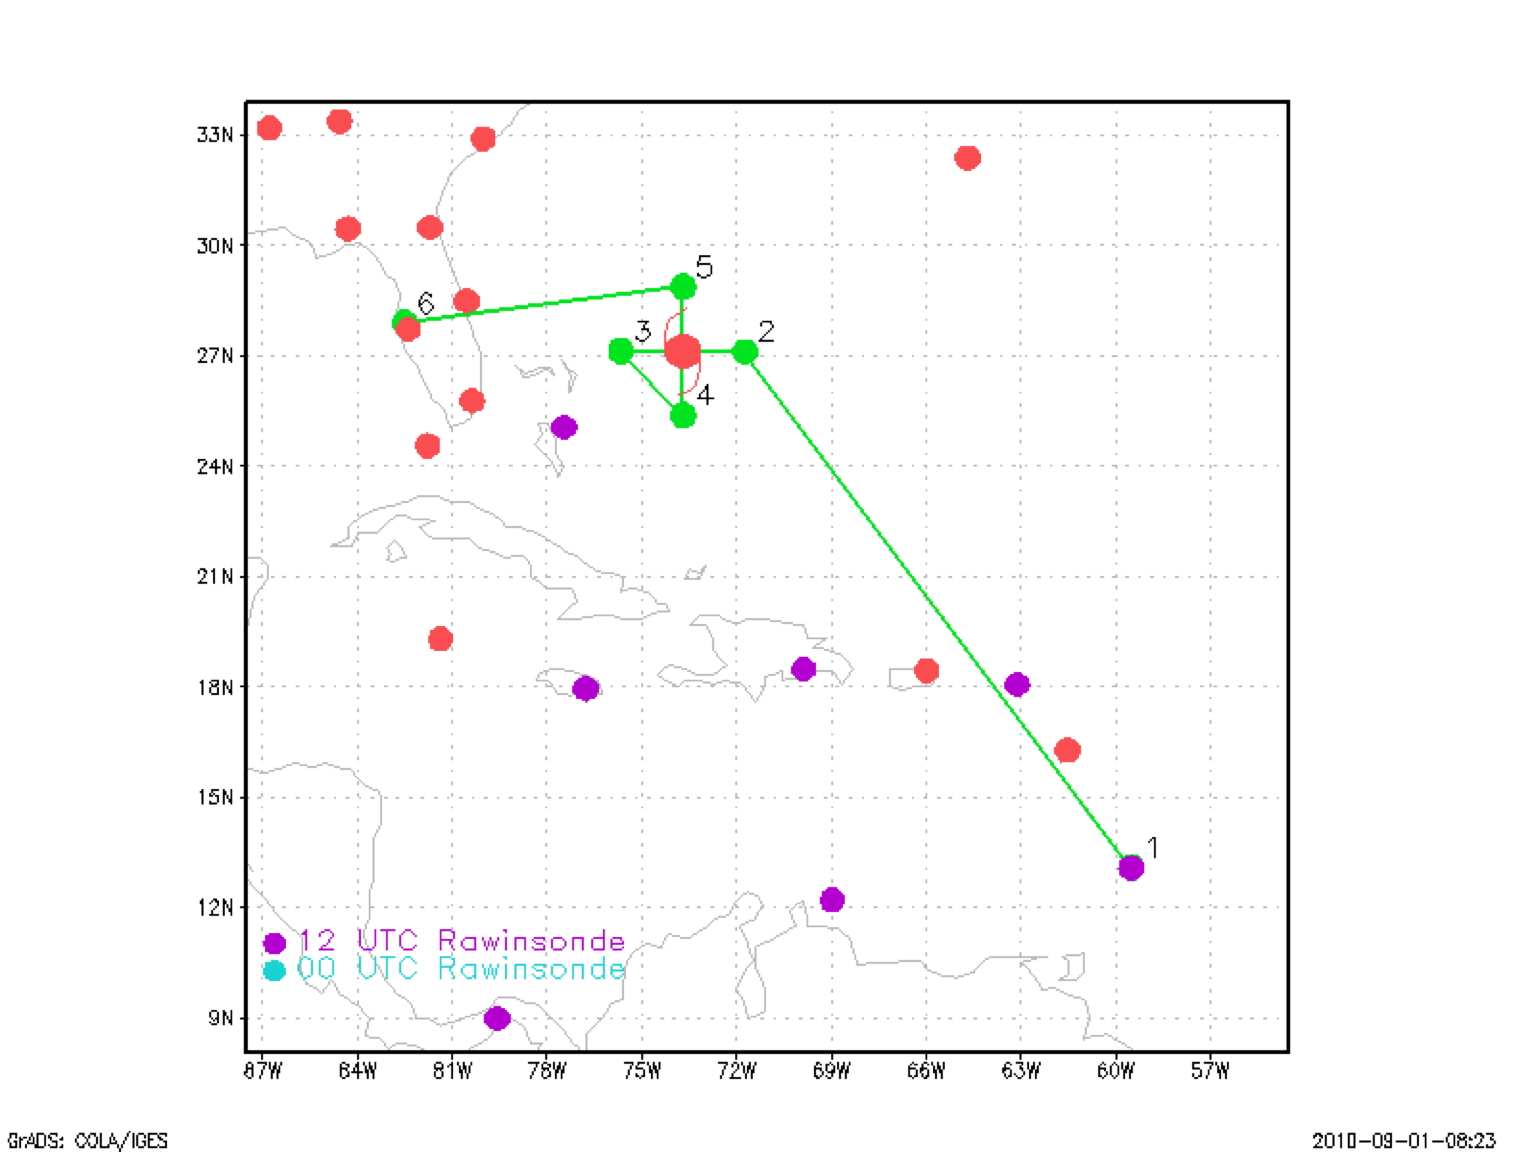
In order to meet mission requirements for both experiments conducted on this flight, 12Kft (radar) altitude was maintained for the TDR experiment from point 2 to point 3 (shown in Figure 3). Afterward, N43 descended to 7kft (radar) and finished the remaining pattern at this altitude through point 5 so as to satisfy Ocean Winds science objectives. Also, in order to minimize interference between the TDR and Ocean Winds onboard equipment, Doppler radar was run in 'wedge mode' when the aircraft was at 7kft altitude. During the TDR mission Doppler radar was run in "FAST" mode.
Mission Summary :
| Take off | Landing
| Barbados | 01/20:00 UTC
| MacDill AFB FL | 02/03:45 UTC
| | ||
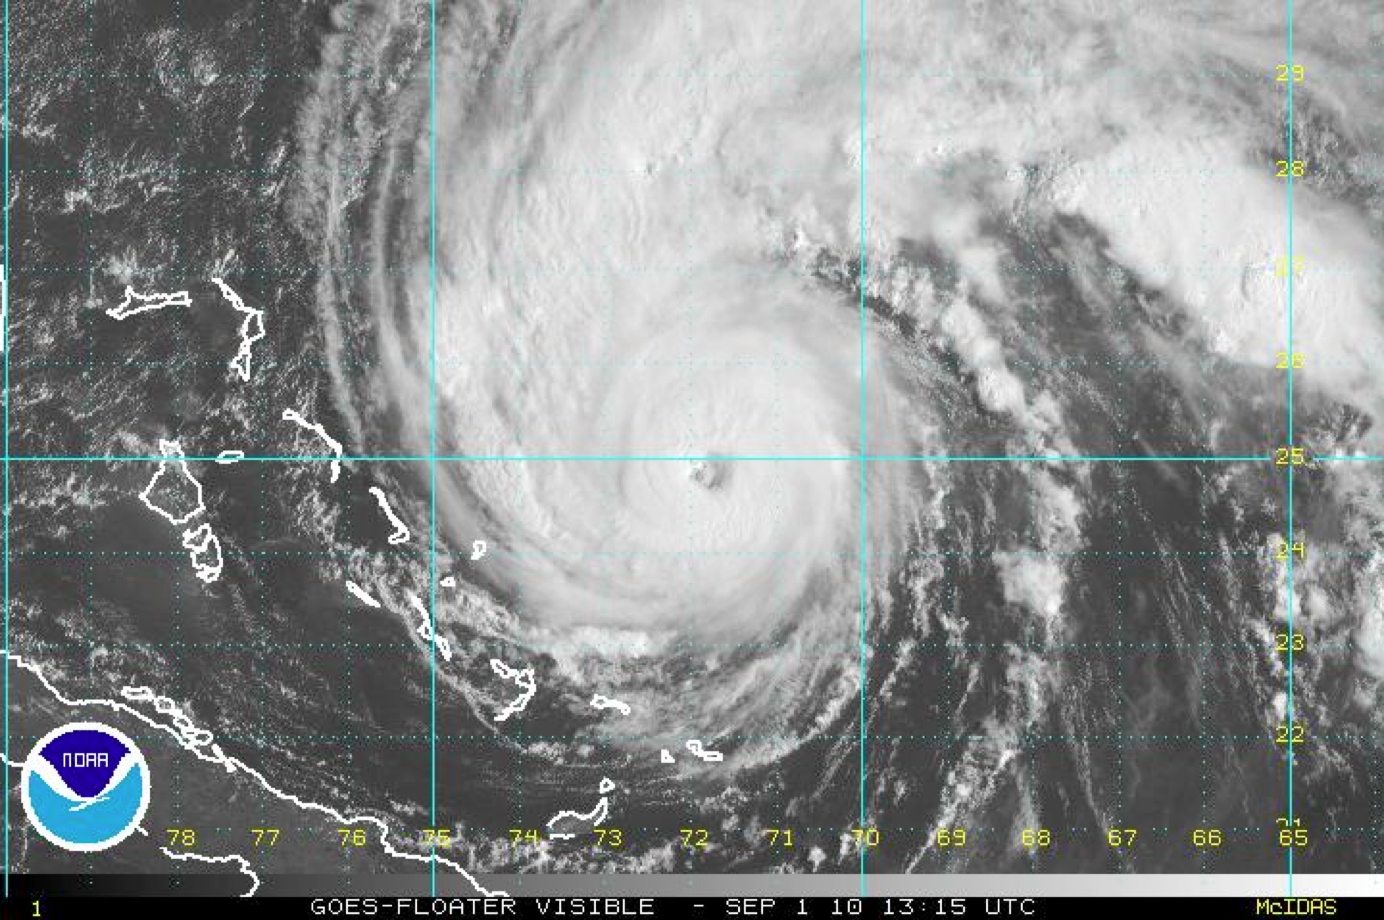
Below, a visible image of Major Hurricane Earl is illustrated (Figure 3).
Ferry altitude for this flight was 13.5kft. As Figure 2 illustrates, The IP for NOAA 43 required a northwest heading in order to enter the storm from the east. The GPS drop plan for this flight was similar to earlier N43 Earl flight s. Sonde drop points were set at each 105nmi endpoint, then again within Earl's eyewall region. Once through the center of circulation, the drop sequence was then reversed (i.e. eyewall, endpoint). On the first and last legs through the system, eye/center fix sondes were also planned.
Once in the storm, it became clear relatively quickly that Earl's eyewall pattern (as depicted on lower fuselage C-band radar) was exhibiting the most symmetric structure N43 had observed to date for this storm. Once in LF range, there were no apparent gaps in the reflectivity pattern associated with the eyewall. On previous flights, portions of the eyewall (usually north and left regions) did exhibit convective-free regions. In addition, the eye resembled the closest thing to a stadium effect that the crew had seen (relative to previous N43 Earl flights). Towards the end of the flight, portions of the southern eyewall did begin to erode somewhat. Still, this was the 'best' the eye/eyewall had looked over the past 4 N43 missions with respect to overall symmetric structure and insulation from dry air.
During this flight Earl's approximate forward speed and heading were 11kts and 330 degrees, respectively. MSLP, obtained from a GPS dropsonde, was ~932 mb for this mission, roughly the same value sampled during the N43 30 August flight (936mb). Peak SFMR surface winds found during this mission were located in the east eyewall and were approximately 105kts. During the 48h period between final N43's final 2 flights (30 August- 01 September), Hurricane Earl had roughly maintained its intensity. This final mission capped off a nice multi-mission, continuous run that first captured Earl as a tropical storm and finished up with back-to-back major hurricane missions. In addition, these missions (especially when combined with coordinated N49 and N42 flights) also fully documented at least one rapid intensity cycle. All-in-all a landmark series of flights to be sure.
Analyses of 1km, 5km and 10km Doppler-derived wind speed and direction for this flight are given below (Figure 4a-c).
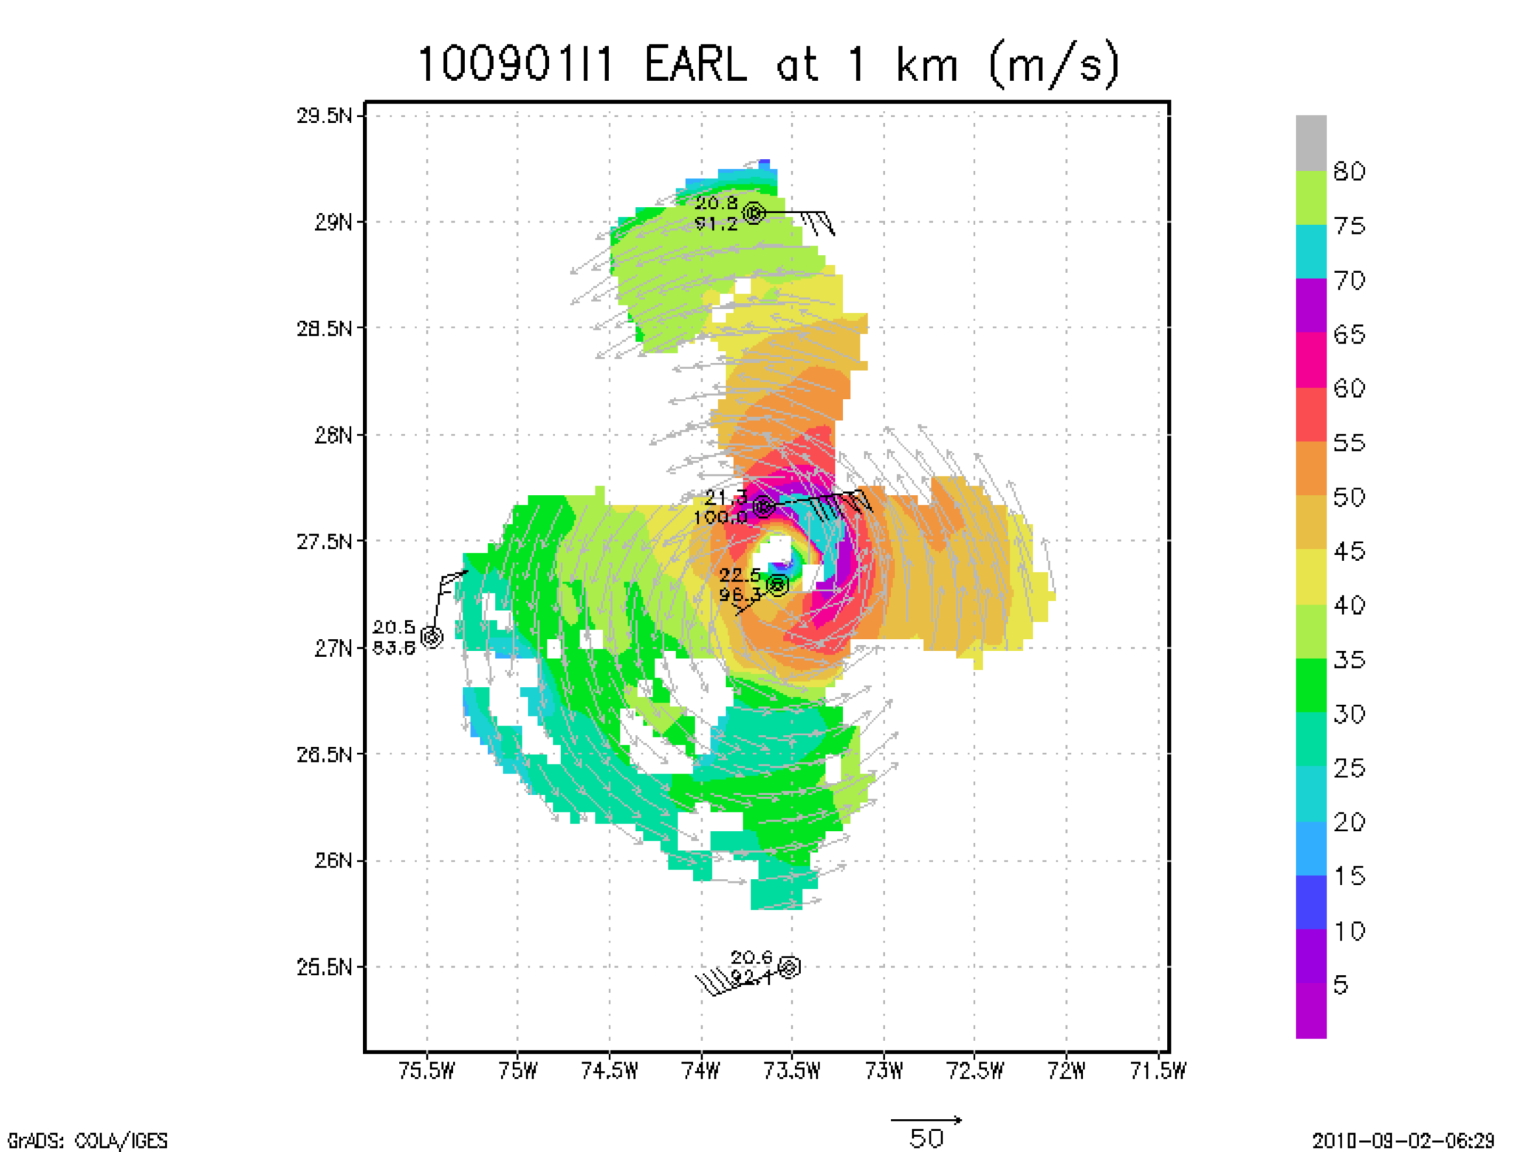 Figure 4a. Quick-look (1km altitude) Doppler wind analysis from NOAA 43 during flight 20100901I1. |
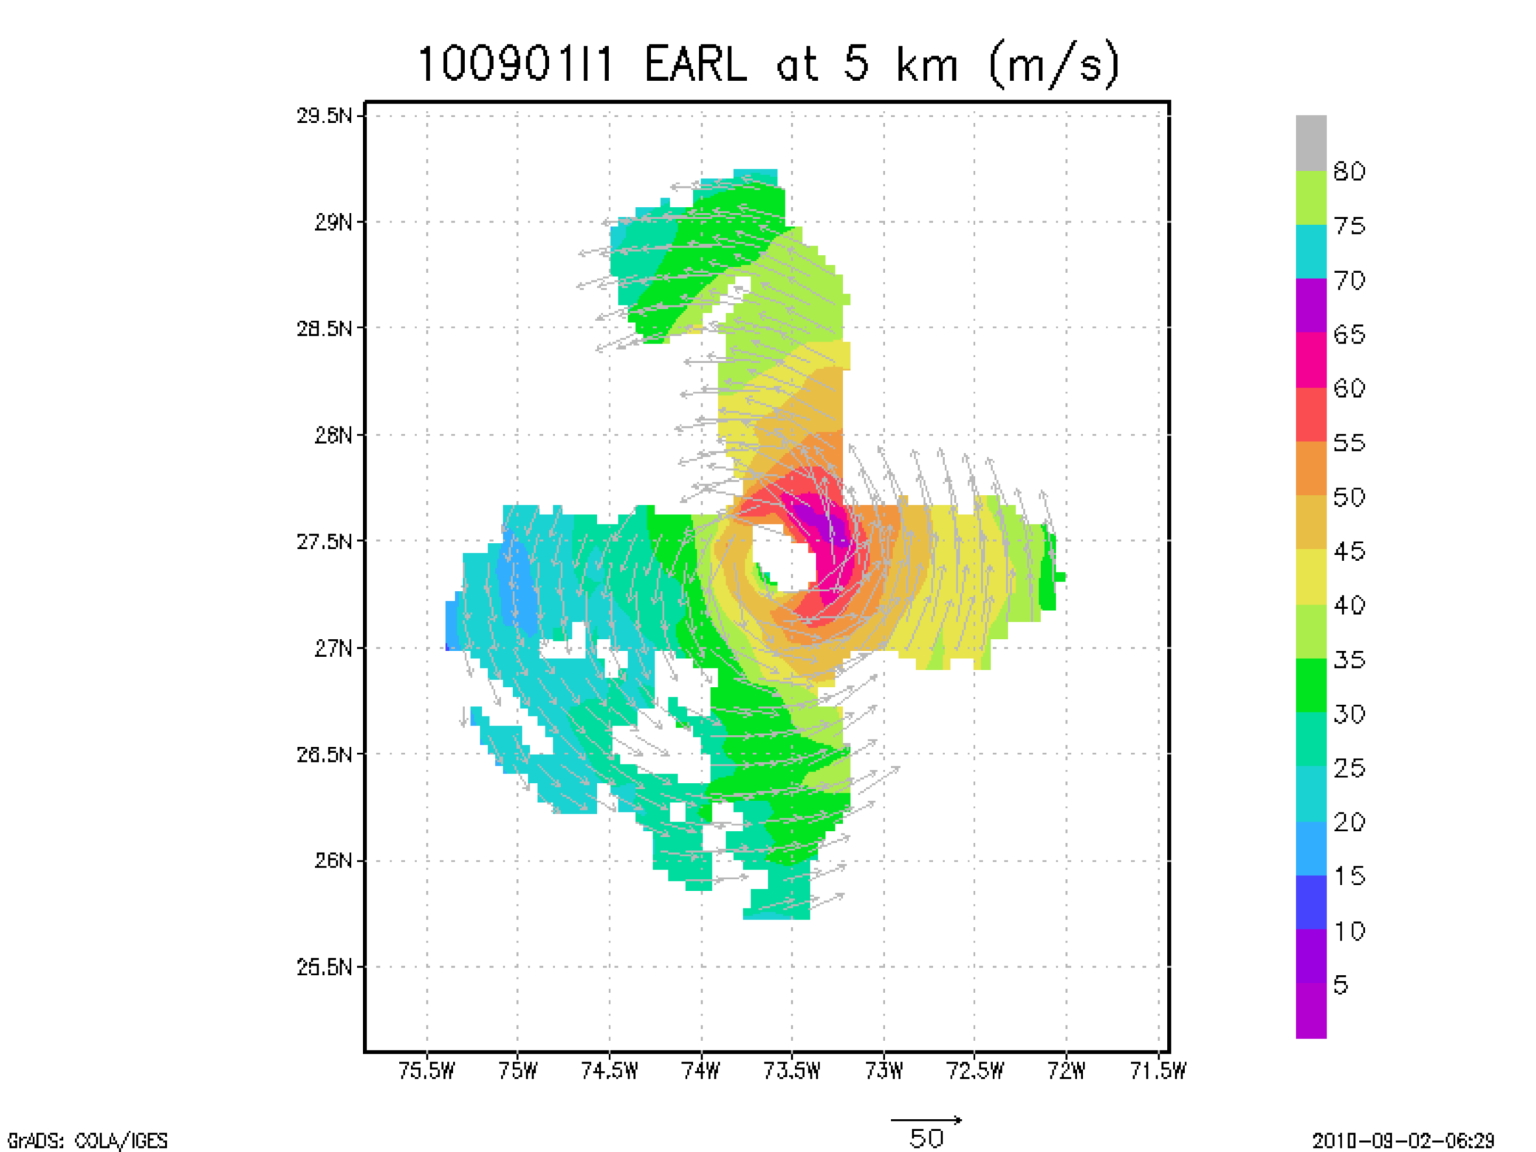 Figure 4b. Quick-look (5km altitude) Doppler wind analysis from NOAA 43 during flight 20100901I1 |
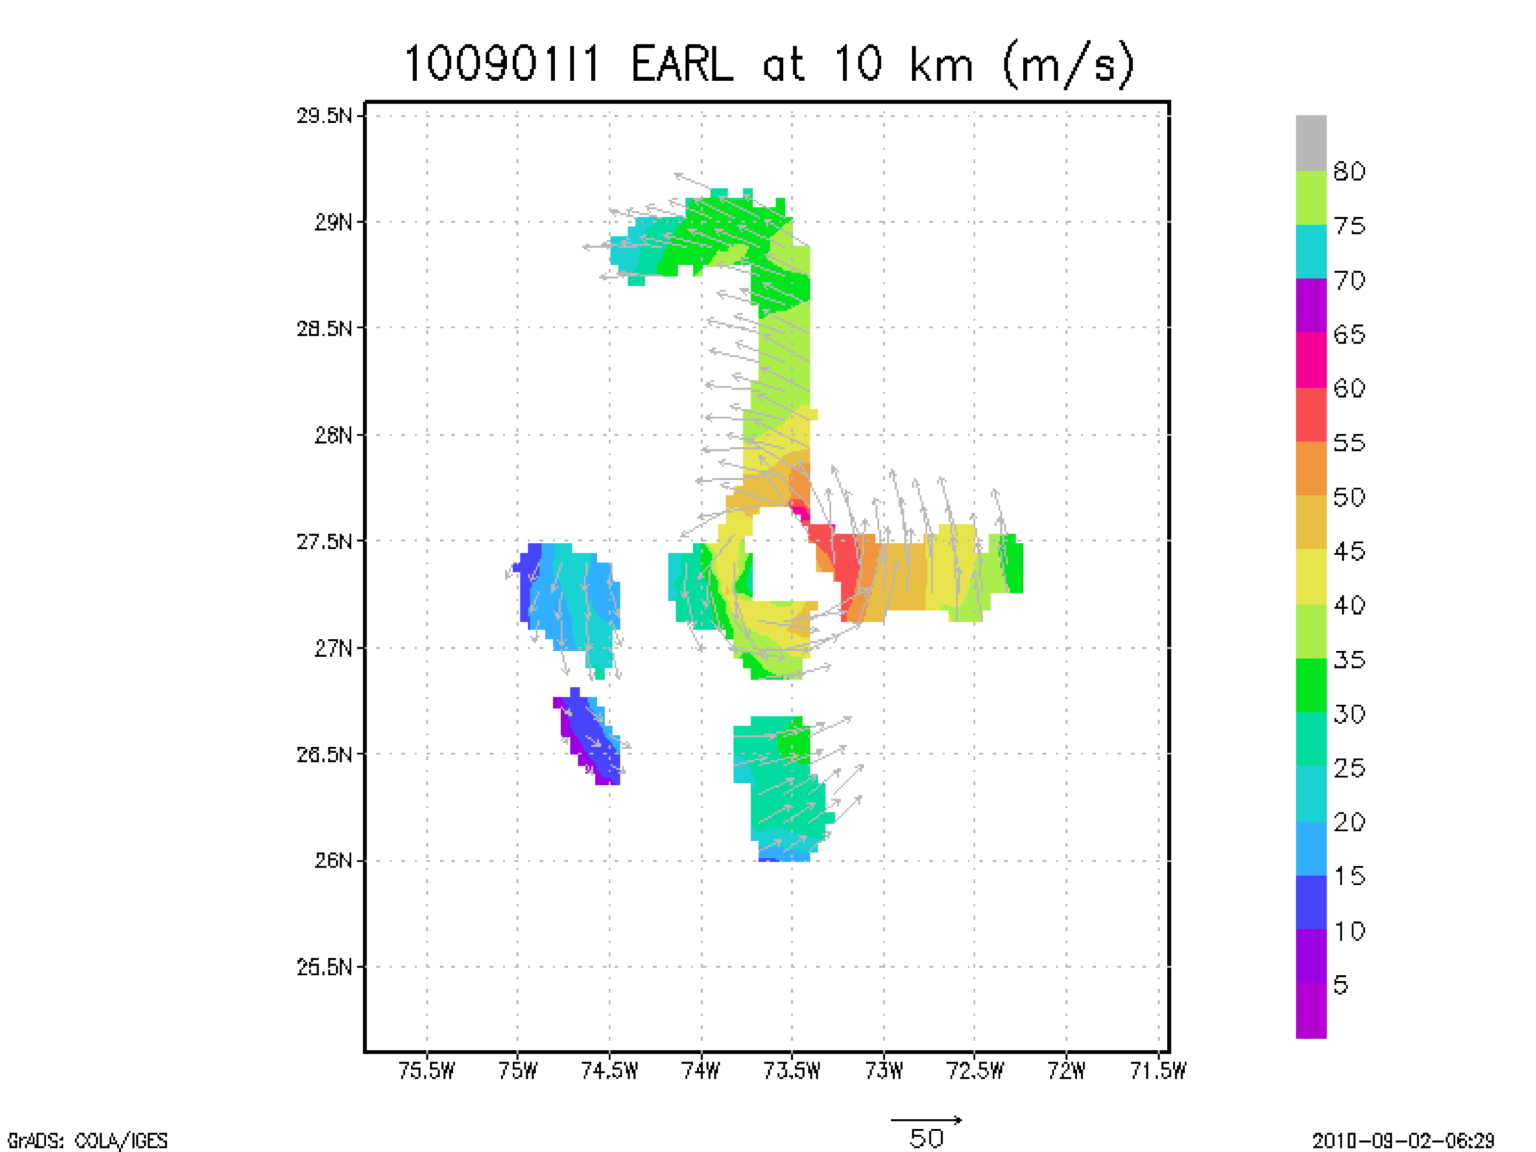 Figure 4c. Quick-look (10km altitude) Doppler wind analysis from NOAA 43 during flight 20100901I1. |
Problems :
The radar, flight-level, SFMR, and dropsonde systems worked well on this mission. Doppler analyses were conducted and successfully sent off the plane in real time. There were no GPS sonde failures. In all, 9 GPS sondes were released. 4 on the 105nmi endpoints, 4 eyewall and 1 eye drop. Total flight time was 7 hours and 59 minutes.
Joseph Cione
09/09/10
NetCDF | 1 second data | |
 Flight track |
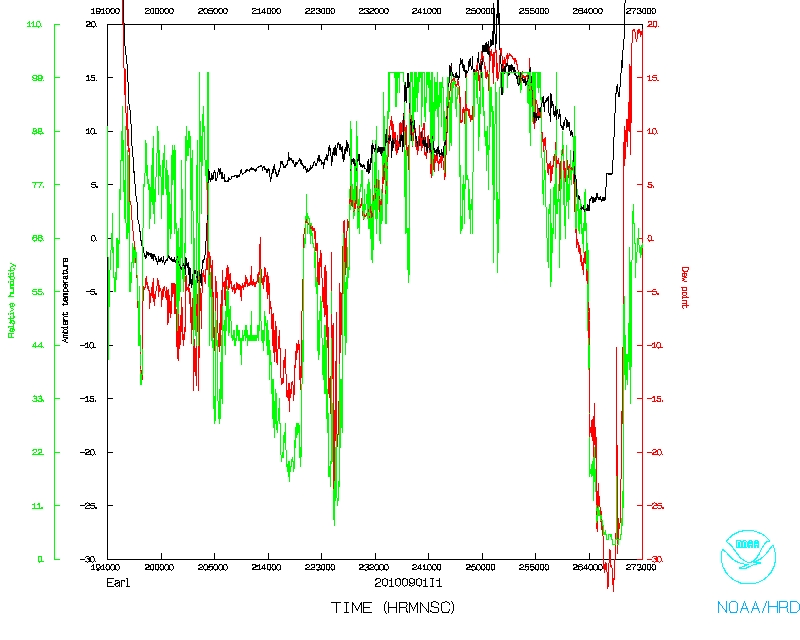 Temperature and Moisture |
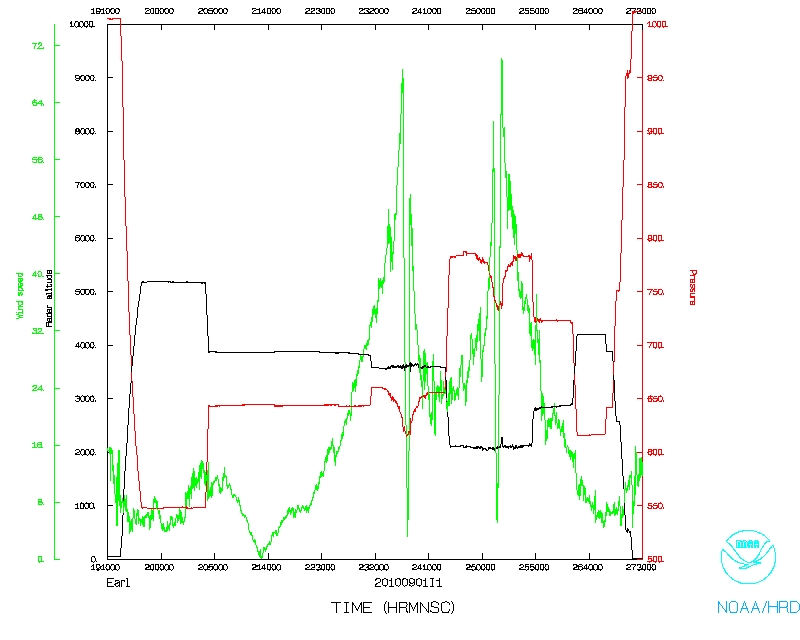 Wind and Atlitude |
 Flight track |
Page last updated Sept. 10, 2010
Return to Mission page.