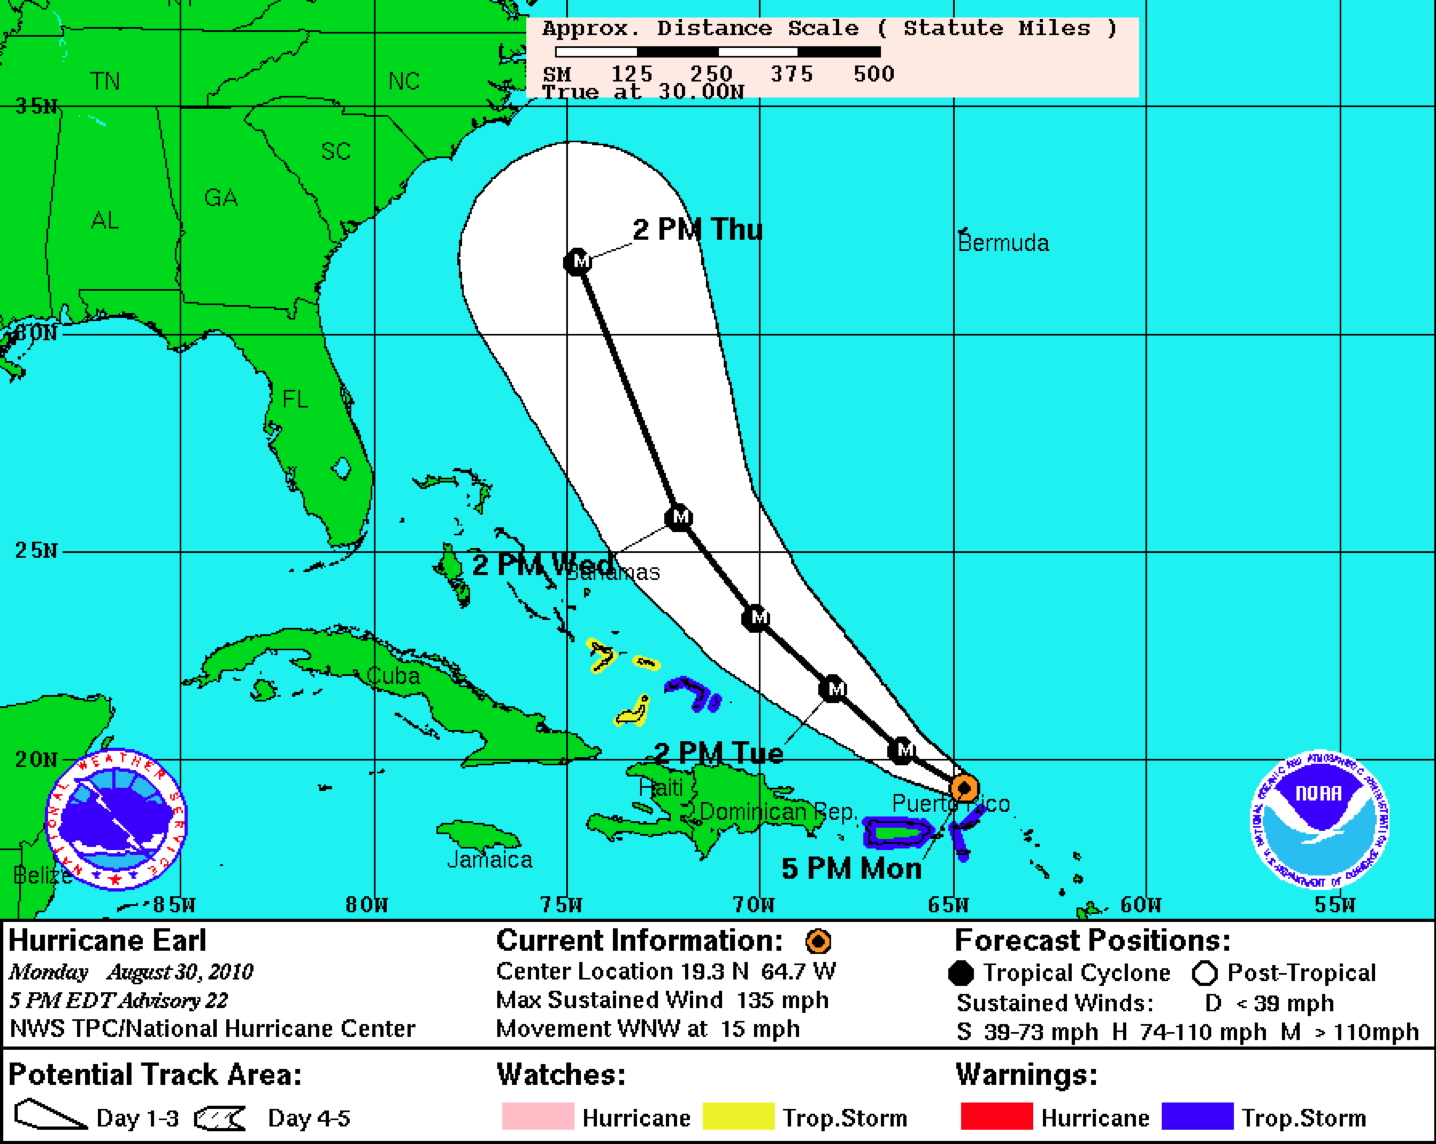
Figure 1. NHC 3-day track guidance for Hurricane Earl valid 18Z 30 August, 2010.
| Aircraft Commander | Mark Nelson |
| Co-pilot | Justin Kibbey |
| Co-pilot | Harris Halverson |
| Flight Engineer | Ken Heystek |
| Flight Engineer | Greg Bast |
| Navigator | Chris Sloan |
| Flight Director | Ian Sears |
| Flight Director | Paul Flaherty |
| Data Technician | Dana Naeher |
| Electronics Technician | Damon Sans Souci |
| Electronics Technician | Mike Mascaro |
| Electronics Technician | Bobby Peek |
| Lead Scientist | Joe Cione |
| Radar Scientist | Shirley Muriilo |
| Dropsonde Scientist | Paul Leighton |
| Guest Scientist | Jason Dvorsky (UMass) |
| Guest Scientist | Joe Sepp (UMass) |
| Guest Scientist | Zorana Jelenak (NESDIS) |
|
|
Mission Plan :
Prior to the flight, Earl was still classified by NHC as category 3 (115kt) hurricane. NHC track guidance is shown in Figure 1.
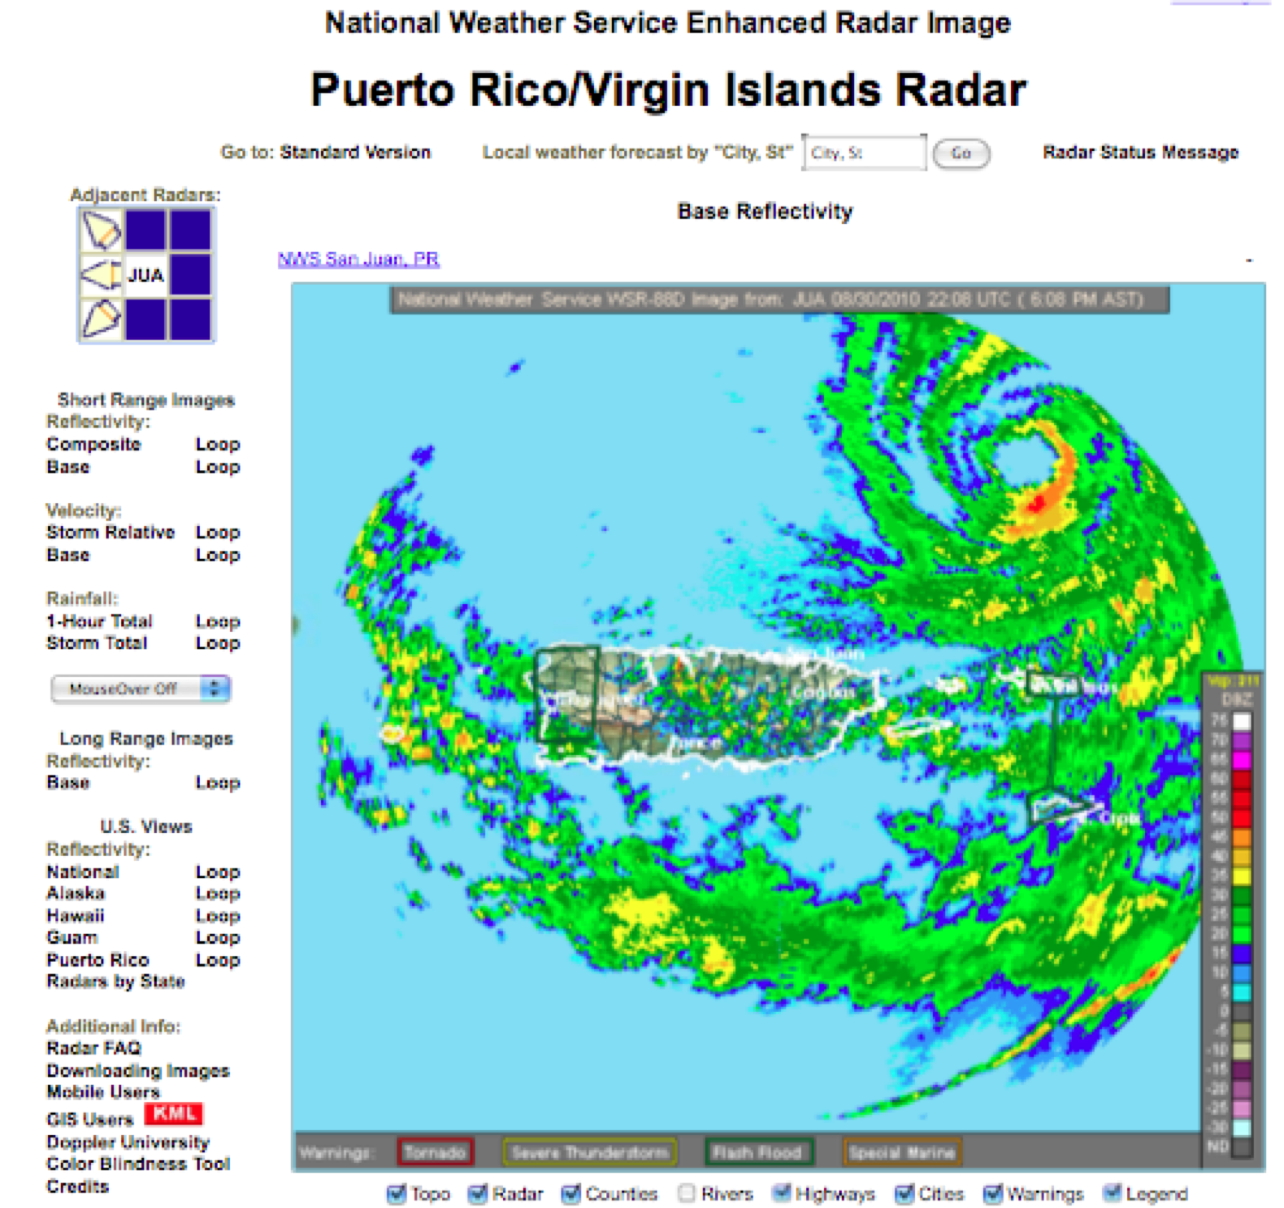
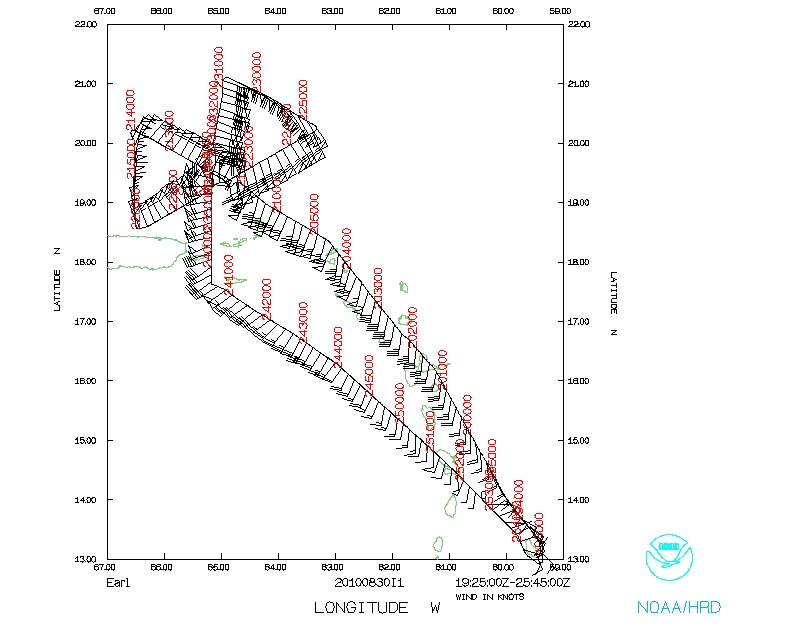
Soon after takeoff (1925UTC 30 August), NHC classified Earl as a Major Hurricane with 115kts. At 21Z 30 August, Earl's enter of circulation was located near 19.3°N 64.7°W, just north east of Puerto Rico (Figure 2).
The planned mission was a 3-penetration butterfly pattern with 105nmi legs. The flight track geometry for this flight is given below in Figure 3.
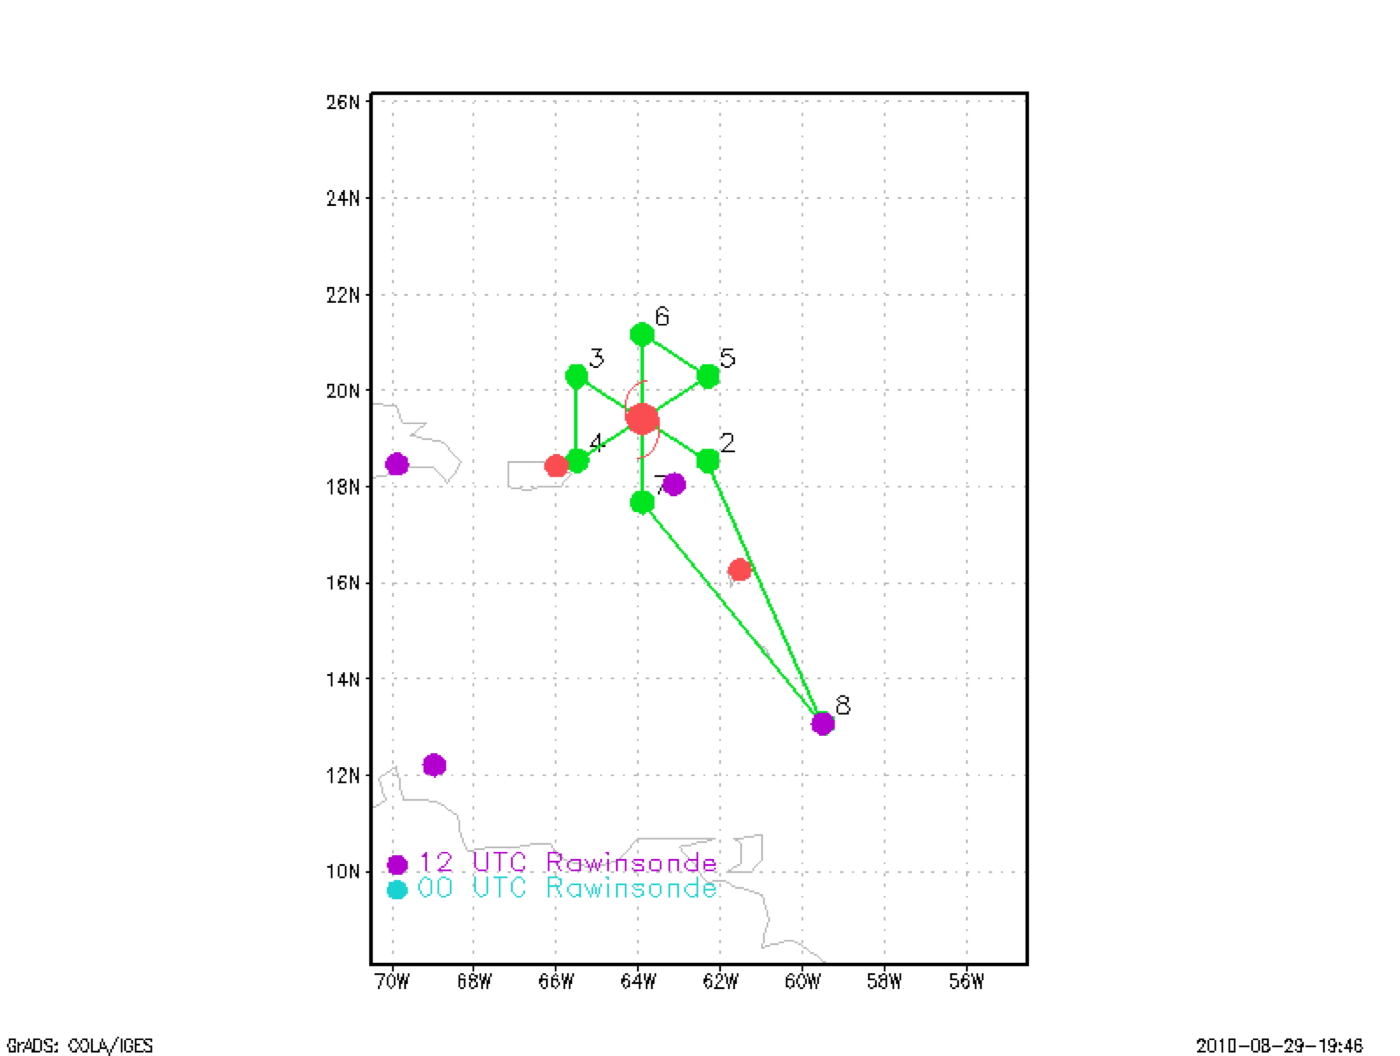
Since this was a combination TDR and Ocean Winds experiment, the experiment was conducted at 12kft (radar) from points 2-5 in Figure 3 and at 7kft (radar) from points 5-7. Total flight time was 6 hours and 22 minutes.
Mission Summary :
| Take off | Landing
| Barbados | 30/19:27 UTC
| Barbados | 31/01:47 UTC
| | ||
The following two figures capture the large scale environment associated with major Hurricane Earl prior to flight (Figures 3a-b).
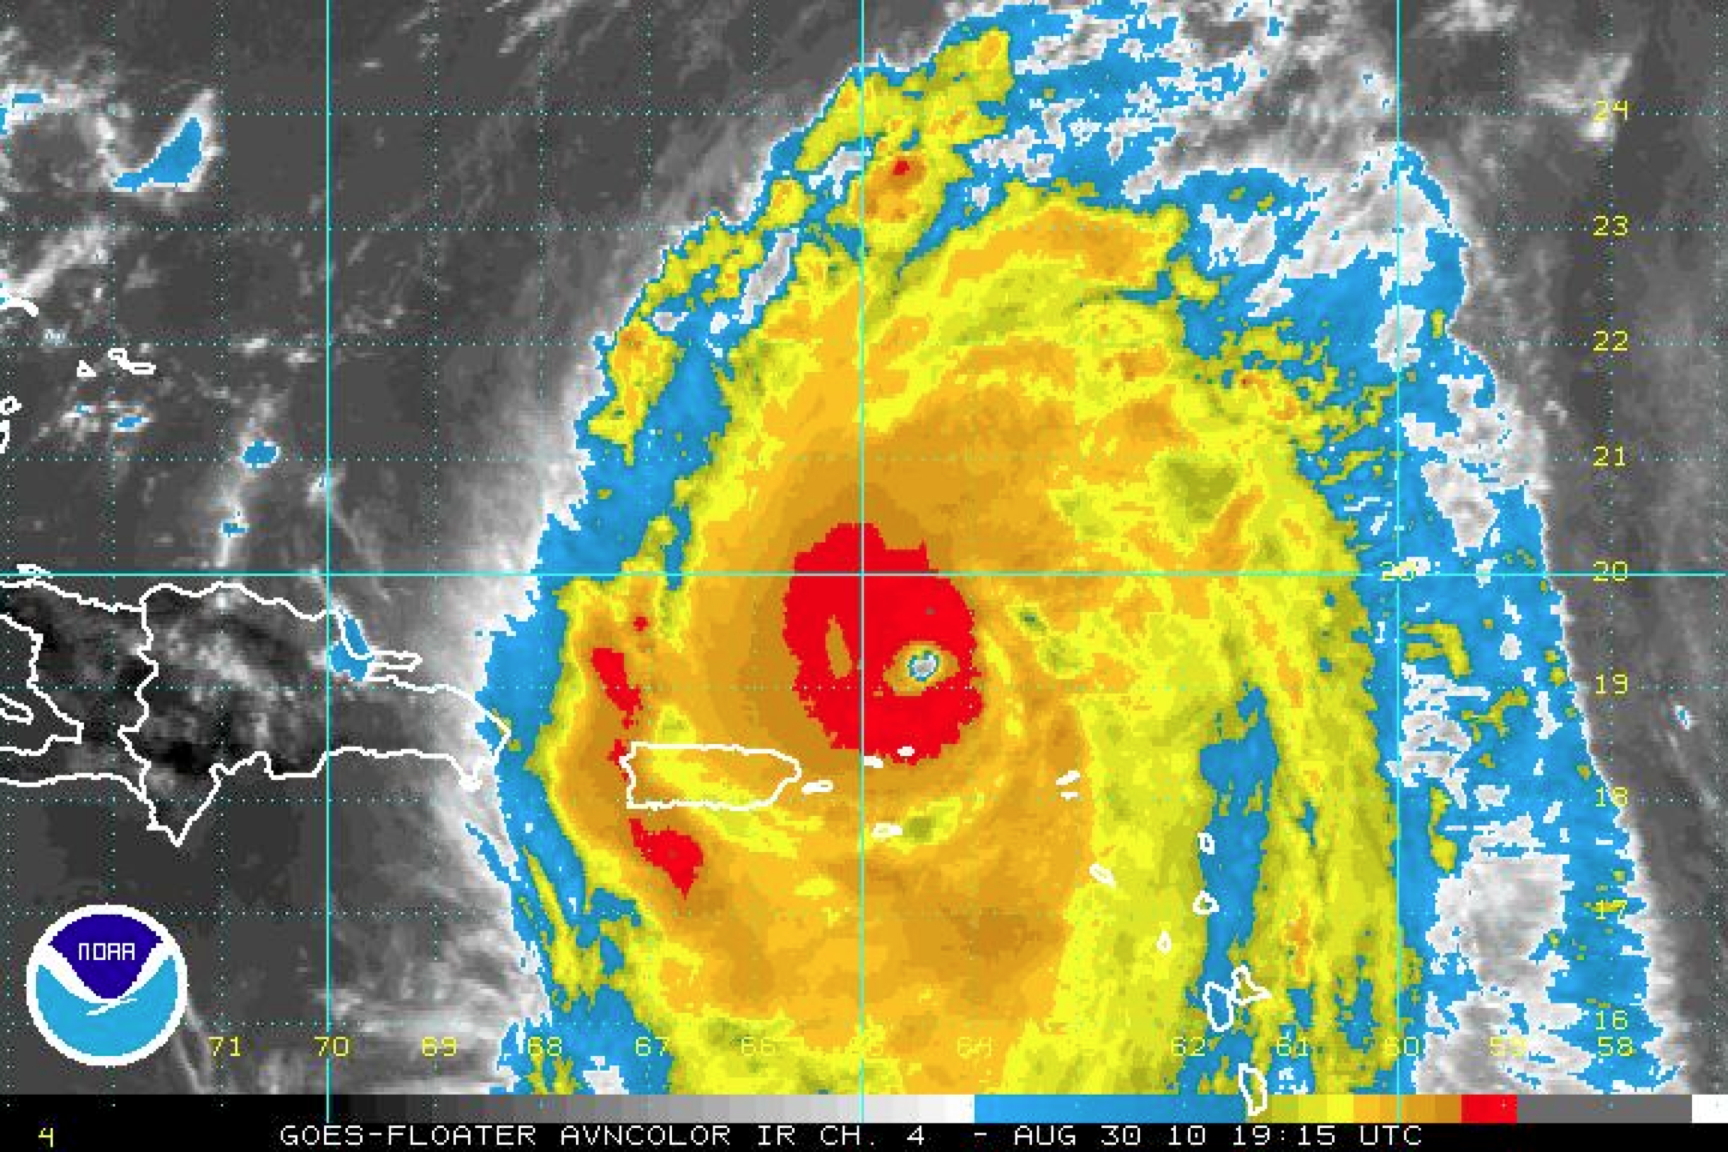 Figure 4a: GOES IR imagery illustrating coldest (highest) cloud tops near the core and in association with a primary rainband well south and west of the circulation center. The image is valid 1915Z 30 August 2010. |
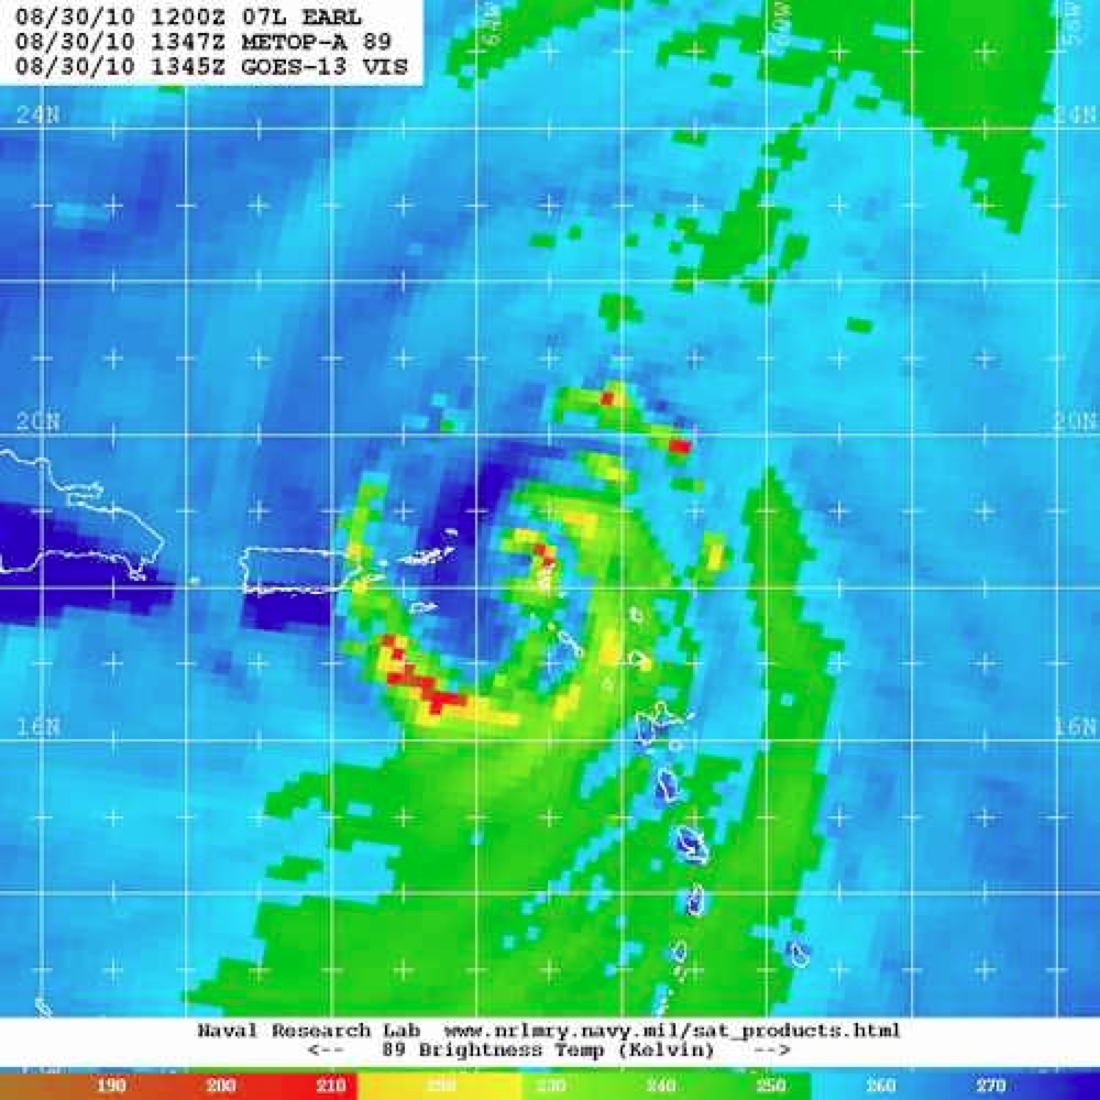 Figure 4b: Microwave satellite image depicting the 89 GHz brightness temperature. The imagery is valid for 1347Z 30 August 2010. While the timestamp is several hours prior to mission take-off, the 22Z JUA radar image shown in Figure 2 illustrated very similar overall structure including a principal rainband to the SW and maximum reflectivity within the eastern eyewall region. |
Ferry altitude for this flight was 13.5kft. As Figure 3 illustrates, The IP for NOAA 43 required a northwest heading in order to enter the storm from the south east. The GPS drop plan for this flight was to repeat the mission plan from the 8/29 N43 mission whereby sondes were dropped at each 105nmi endpoint, then again within Earl's eyewall region. Once through the center of circulation, the drop sequence was then reversed (i.e. eyewall, endpoint). On the first and last legs through the system, eye/center fix sondes were also planned. In order to meet mission requirements for both experiments conducted on this flight, 12Kft (radar) altitude was maintained for the TDR experiment from the IP through point 5 shown in Figure 3. After this waypoint, N43 descended to 7kft (radar) and finished the remaining pattern at this altitude in order to satisfy Ocean Winds science objectives. Also, in order to minimize interference between the TDR and Ocean Winds onboard equipment, Doppler radar was run in 'wedge mode' when the aircraft was at 7kft altitude. During the TDR mission Doppler radar was run in "FAST" mode.
Once in the storm, it became clear that the microwave satellite imagery and JUA radar depiction were going to be validated. That is, the most active convection was indeed found on the eastern eyewall and a very prominent primary rainband was observed to the south and sw of the storm center. While the relatively dry core conditions found on the 28th (and to a lesser degree on the 29th) were not as noticeable on this flight, there were regions (particularly near the western eyewall) that still seemed to be incorporating some dry air from the surrounding environment. Similar to the 29th N43 flight a complete and symmetric inner core convective pattern had not yet emerged (despite the fact that major hurricane Earl was at or near category 4 strength). On a personal note, this was very reminiscent of a Hurricane Bill (2009) that was in its general vicinity, near this intensity and also exhibited similar '1/2' eyewall convective structure. Generally speaking, the convective pattern on this Earl flight was skewed towards the east/south eastern side of the storm, again suggesting that dry air was likely making its way into the core circulation and manifesting itself on the west/northwest inner core region of the hurricane.
At this time, Earl's forward speed and heading were ~13kt and 290 degrees, respectively. MSLP, obtained from a GPS dropsonde, was ~936 mb for this mission, representing a 33mb drop over a ~24h period. Peak SFMR surface winds were found in the NE eyewall (~110kts). Analyses of surface wind speed (Figure 5) and N43 1km Doppler-derived wind speed and direction (Figure 6a) are provided below and depict similar peak low level wind structure. Similar TDR quick-look analyses valid at 5km and 10km are also provided below (Figure 6b, c).
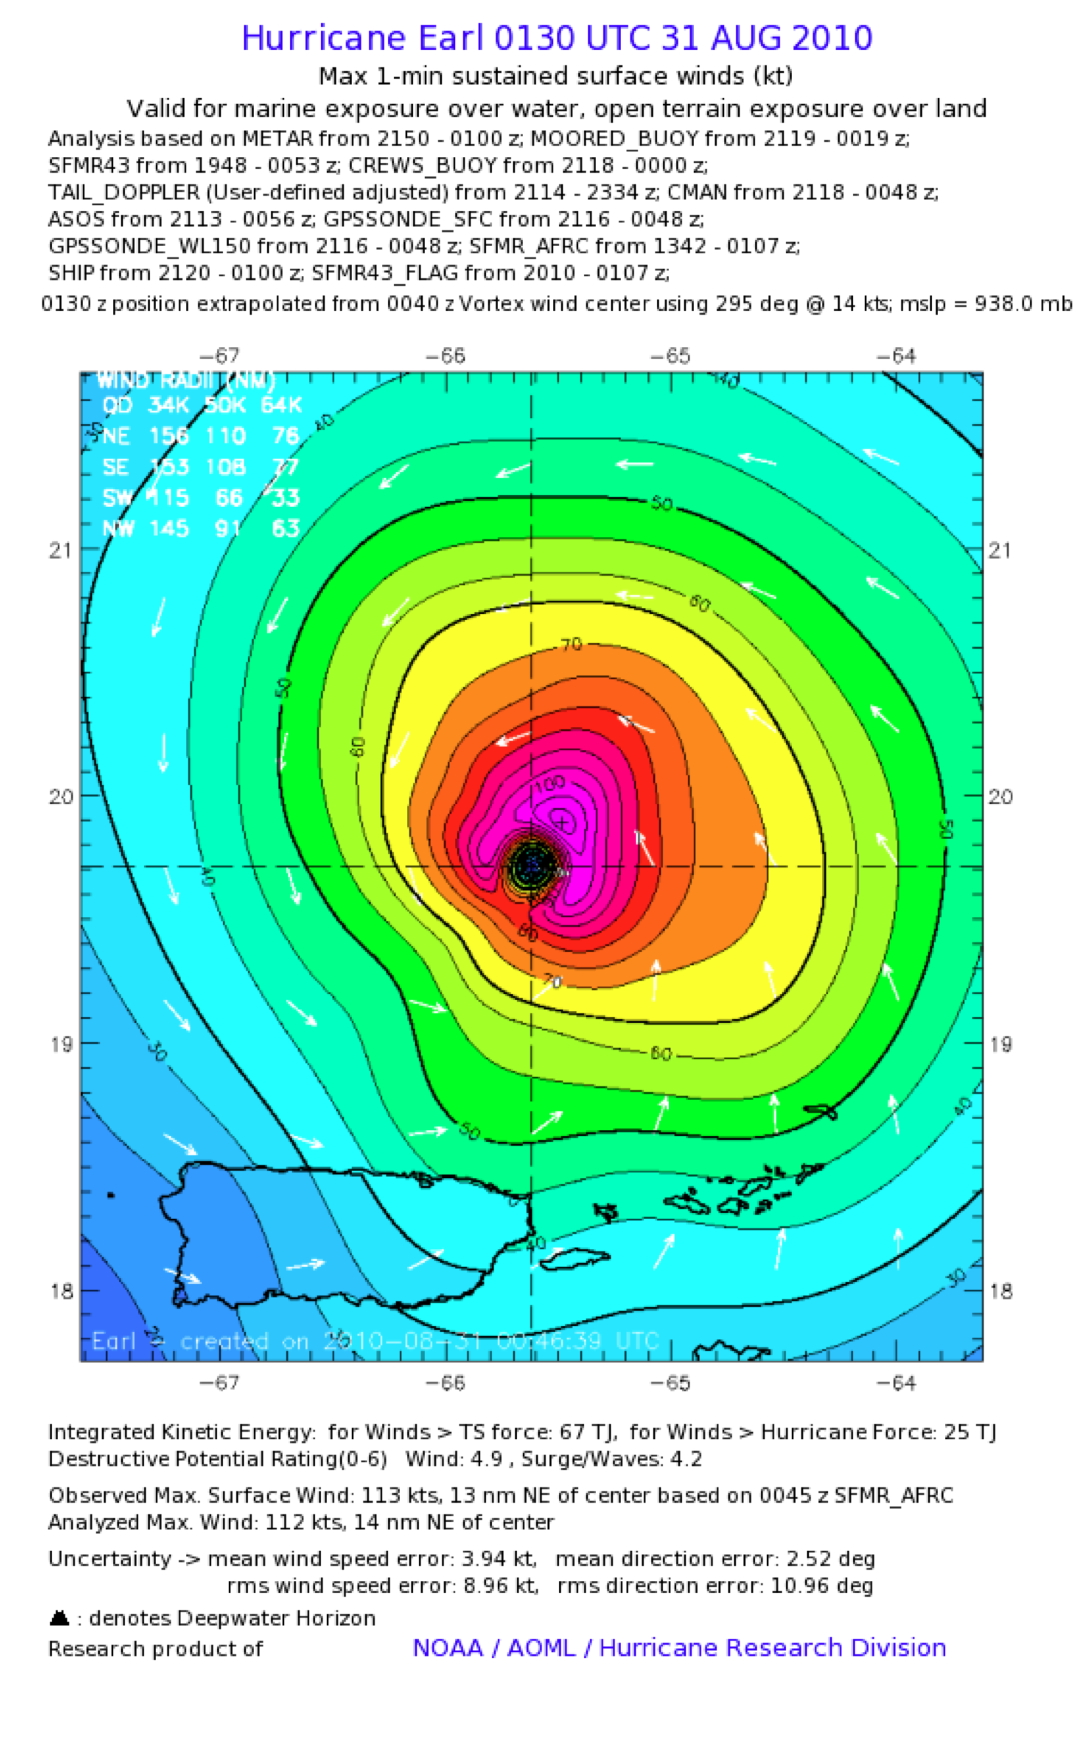
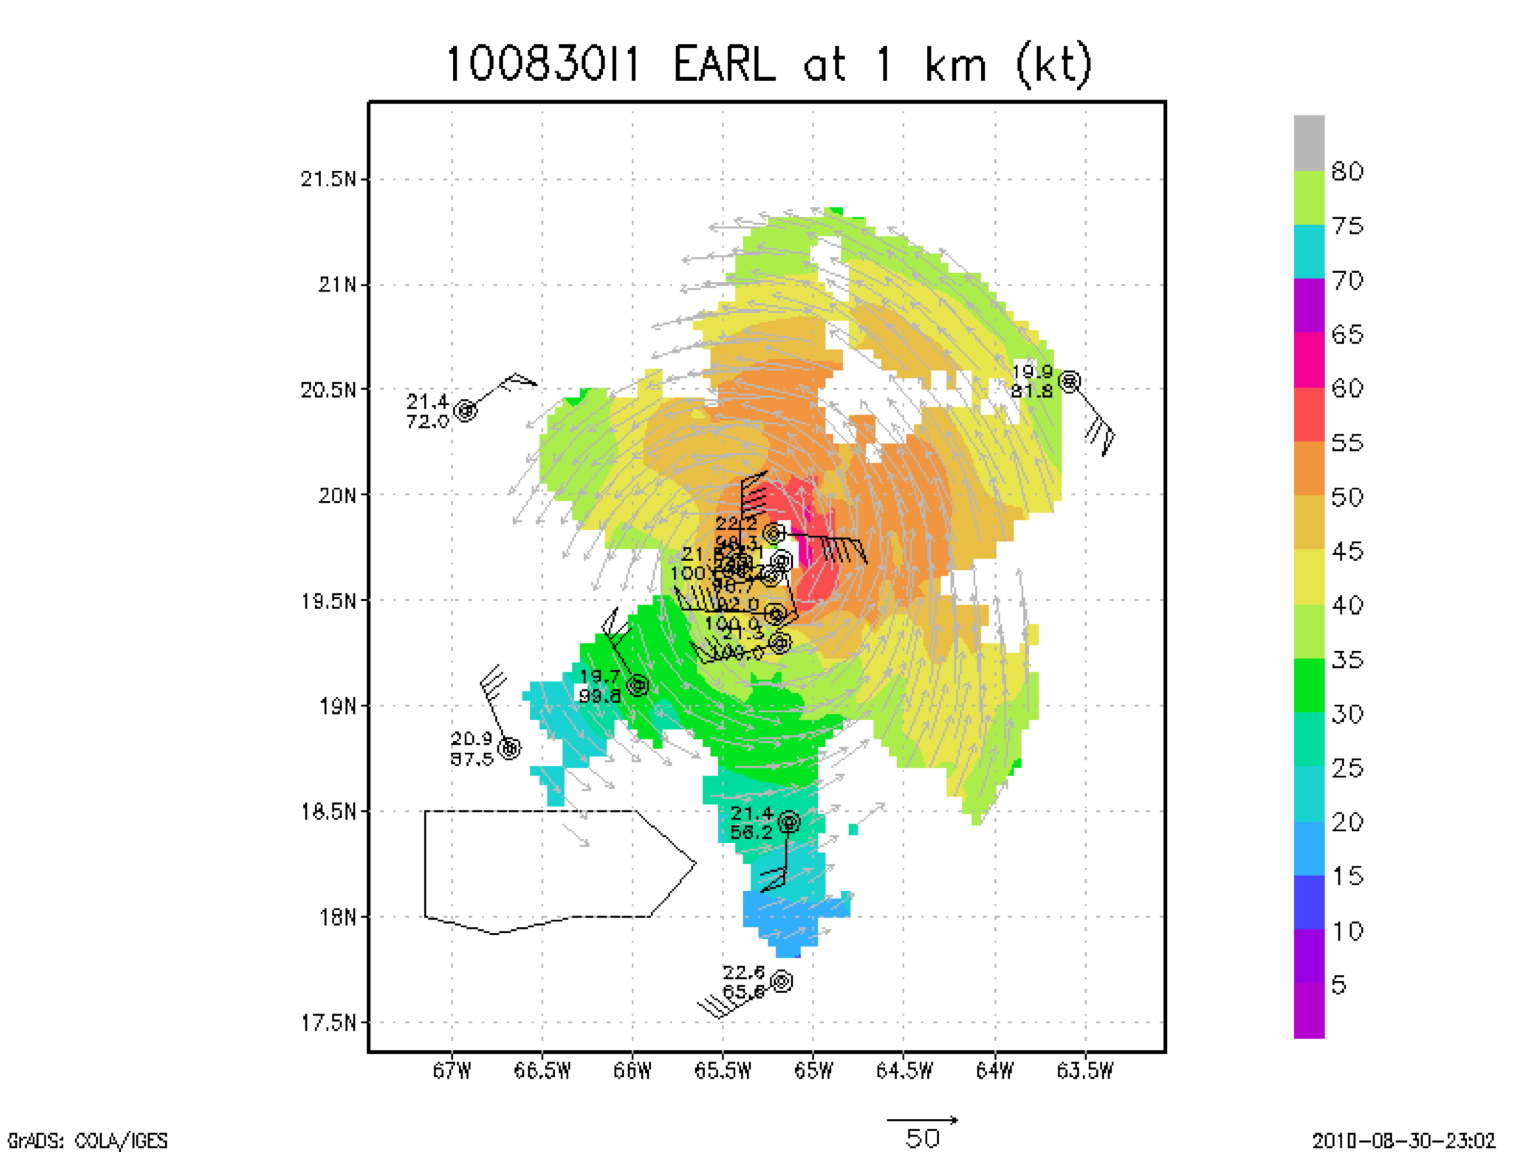 Figure 6a. Quick-look (1km altitude) Doppler wind analysis from NOAA 43 during flight 100829I1. |
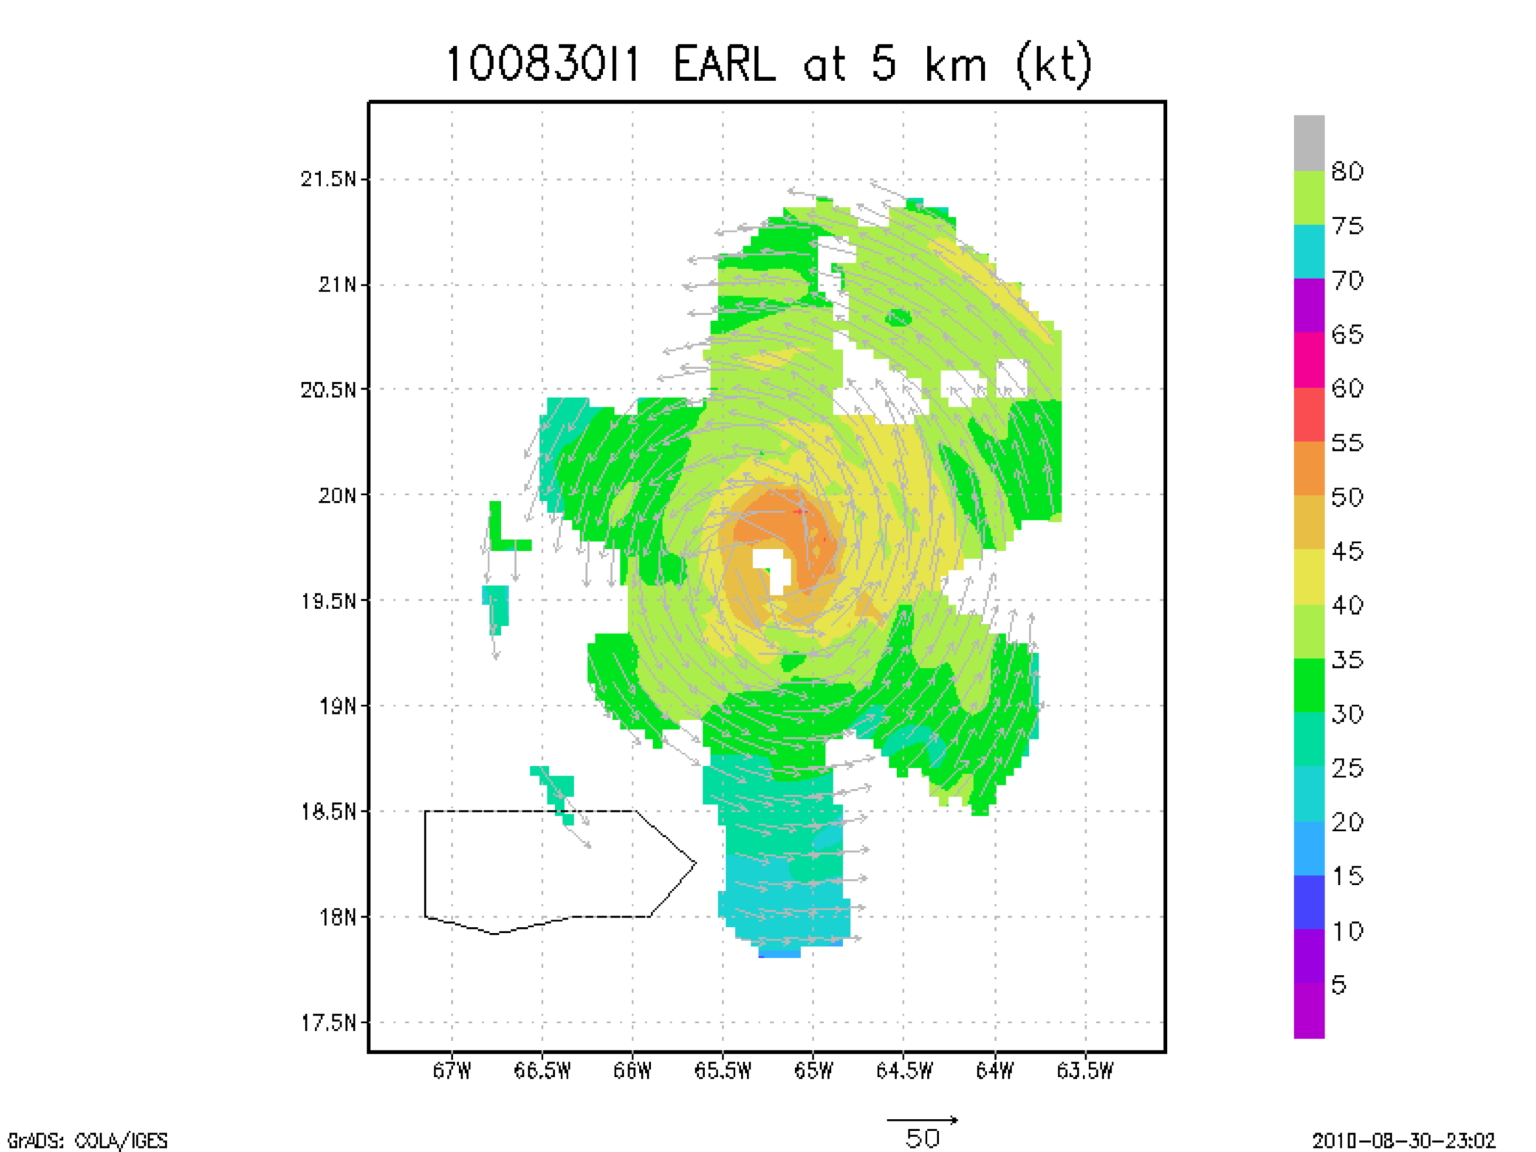 Figure 6b. Quick-look (5km altitude) Doppler wind analysis from NOAA 43 during flight 100829I1 |
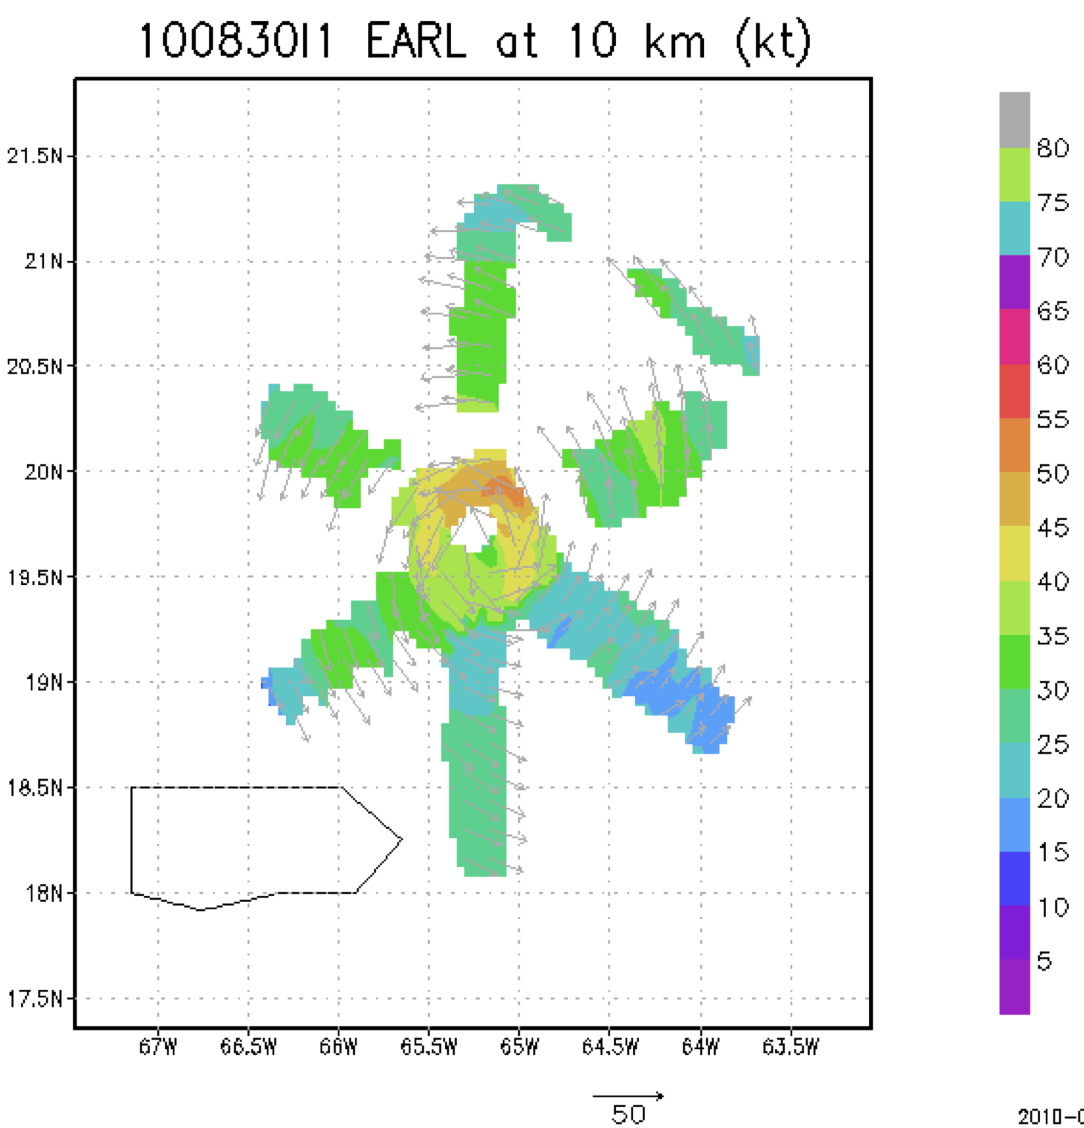 Figure 6c. Quick-look (10km altitude) Doppler wind analysis from NOAA 43 during flight 100829I1. |
Problems :
The radar, flight-level, SFMR, and dropsonde systems worked well on this mission. Doppler analyses were conducted and successfully sent off the plane in real time. There were no GPS sonde failures. In addition to the planned 14 drops, an additional sonde was released in order to sample an interesting convective pattern on the eastern side of the storm. In all, 15 GPS sondes were released. 6 on the 105nmi endpoints, 6 eyewall, 2 eye drops and 1 supplemental .
Joseph Cione
09/09/10
Page last updated February 11, 2011
Logs
LPS forms |
radar forms |
sonde forms
Data
NetCDF |
1 second data |
Flight track
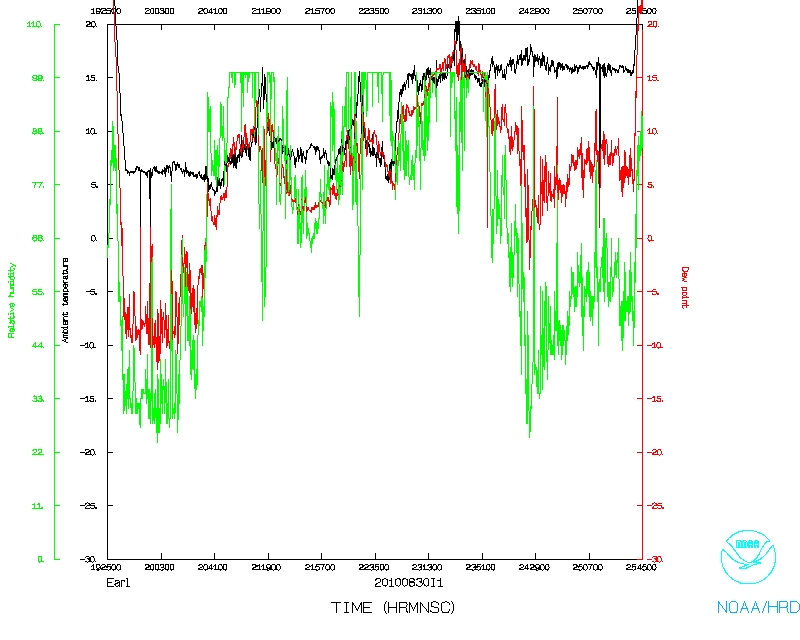
Temperature and Moisture
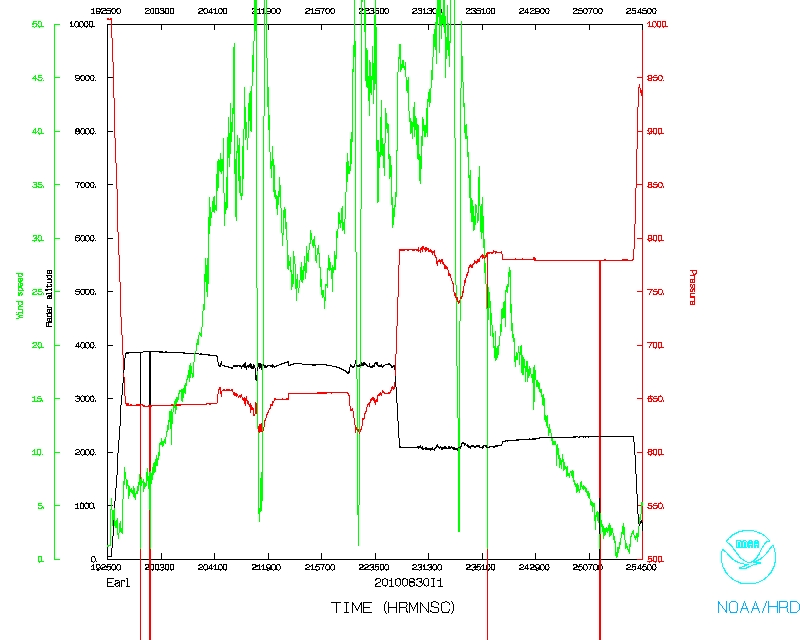
Wind and Atlitude
Return to Mission page.