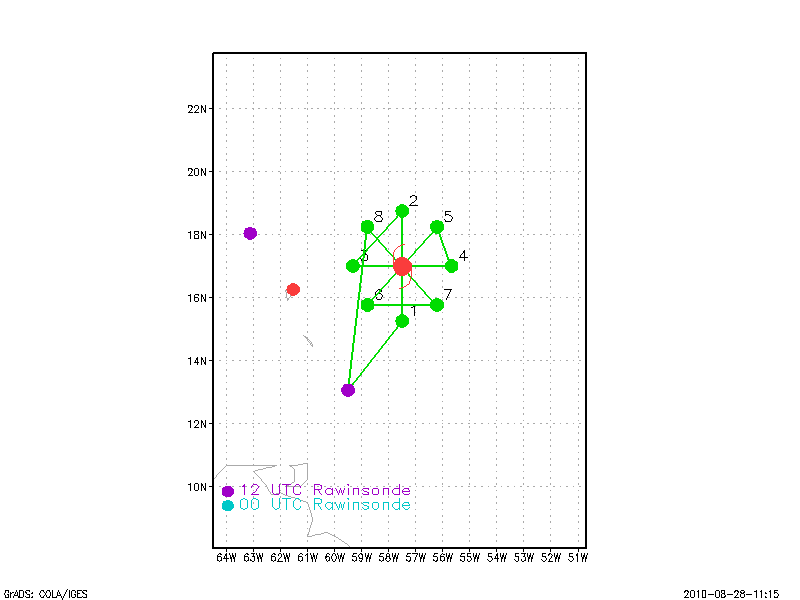
Figure 1. Proposed flight plan
| Aircraft Commander | Carl Newman |
| Co-pilot | Cathy Martin |
| Co-pilot | Mark Sweeney |
| Flight Engineer | Joe Klippel |
| Flight Engineer | Paul Darby |
| Navigator | Devin Brakob |
| Flight Director | Barry Damiano |
| Flight Director | Jess Williams |
| Data Technician | Joe Bosko |
| Avionics | Bill Olney |
| AVAPS | Terry Lynch |
| AVAPS | James Warnecke |
| AVAPS | Todd Richards |
| Lead Scientist | John Gamache |
| Radar Scientist | Sylvie Lorsolo |
| Dropsonde Scientist | Eric Uhlhorn |

Mission Plan :
Fly into TS Earl and do a rotating figure 4 pattern with 105 nm legs. Drops at 105 nm and 52.5 nm. 52 nm drops may be moved slightly radially inward or outward to be dropped in convection.
Mission Summary :
| Take off | Landing
| Barbados | 29/08:11 UTC
| Barbados | 29/15:06 UTC
| | ||
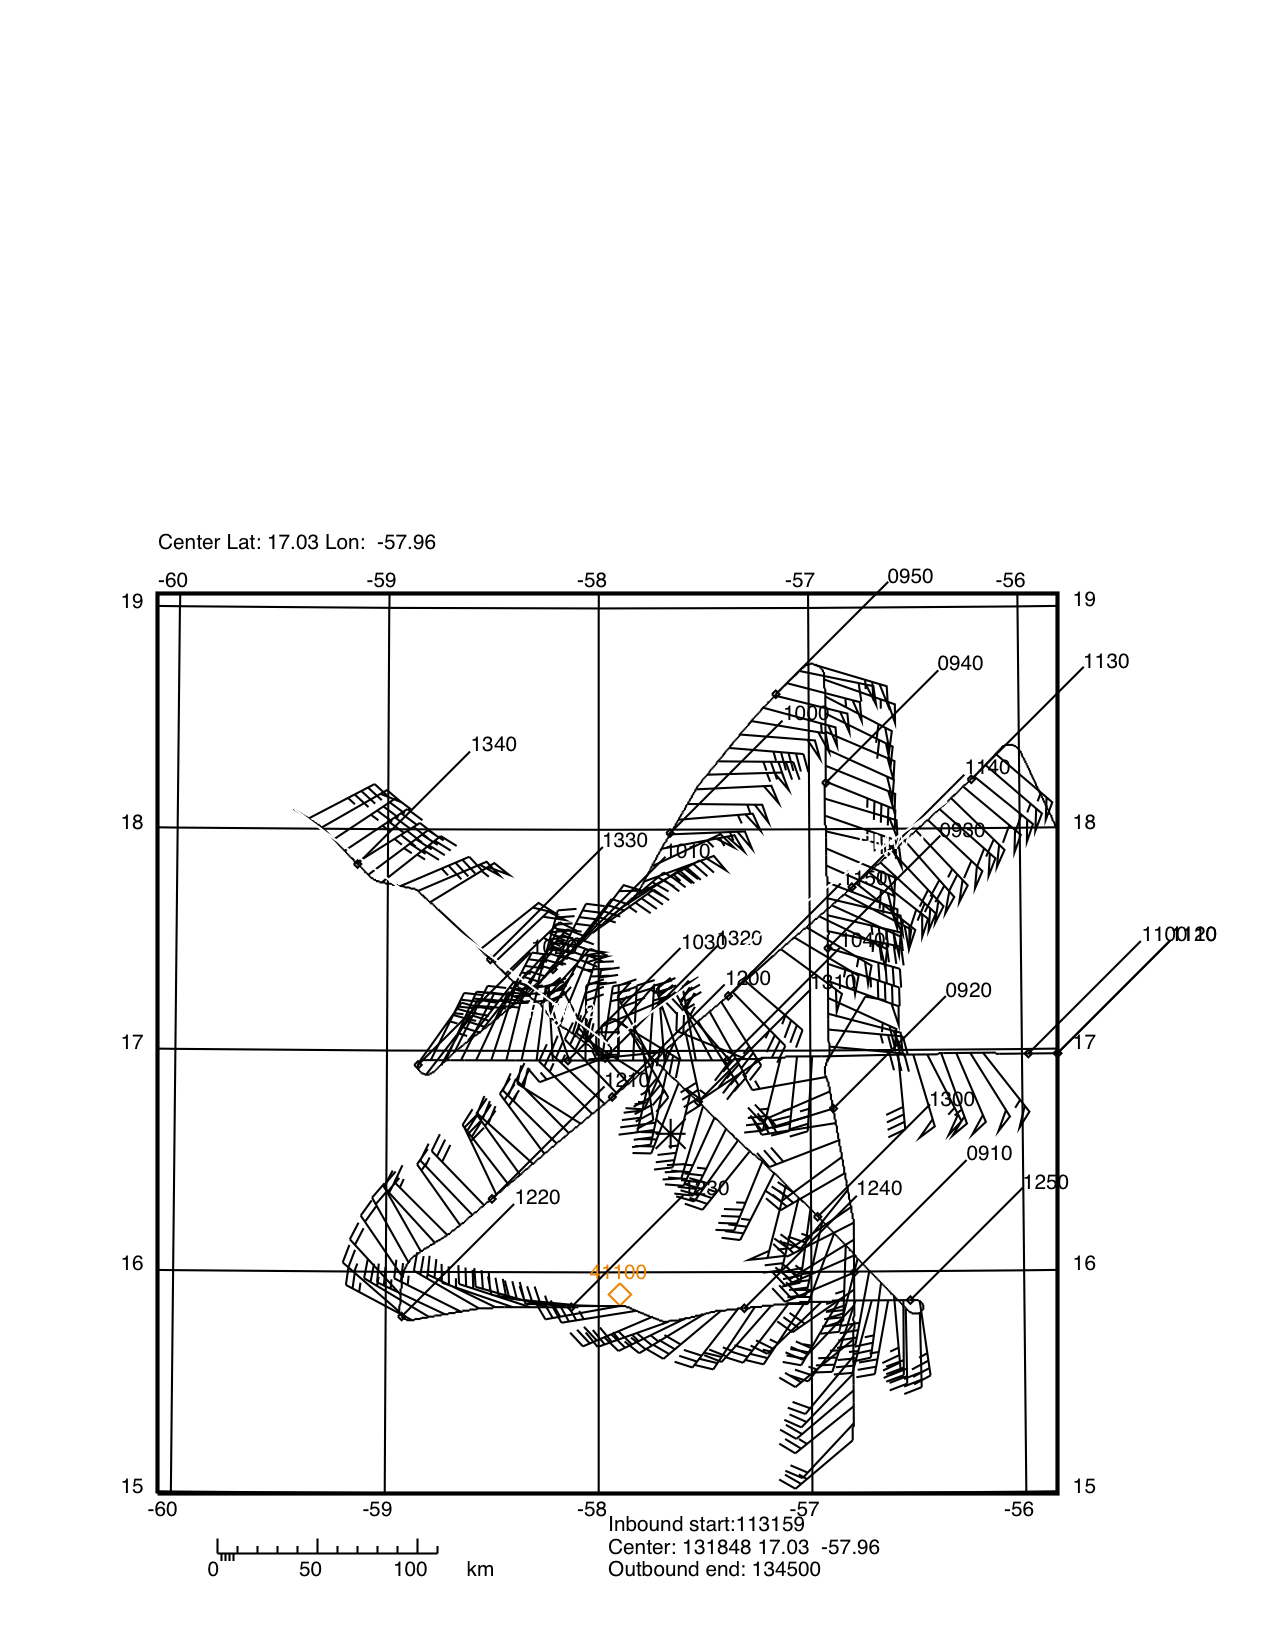
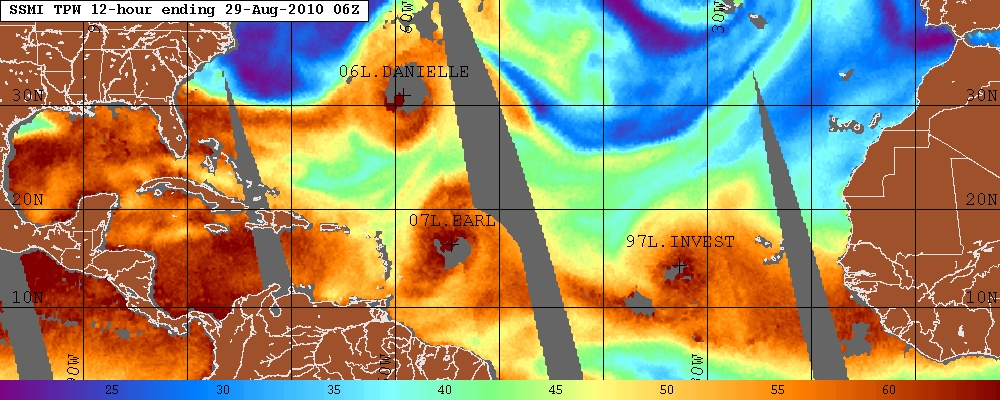
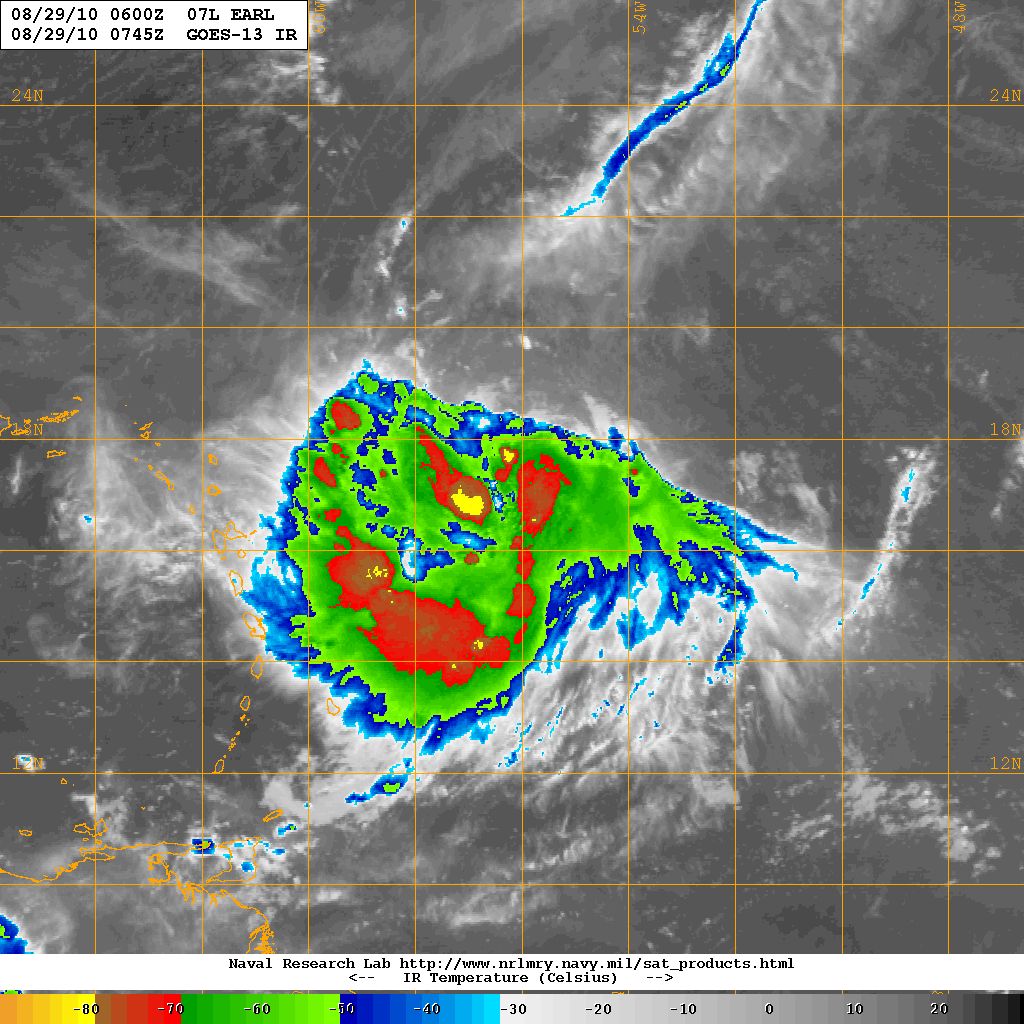
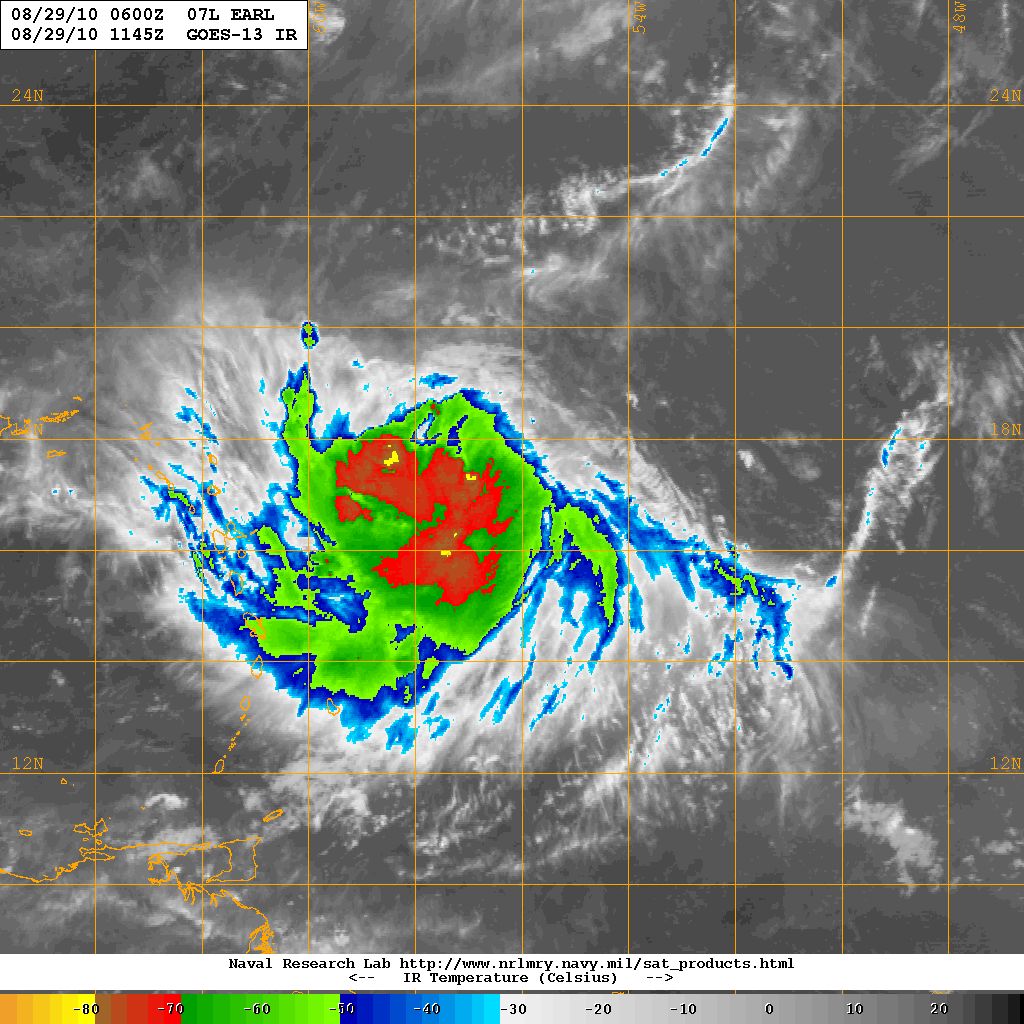
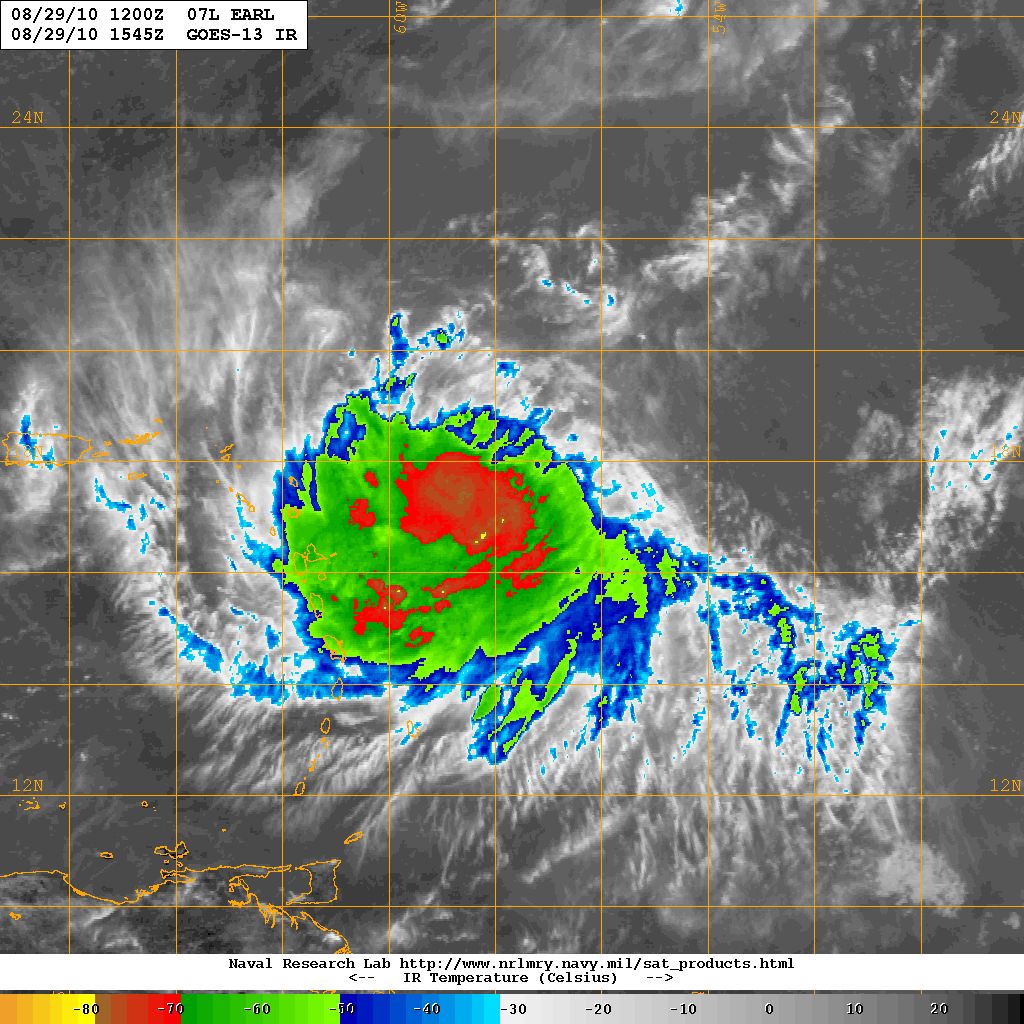
At time of takeoff (0811 UTC), TS Earl was officially a 55 kt (~30 m/s) tropical storm, moving toward 280 at 16 kts (8 m/s). CIMMS imagery (Fig 3.) showed a nearly 20 kt NNE deep wind shear over Earl, and a core fairly well insulated from dry air, based upon NRL TPW imagery (Fig. 4). A very linear northern edge to the deep convection hinted at the same NNE shear (Fig. 5a), coming from outflow from Hurricane Danielle. Very deep convection could be found in the northern side of the still organizing system, reaching to -80°C. The deep convective pattern became more circular during the course of the flight (Fig. 5b), and by the end of the flight (Fig. 5c), TS Earl had officially become a minimal 65-kt hurricane. The visible satellite photo showed a fairly well organized system (Fig. 6).
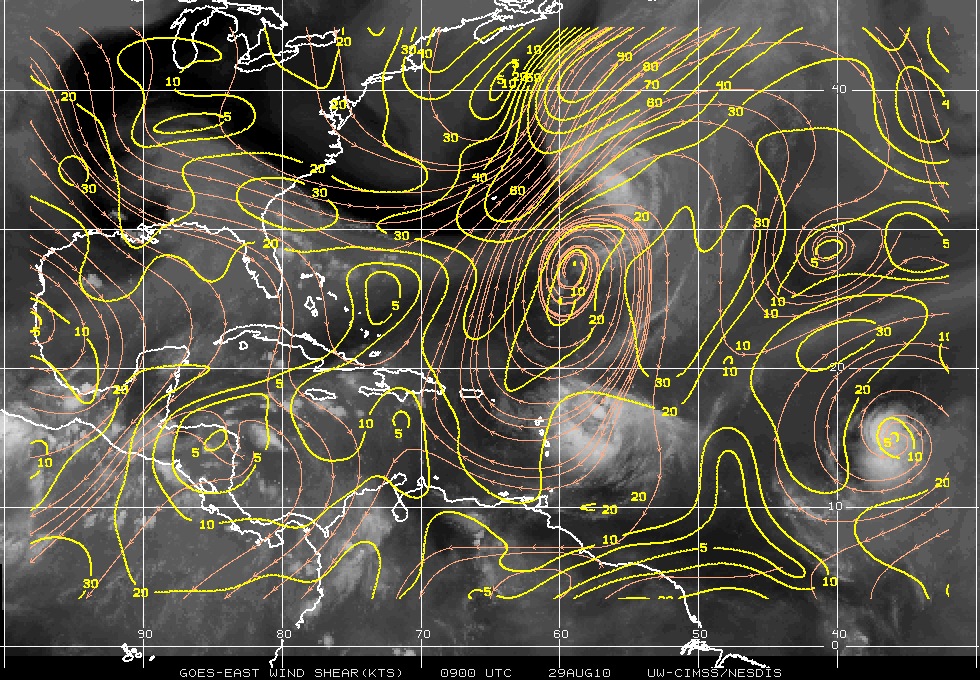
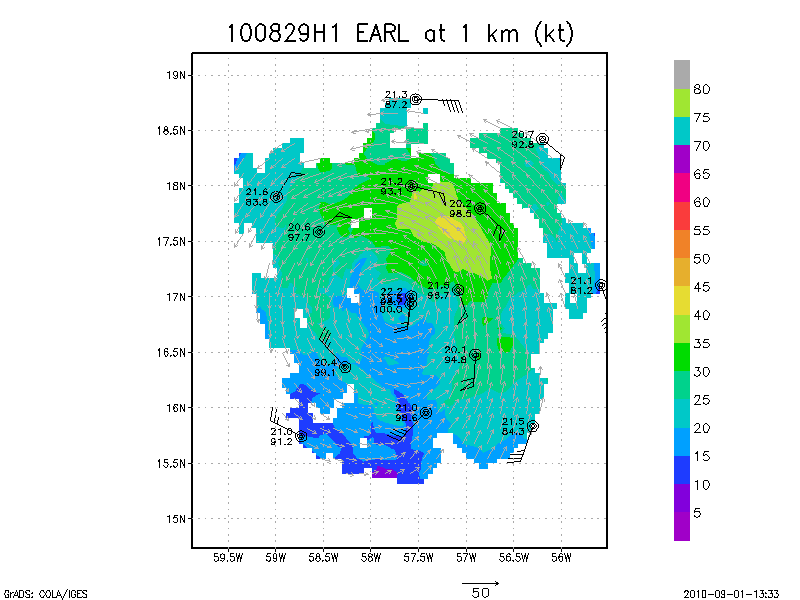
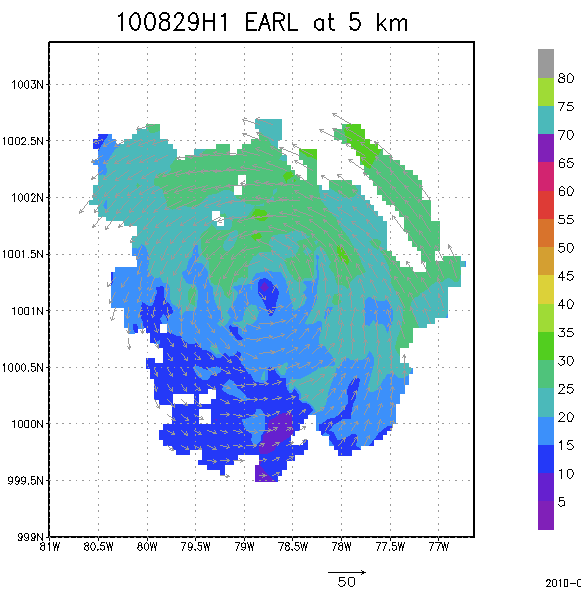
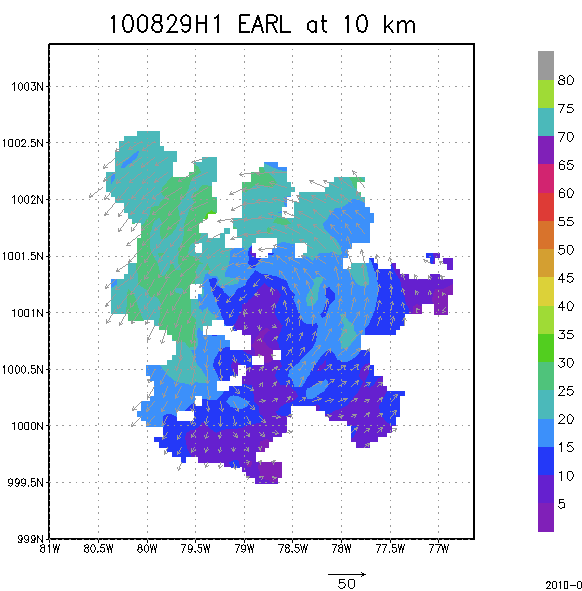
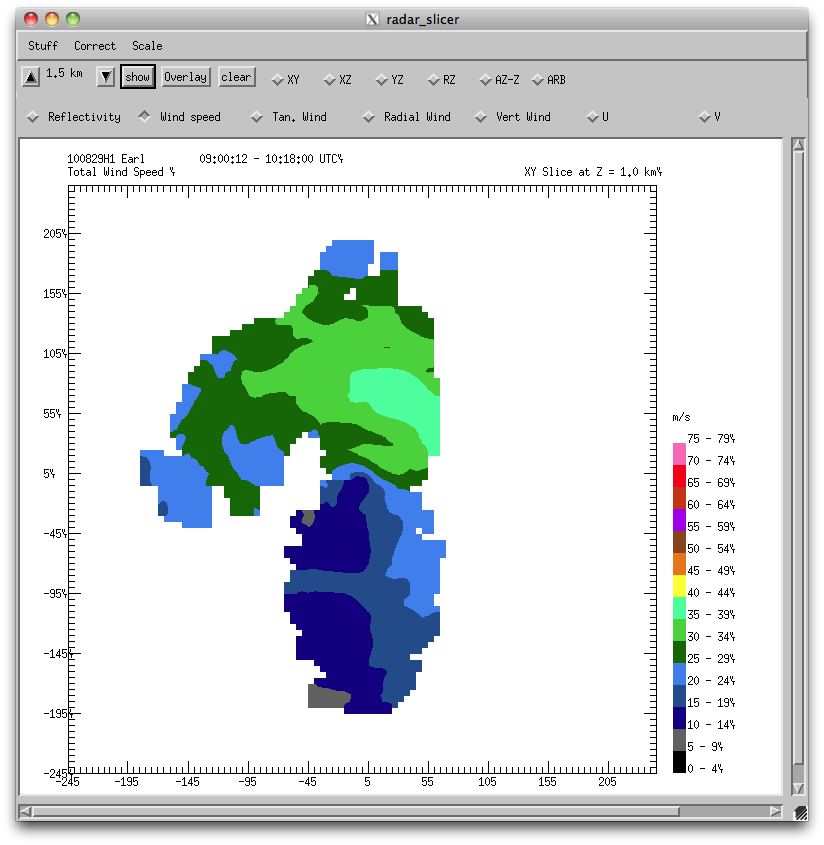
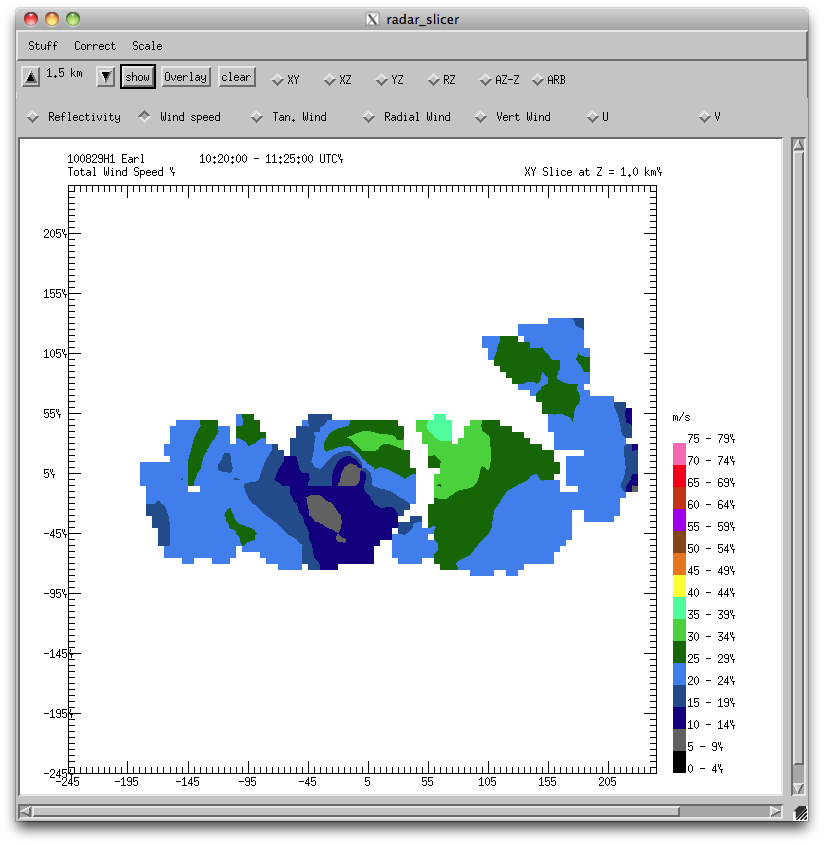
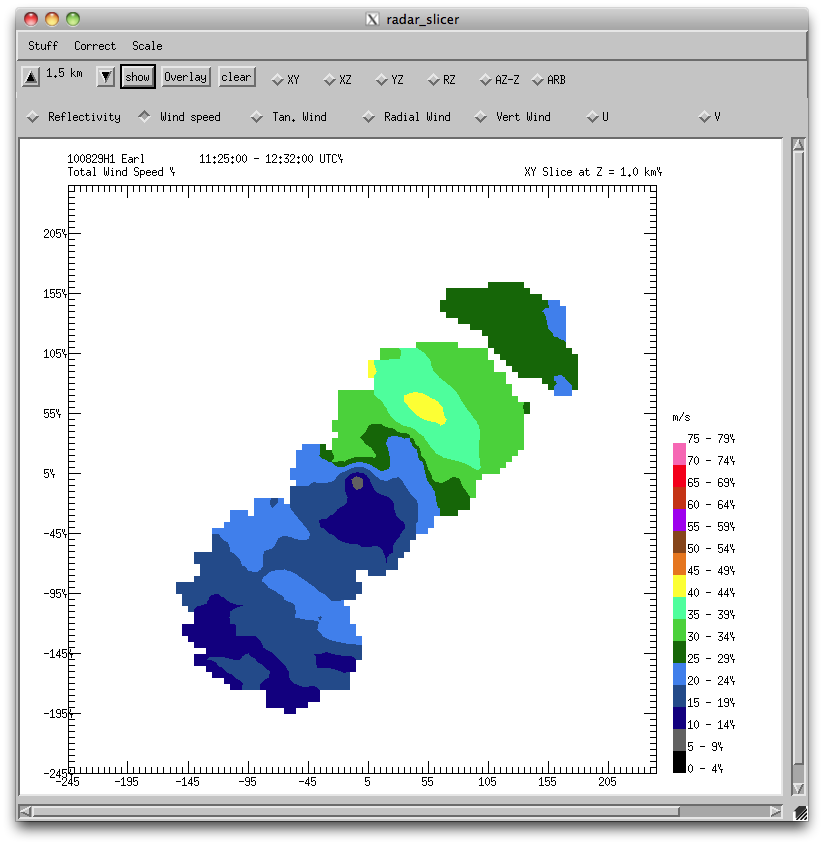
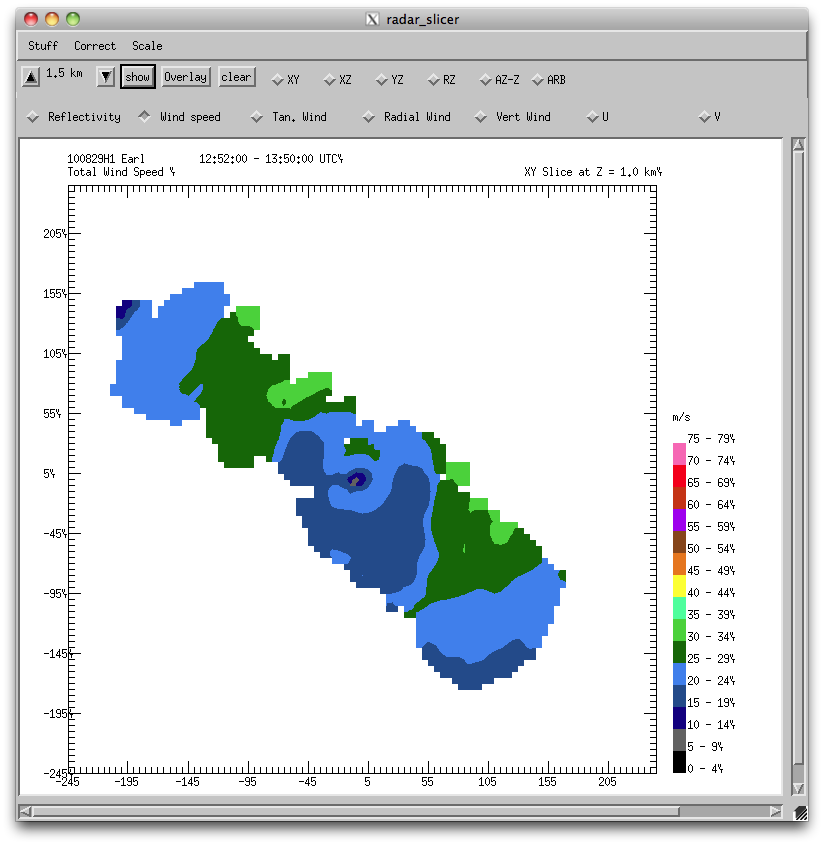
The Doppler/dropsonde composite analysis for this flight (Fig. 7) showed a fairly symmetric wind field, when the 8 m/s storm motion is subtracted from the winds on the north side, and added to the winds on the south side. Earl had organized well enough to be ready for the major intensification to follow. The four individual Doppler analyses from each flight leg (Fig. 8) indicated the intensification, particularly the increase in wind speed on the NE side of the storm.
 a |
 b |
 c |

Sondes launched in Earl showed dewpoint depressions less than 4° Celsius from 650 mb, except for the one directly north of Earl at 105 nm radius. That sounding showed nearly 20 Celsius degrees dewpoint depression. It was early in the flight and on the side with the northerly shear. The sounding at 52nm north of Earl center was nearly saturated. Sondes on the south side showed nearly or fully saturated on from 650 mb to surface. Thus, by this time, Earl was probably not being affected as adversely by dry air as during 20100828I1. As the flight progressed the aircraft was on the NE side of the storm, where hurricane force winds were found by the SFMR.
This was a very successful flight, as it observed well the three-dimensional wind field and low-level thermodynamic field. This was flight 2 of 5 successive 12-hourly missions that documented the organizing and eventual rapid intensification of Hurricane Earl.
 a |
 b |
 c |
 a |
 b |
 c |
 d |
Problems :
There were some problems related to getting sonde information from the AVAPS station to the HP workstation for editing. The tail Doppler radar was down from 1043-1050 UTC, during the penetration of the eastern eyewall. As far as the three-dimensional wind composite from the the full flight is concerned, this was nicely covered by the other three passes through the center.
John Gamache
Sept. 20, 2010
serial | NetCDF | 1 second data | |
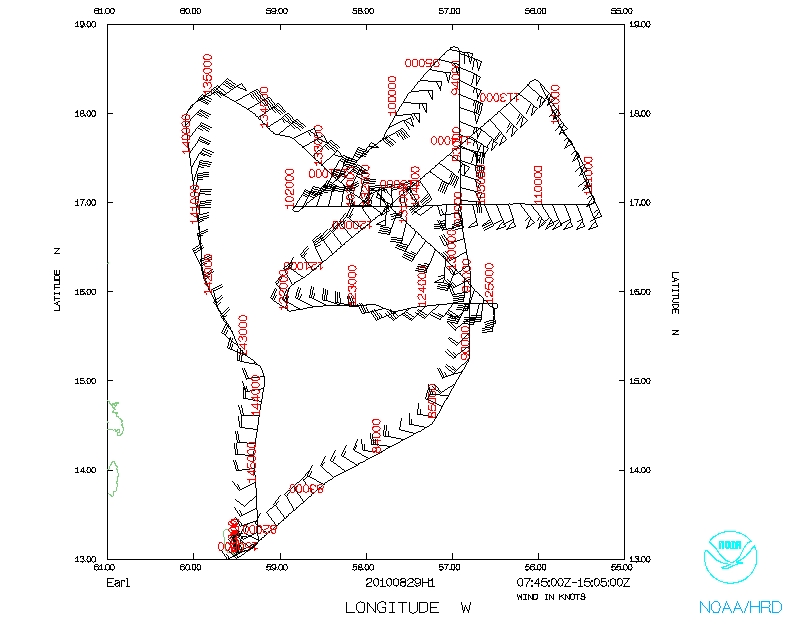 Flight track |
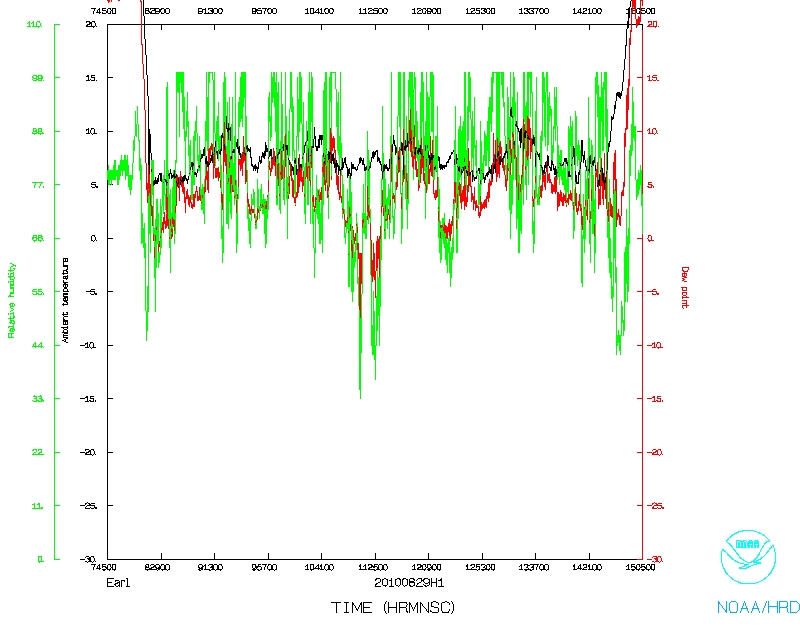 Temperature and Moisture |
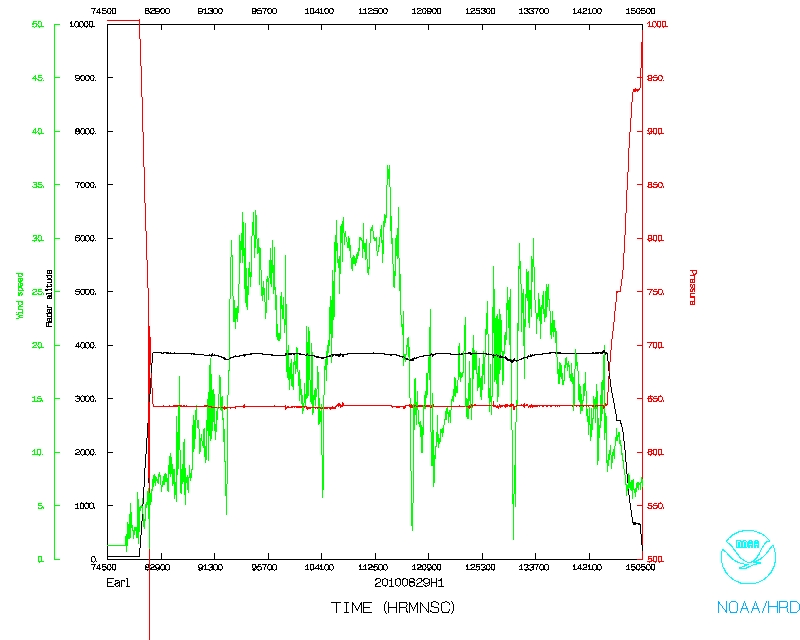 Wind and Atlitude |
Page last updated Sept. 21, 2010
Return to Mission page.