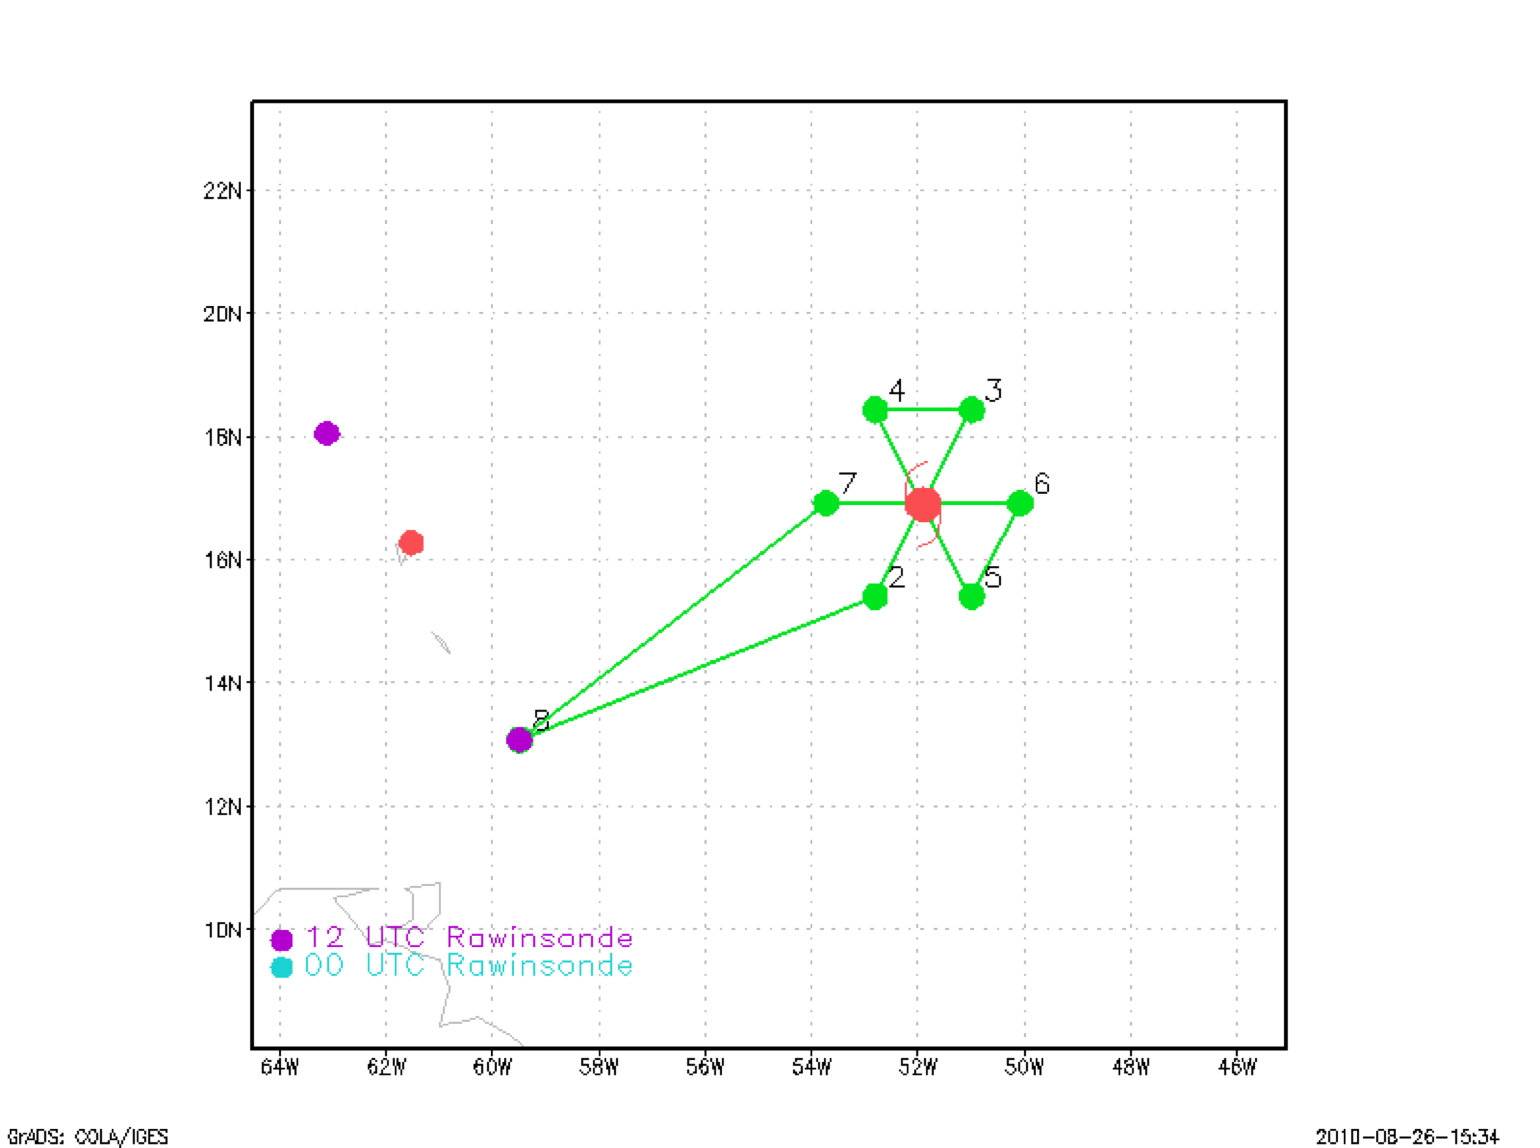
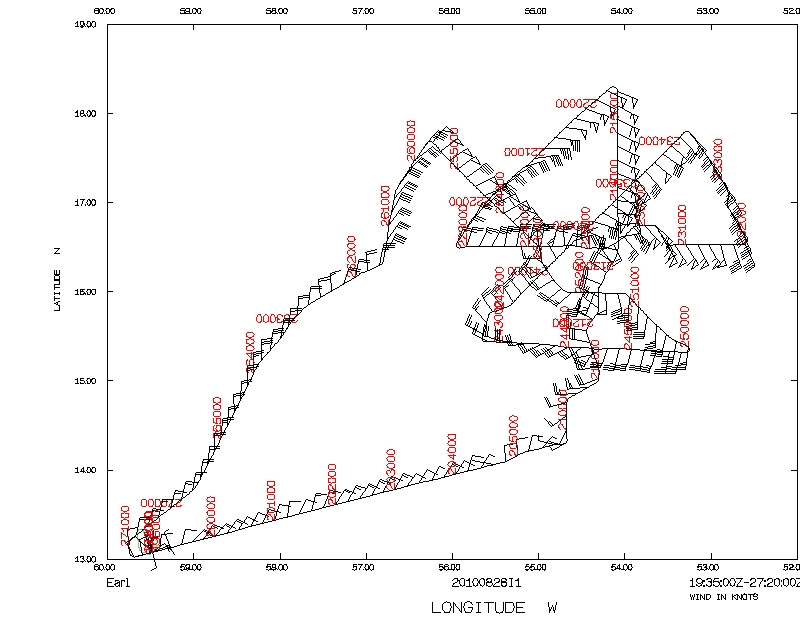
Figure 1: Planned flight track for NOAA 43. Note: This pattern was slightly modified to a rotated figure 4 pattern prior to take-off.
| Aircraft Commander | Mark Nelson |
| Co-pilot | Justin Kibbey |
| Co-pilot | Harris Halverson |
| Flight Engineer | Greg Bast |
| Flight Engineer | Ken Heystek |
| Navigator | Chris Sloan |
| Flight Director | Ian Sears |
| Flight Director | Paul Flaherty |
| Data Technician | Dana Naeher |
| Electronics Technician | Damon Sans Souci |
| Electronics Technician | Bob Peek |
| Electronics Technician | Mike Mascaro |
| Lead Scientist | Joe Cione |
| Radar Scientist | Shirley Muriilo |
| Dropsonde Scientist | Paul Leighton |
| Cloud Physics Scientist | Terry Lathem (GeorgiaTech) |
| Guest Scientist | Jason Dvorsky (UMass) |
| Guest Scientist | Joe Sapp (UMass) |
|
|
Mission Plan :
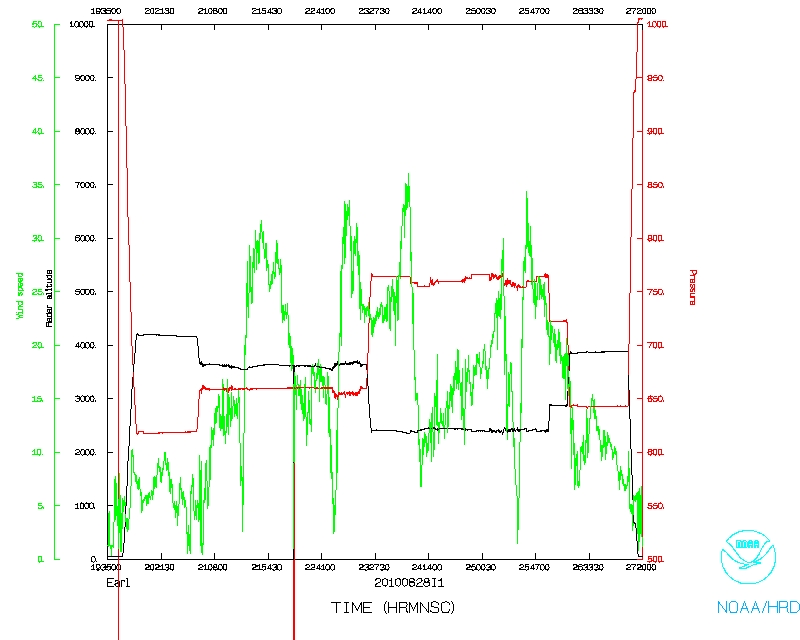
Prior to the flight, the system of interest was classified by NHC as a tropical storm. At takeoff (1948UTC 28 August), Tropical Storm Earl had an estimated maximum intensity of 50kt and a estimated center of circulation near 16.5°N 54.2°W. Our flight was the first manned aircraft scheduled to sample Earl. The planned mission for the 28th was a 3-penetration butterfly pattern that incorporated standard 105 mi legs. The original flight track geometry for this mission is given in Figure 1. Prior to takeoff, the flight track was modified to a rotated figure 4 design (not shown). Still, the area covered was very similar to what is shown in Figure 1 below. Since this was a combination TDR and Ocean Winds experiment, the experiment was conducted at 12k ft (radar) for the first figure 4 at which point the aircraft descended to 8K ft (radar) and remained there for the duration of the mission. Total flight time was 7 hours and 29 minutes. Follow-on missions for 8/29 were planned for N43. In addition , coordinated 8/29 0800 and 1700 follow-on missions were also planned for N42 and N49.
Mission Summary :
| Take off | Landing
| Barbados | 28/19:48 UTC
| Barbados | 29/03:16 UTC
| | ||
Prior to beginning our mission, it was of interest to assess the overall large scale environment in and around Earl as depicted by satellite (Figure 2a-c).
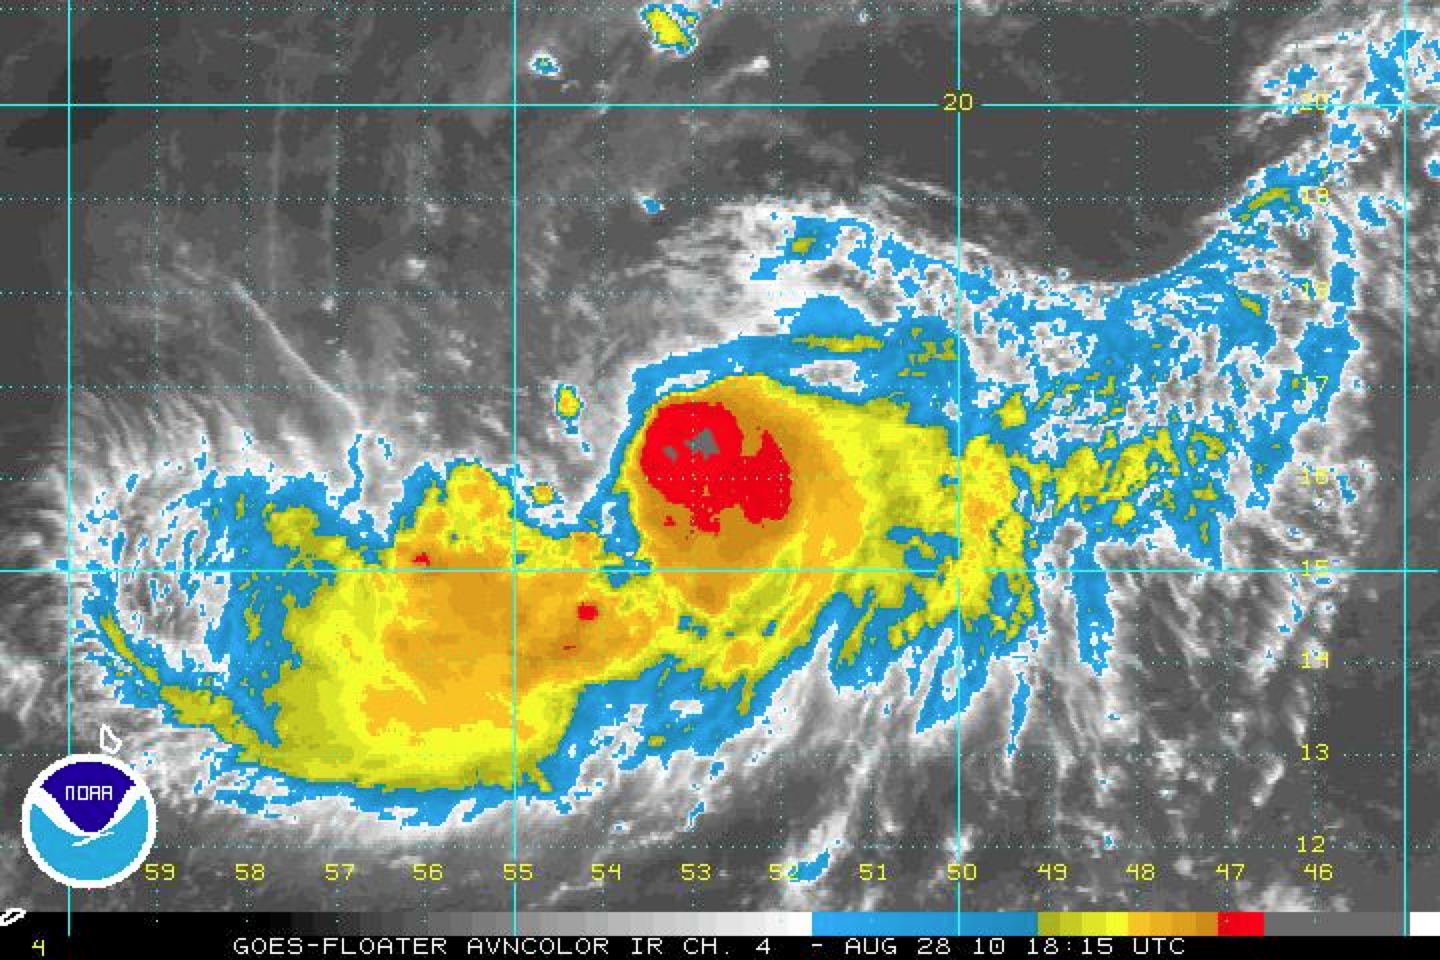
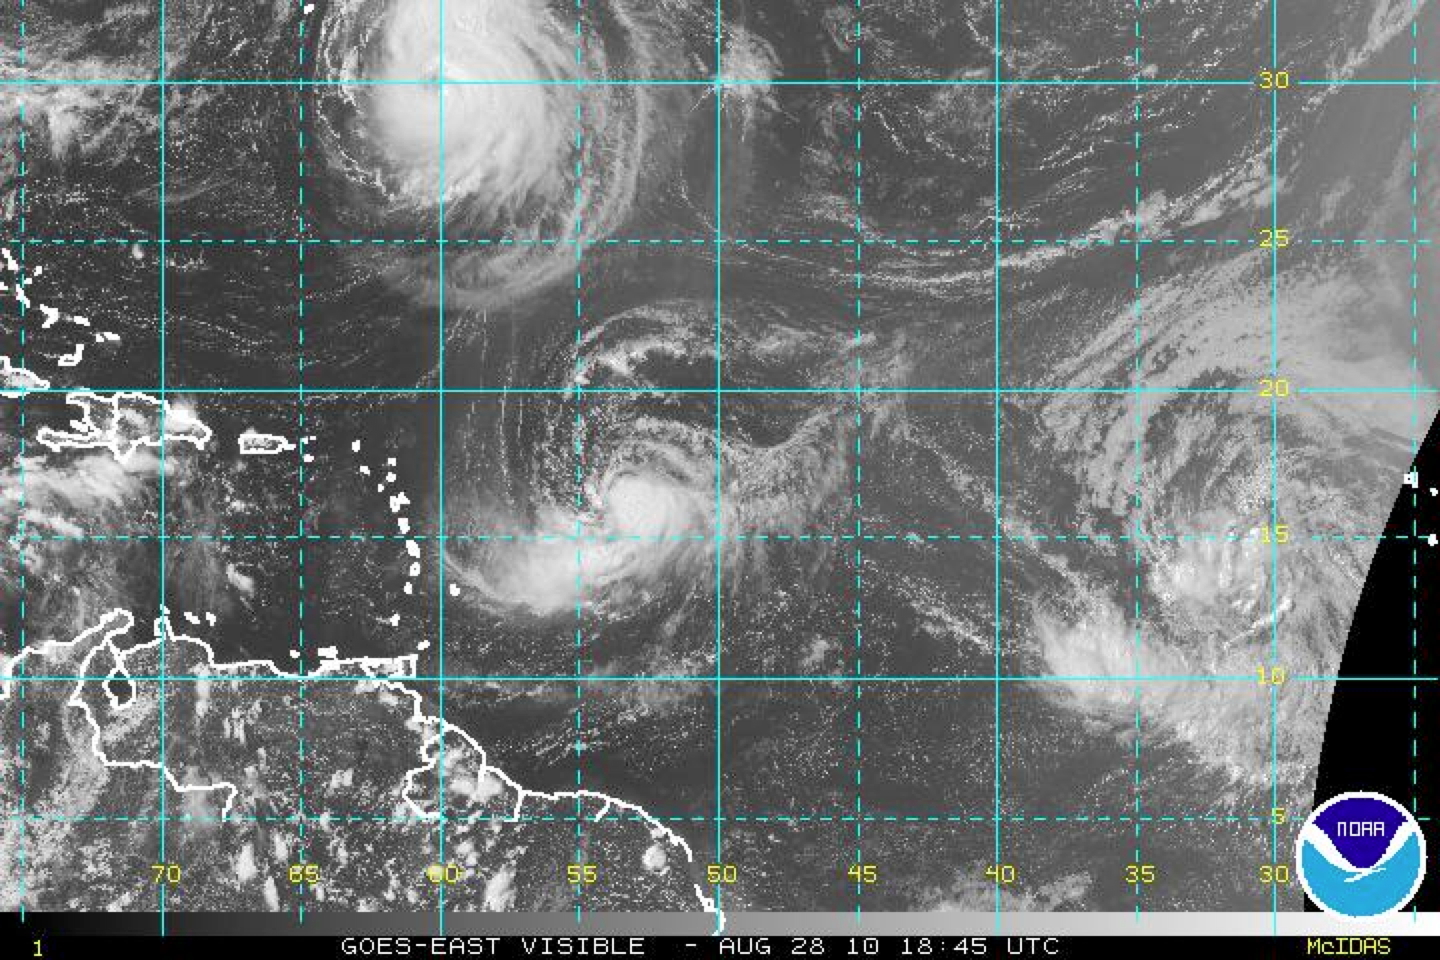
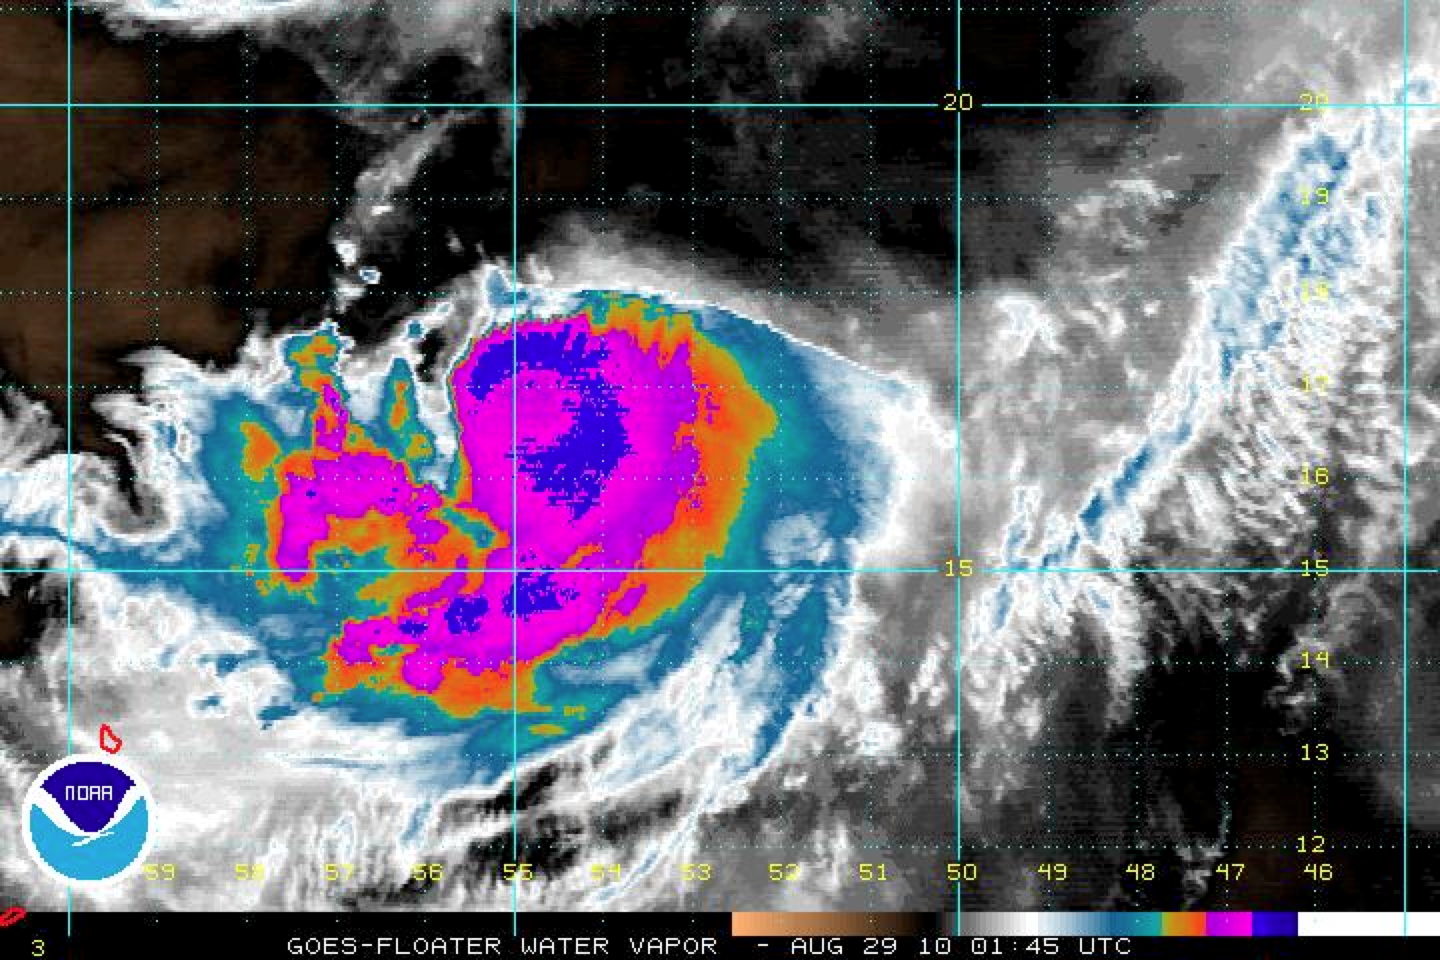
These images depict two interesting trends that appear to be impacting Earl at this time. Drier condition are generally found to the north of the circulation center while northerly shear conditions appear to be impacting Earl's outflow on the storm's poleward side. The shear pattern looks to be a direct result of outflow from major Hurricane Danielle (Figure 2b). As the subsequent mission summary will bear out, this overall large scale pattern of drier air and northerly shear on the poleward side of the storm would hold true throughout much of N43's follow-on flight conducted on the 29th.
As previously mentioned, N43's (on-time) takeoff occurred at 1948Z. Ferry altitude was ~13kft. As Figure 1 illustrates, The IP for NOAA 43 required a NE heading in order to enter the storm from the south/south east. Since the storm was not yet a mature hurricane with associated organized convective structure, the plan was to drop GPS sondes at each 105nmi endpoint, then again at the 52.5 mile mid-point (vs. at the likely-to-be non existent 'eyewall'). Once through the center of circulation, the drop sequence was then reversed (i.e. mid point, endpoint). On the first and last legs through the system, eye/center fix sondes were also planned. In order to meet mission requirements for both experiments conducted on this flight, 12Kft (radar) altitude was maintained during the first figure 4 (TDR) and 8Kft (radar) was held during the final figure 4 (Ocean Winds). Also, in order to minimize interference between the TDR and Ocean Winds hardware, Doppler radar was run in 'wedge mode' when the aircraft was at lower altitude during the final figure 4 pass through the storm. During the fist figure 4 the TDR was run in "FAST" mode.
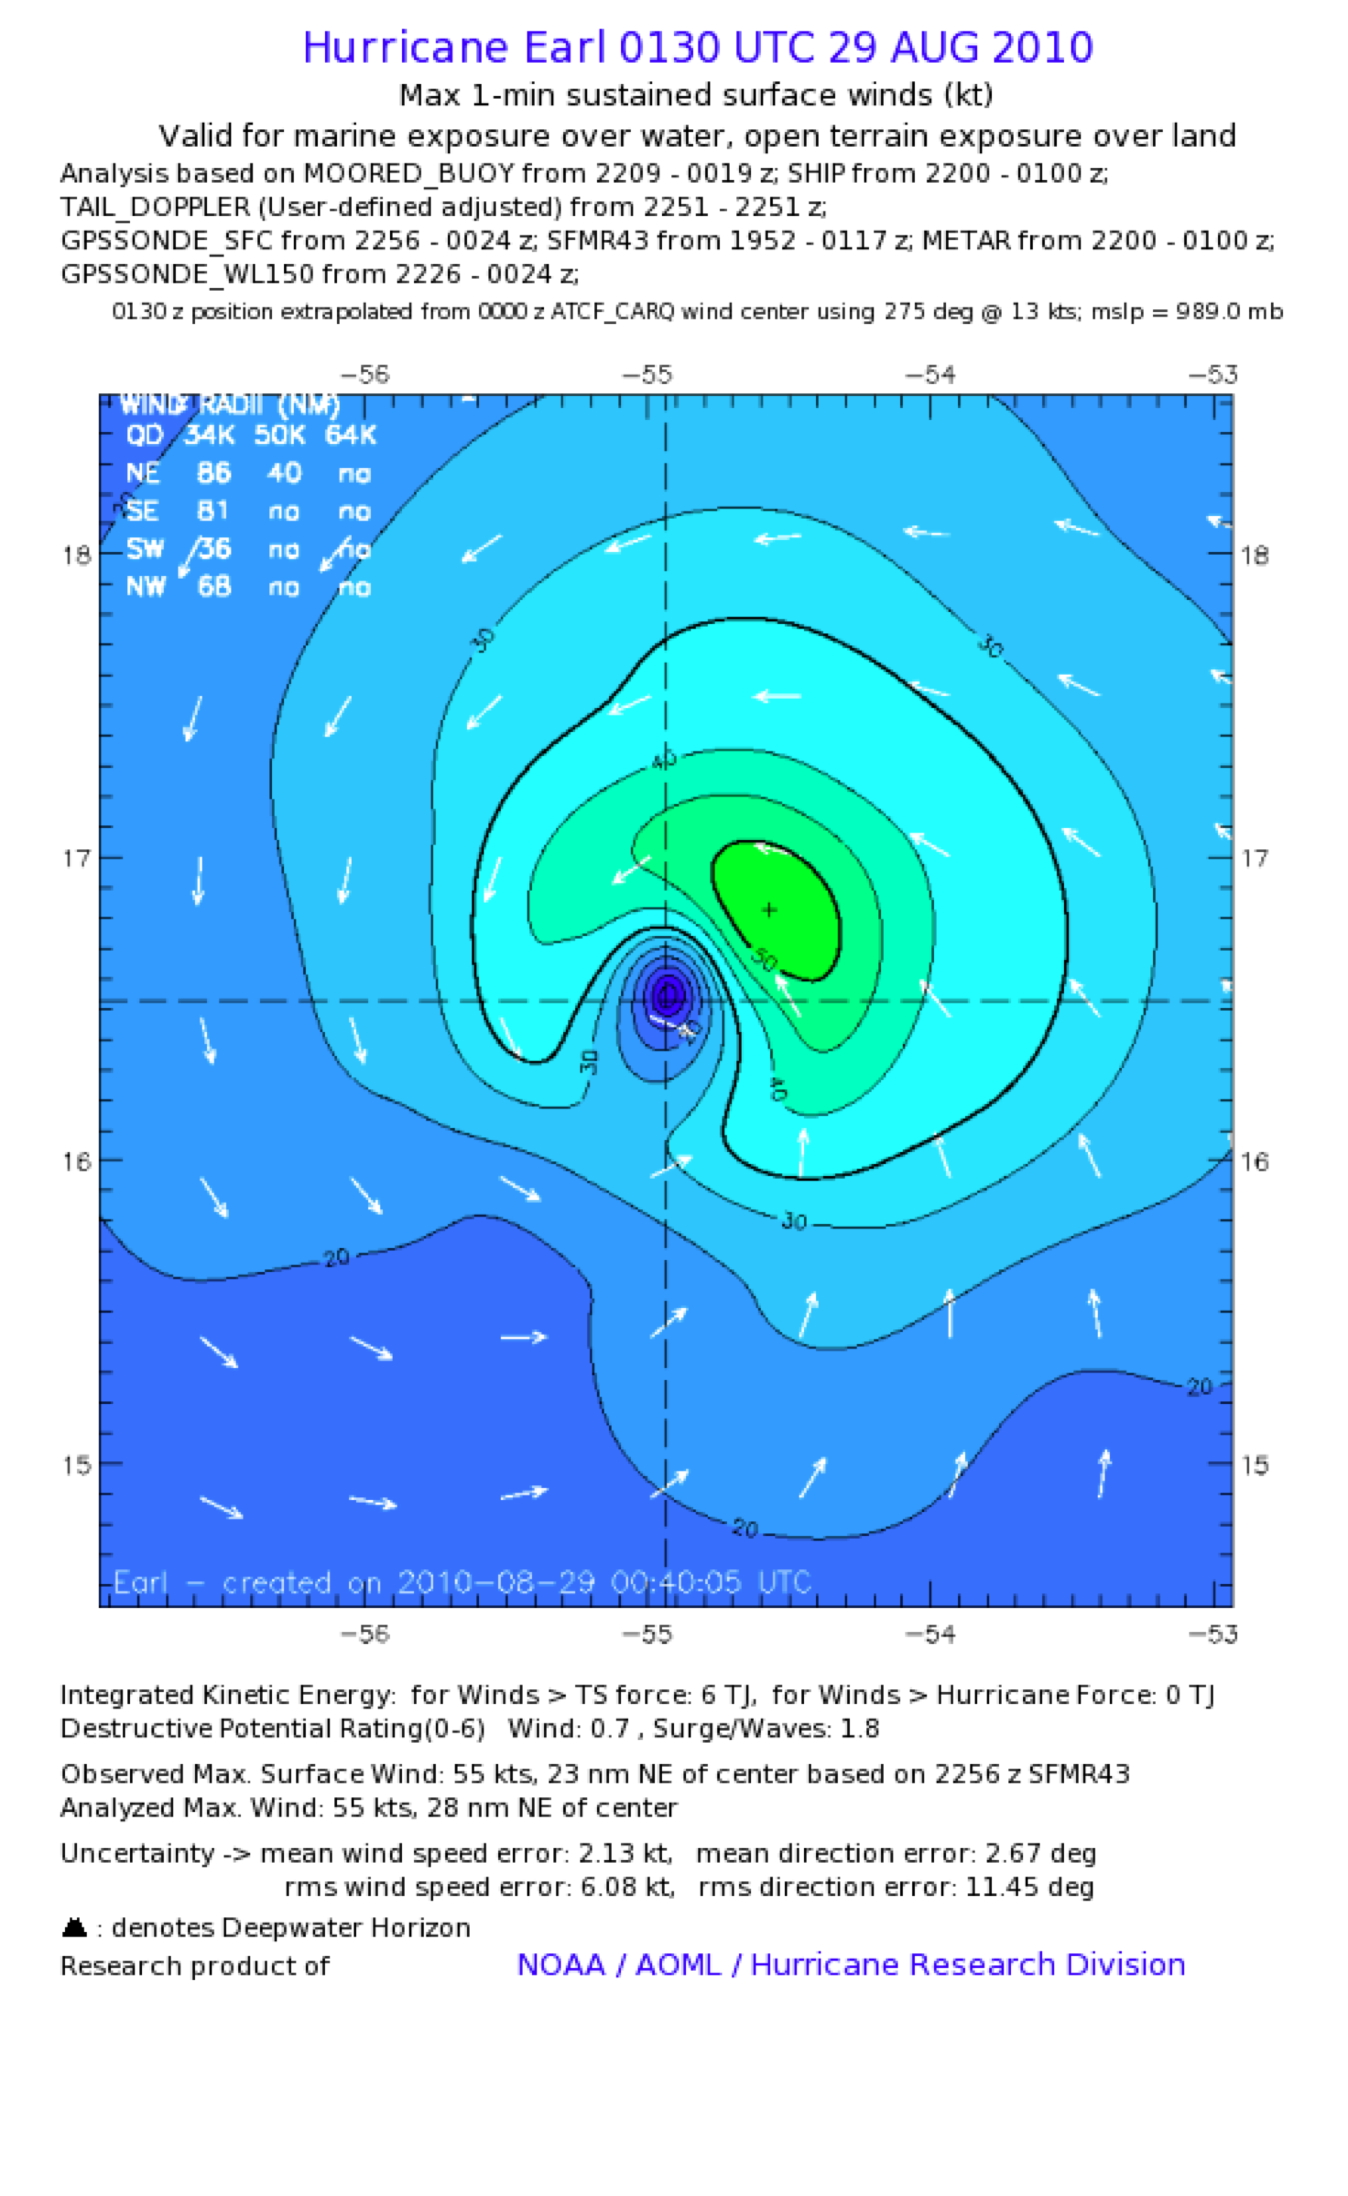
Once in the storm, relatively drier conditions were found on the northern half of the storm. Generally speaking, most of the convective activity was confined to the south and southeast quadrants of the storm, confirming the pattern suggested on satellite imagery. As expected, due to the fast forward motion of Earl at this time, the peak SFMR surface winds were found on the right/north side of the storm (55kts). Analyses of surface wind speed (Figure 3) and N43 1km Doppler-derived wind speed and direction (Figure 4a) are provided below. Also, as expected, the vertical extent of the storm circulation at this time decreased significantly with height (Figures 4b,c).
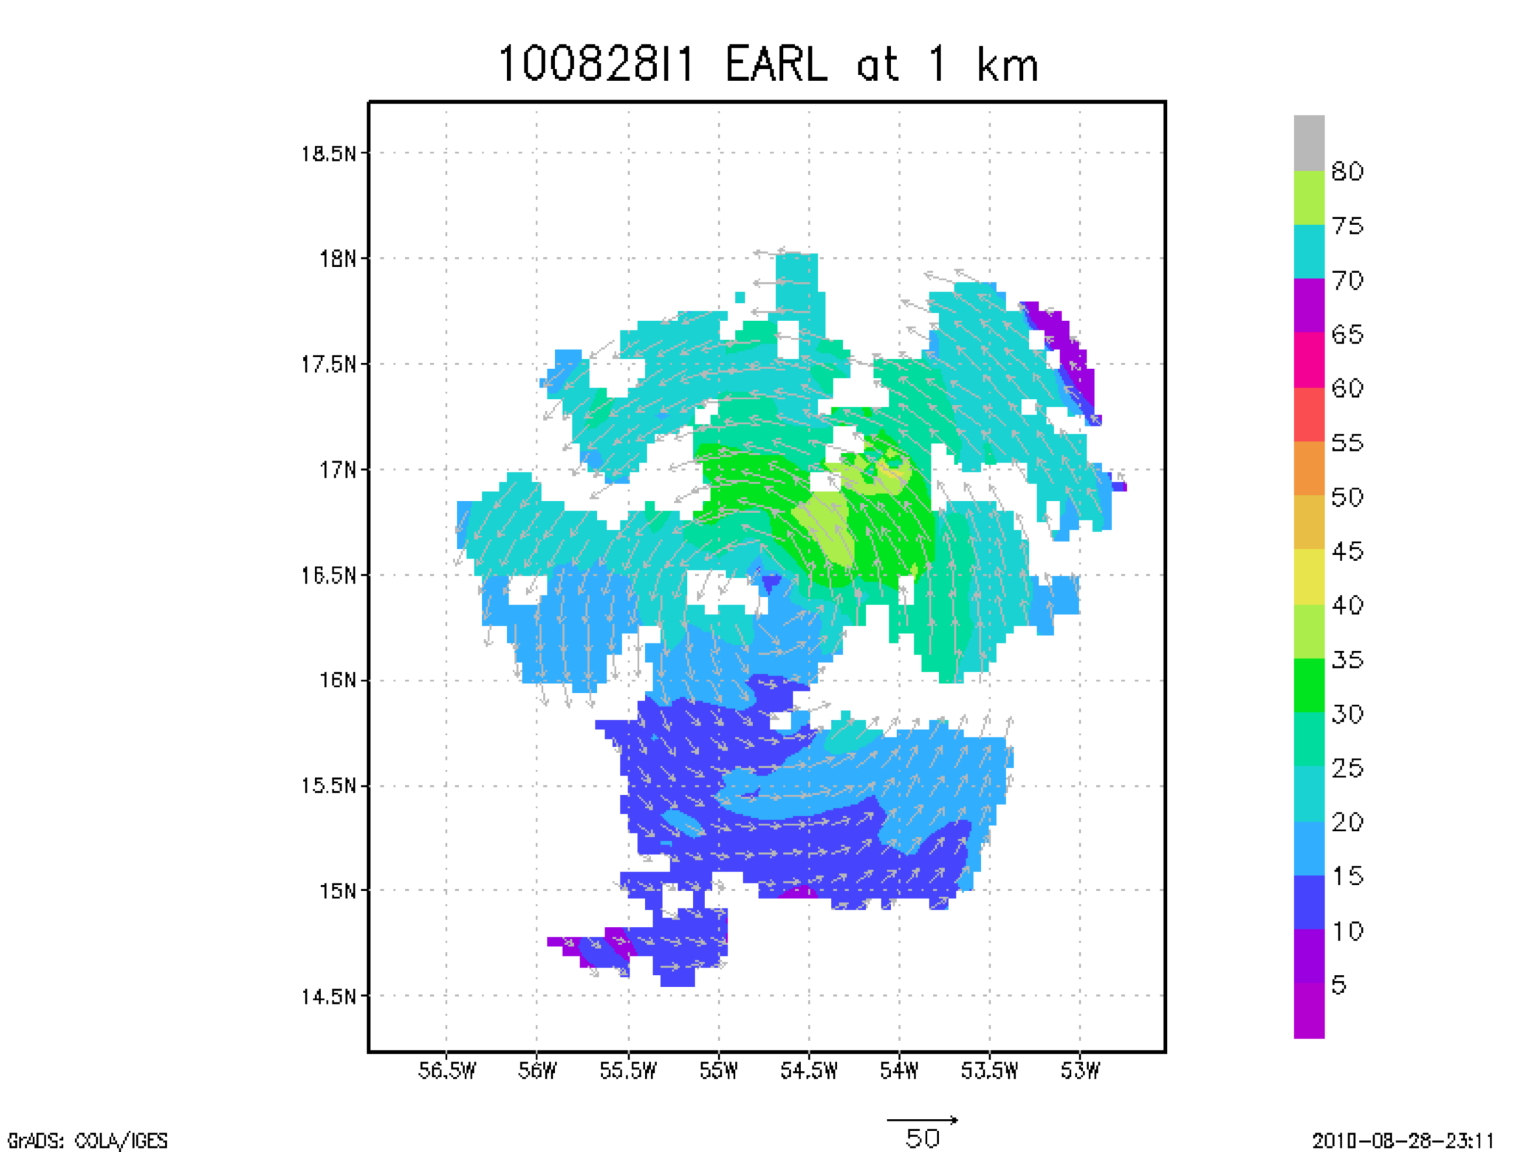
Figure 4a. Quick-look (1km altitude) Doppler wind analysis from NOAA 43 during flight 100828I1. | 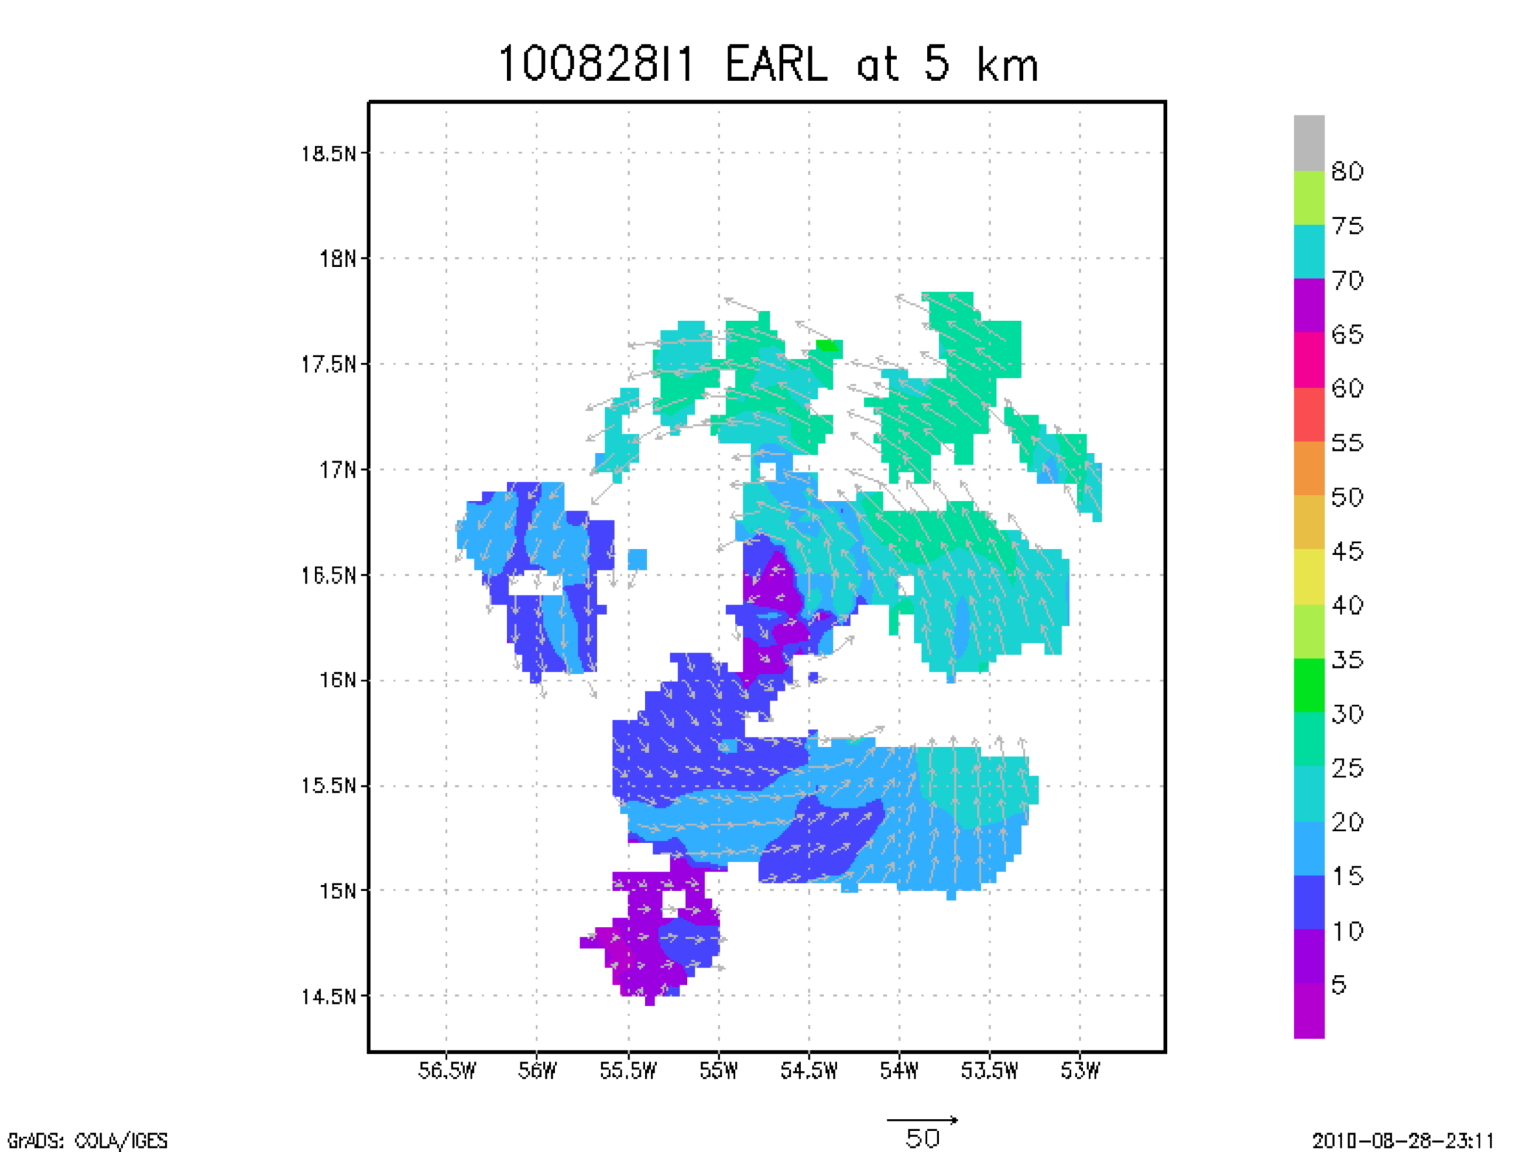
Figure 4b. Quick-look (5km altitude) Doppler wind analysis from NOAA 43 during flight 100828I1 | 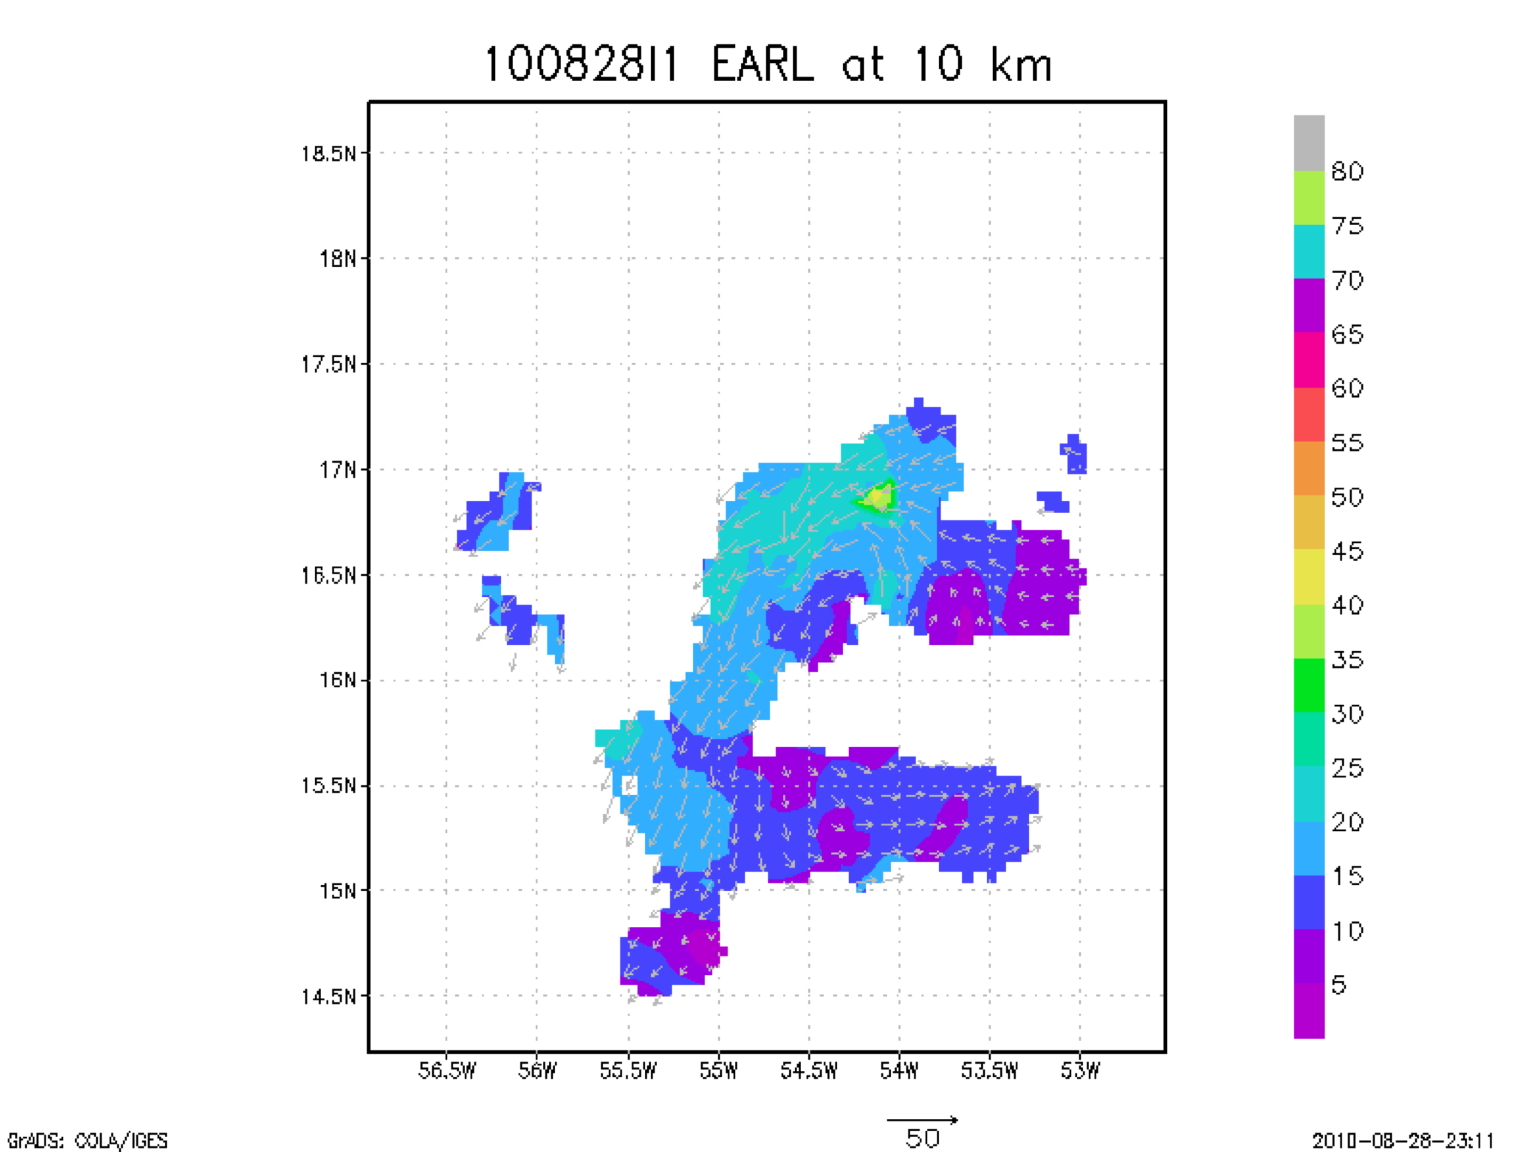
Figure 4c. Quick-look (10km altitude) Doppler wind analysis from NOAA 43 during flight 100828I1. |
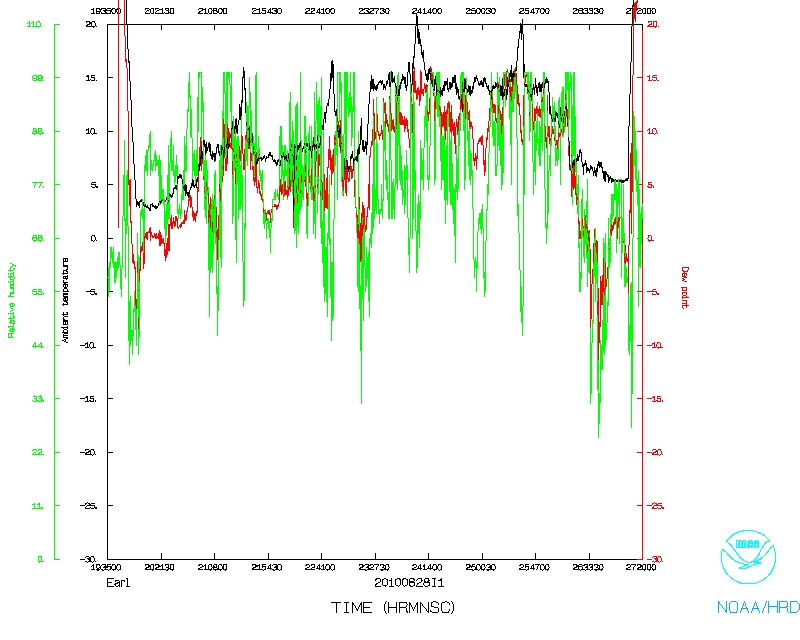
MSLP, obtained from a GPS dropsonde, was ~989 mb for this mission. As previously mentioned, throughout this flight there was evidence that dry air was getting into the core circulation, especially on the northern half of the storm. In fact, during much of the flight, it was precipitation-free on the north and northwest side. GPS sonde observations from this flight also confirmed that some of this dry air was making its way into the core of the storm and as such likely impacted on the precipitation pattern observed (or at times not observed) during this flight.
Problems :
The radar, flight-level, SFMR, and dropsonde systems for the most part all worked well on this flight. Doppler analyses were conducted and successfully sent off the plane in real time. There were a few GPS sondes that did not get winds and had to be backed up and sent out. In addition, a couple of supplemental sondes were released in order to sample interesting convective features that were observed. In all, 23 (vs. the planned 18) GPS sondes were released. The only potential problem/issue was one of communication. During portions of this flight, we avoided convection and deviated from our planned flight track at times. This was possible since the developing tropical storm lacked a full precipitation shield during most of the flight. As such it was possible for flight to avoid major convective cells as they popped up. Once it was made clear that we did want to sample some of these blow-ups (with of course safety still being paramount) subsequent off-course deviations were mostly avoided. Overall not a major issue, but noted here in case questions arise later regarding 'the geometry' with respect portions of the actual track executed during this mission.
Joseph Cione
09/07/10
NetCDF | 1 second data | |
 Flight track |
 Temperature and Moisture |
 Wind and Atlitude |
Page last updated Sept. 09, 2010
Return to Mission page.